

|
시장보고서
상품코드
2114348
하이엔드 가속도계 : 시장 점유율 분석, 업계 동향과 통계, 성장 예측(2026-2031년)High-End Accelerometer - Market Share Analysis, Industry Trends & Statistics, Growth Forecasts (2026 - 2031) |
||||||
 Mordor Intelligence
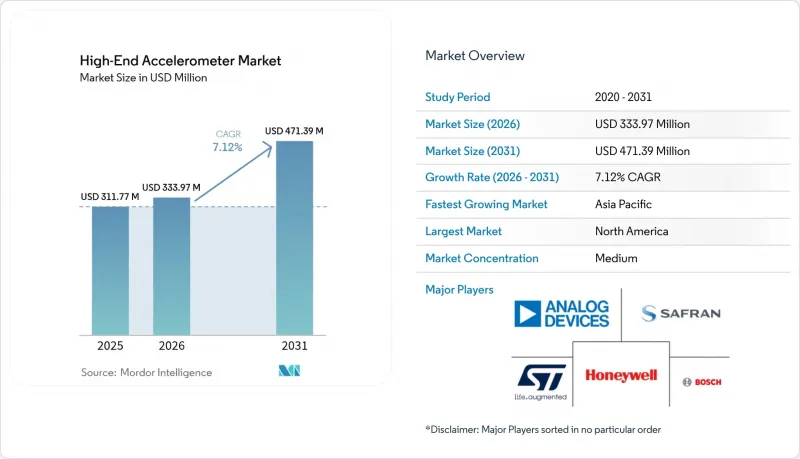
Mordor Intelligence에 따르면 하이엔드 가속도계 시장 규모는 2025년에 3억 1,177만 달러로 평가되며, 2026년 3억 3,397만 달러에서 2031년까지 4억 7,139만 달러에 달할 것으로 예측되고 있으며, 예측 기간(2026-2031년)에 CAGR은 7.12%에 달할 전망입니다.
이 보고서는 기술별(MEMS, 압전, 피에조저항형, 석영), 축 유형별(단축, 2축, 기타), 성능 등급별(산업용, 전술용, 항법용, 전략용),최종 용도 산업별(방위·항공우주, 자동차, 산업 기계, 가전제품, 기타), 지역별로 분류되어 있습니다. 시장 예측은 금액(달러) 기준으로 제시되어 있습니다.
글로벌 하이엔드 가속도계 시장의 동향 및 인사이트
MEMS 소형화에 따른 SWaP-C 감소
2mm² 이하의 면적과 2µA 이하의 대기 전류 덕분에, 5년 전만 해도 비용 면에서 실현이 어려웠던 웨어러블, 드론, 배터리 모니터링과 같은 사용 사례가 가능해졌습니다. 현재, 폐쇄 루프 시그마-델타 코어는 ±16G 범위에서 0.1%의 비선형성을 실현하고 있으며, 많은 중급 수준의 용도에서 수정 발진기와 견줄 만한 성능을 발휘하고 있습니다. 대량 생산 라인에서 축당 비용은 0.5달러 미만이지만, 전술 용도의 밀폐형 MEMS 부품의 경우 장시간 번인 및 온도 보정이 필요하므로 여전히 200-500달러 가격대를 유지하고 있습니다.
방위·항공우주 부문의 현대화 예산
미국 국방부는 2024 회계연도에 미사일 방어 관련 지출을 전년 대비 12% 증가한 335억 달러로 증액하여, 관성 서브시스템에 대한 다년간의 수요를 확보했습니다. GDP의 2%라는 국방비 목표를 달성해 가고 있는 NATO 회원국에서는 포탄의 기폭장치와 무인 항공기의 유도 시스템 업데이트가 진행되고 있습니다. 인도의 기술 개발 기금은 고성능 가속도계의 공급을 현지화하기 위해 100억 인도 루피(1억 2,000만 달러)를 배정했습니다.
높은 교정 및 패키징 비용
내비게이션용 등급 부품의 경우, -40°C-+85°C의 온도 범위에서 6방향 텀블 테스트가 필요하며, 1개 유닛당 최대 12시간이 소요됩니다. 티타늄 재질의 기밀 덮개는 80-150달러의 추가 비용이 발생하지만, 10년 동안 바이어스 드리프트를 25µg 이내로 억제할 수 있습니다. ISO/IEC 17025 인증을 받은 계측 기술자의 부족으로 인해 단기적인 생산 능력 확대는 제한되고 있습니다.
부문 분석
석영 가속도계는 2026-2031년까지 연평균 성장률(CAGR) 8.74%로 성장하여, 전체 하이엔드 가속도계 시장의 성장률을 상회할 것으로 예측됩니다. 10µg 이하의 바이어스 안정성 덕분에 잠수함이나 GPS 신호를 수신할 수 없는 항공기에서도 수 주간 항로를 유지할 수 있으며, 전 세계에서 10개 미만의 인증 제조업체가 이를 지원하고 있습니다. MEMS는 소비자용 및 자동차용 제품의 생산량에 힘입어 2025년 시점에 하이엔드 가속도계 시장에서 60.25%의 점유율을 유지했으나, 열기계적 노이즈로 인해 바이어스 안정성의 하한이 50µg 부근에 머물러 있습니다. 10kHz 이상의 진동 모니터링 부문에서는 압전식 유닛이 주류를 이루는 반면, 압전 저항식 스택은 200°C의 광산 내부 환경에도 견딜 수 있습니다.
Honeywell의 민간 항공기용 기준 시스템 제품 라인인 ‘QA-3000’에서는 석영 가속도계 수요가 11% 급증했습니다. 탈레스(Thales)가 개발한 새로운 폐쇄 루프 전자 회로 덕분에 배선량이 30% 감소하고 EMI 내성이 15dB 향상되었습니다. 신흥 자율무인잠수정(AUV)에서는 25µg의 드리프트 상한이 사양으로 정해져 있으며, 이것이 석영 가속도계의 성장세를 더욱 지원하고 있습니다.
2025년에는 3축 장치가 하이엔드 가속도계 시장에서 60.65%의 점유율을 차지하며 시장을 주도했으나,자동차 산업의 Tier 1 공급업체들이 하네스 무게와 보정 시간 절감을 목적으로 가속도계와 자이로스코프 패키지를 통합함에 따라 6축 IMU는 연평균 성장률(CAGR) 8.95%로 더욱 빠르게 성장할 것으로 예상됩니다. TDK의 ICM-42688은 32kHz 동기식 샘플링 기능을 통해 15개의 자율주행차 플랫폼에 채택되었습니다.
Bosch의 BMI323은 제스처 인식 알고리즘을 내부에서 실행하여 상시 가동형 웨어러블 기기의 전력 소비를 40% 절감합니다. 건설 기계 분야에서는 2축 경사계에 대한 수요가 계속될 것으로 예상되며, 롤 및 피치 데이터만으로 충분한 경우에는 3축을 생략함으로써 시스템 비용을 25% 절감하고 있습니다.
지역별 분석
북미는 2025년 하이엔드 가속도계 시장 매출의 37.80%를 차지했으며, 이는 미국 국방부의 18억 달러 규모의 관성 센서 조달에 힘입은 결과입니다. 캐나다는 CF-18의 관성 시스템을 업데이트하기 위해 12억 캐나다 달러(8억 8,000만 달러)를 책정했습니다. 멕시코 과달라하라 MEMS 클러스터는 북미의 1,550만 대 자동차 생산을 지원하기 위해 2024년에 25% 확장되었습니다.
아시아태평양은 2031년까지 연평균 성장률(CAGR) 9.05%로 가장 높은 성장세를 보일 것으로 전망됩니다. 이는 중국이 2024년에 950만 대의 전기자동차(EV)를 생산하고, 2025년까지 전자식 안정성 제어(ESC) 장치의 탑재를 의무화할 것으로 예상되기 때문입니다. 일본의 MEMS 파운드리 구상은 8인치 자동차용 등급의 생산 능력을 확대하기 위해 150억 엔(1억 달러)을 투자했습니다. 인도는 MEMS 팹을 위한 생산 연계형 인센티브 제도 하에서 4억 5,000만 달러의 투자를 유치했습니다.
2025년, 유럽 시장 점유율은 24.00%였습니다. 독일의 센서 매출은 32억 유로(34억 달러)에 달했으며, 이는 안정성 및 타이어 공기압 관련 규제의 의무화에 힘입은 결과입니다. EU의 ‘칩법’에서는 STMicroelectronics의 크롤 공장에서 MEMS 파운드리 확장에 25억 유로가 배정되었습니다. 중동의 구매자들이 ITAR(국제무기거래규정) 승인 절차로 인해 납기일을 12개월로 연장함에 따라 사우디아라비아는 국내 조달로 방향을 전환하고 있습니다.
기타 혜택
- 엑셀 형식의 시장 예측(ME) 시트
- 3개월간의 애널리스트 지원
자주 묻는 질문
목차
제1장 서론
제2장 조사 방법
제3장 개요
제4장 시장 구도
제5장 시장 규모와 성장 예측
제6장 경쟁 구도
제7장 시장 기회와 향후 전망
KSA 26.08.26According to Mordor Intelligence, the high-end accelerometer market size was valued at USD 311.77 million in 2025 and estimated to grow from USD 333.97 million in 2026 to reach USD 471.39 million by 2031, at a CAGR of 7.12% during the forecast period (2026-2031).
This report is Segmented by Technology (MEMS, Piezoelectric, Piezoresistive, and Quartz), Axis Type (One-Axis, Two-Axis, and More), Performance Grade (Industrial, Tactical, Navigation, and Strategic), End-Use Industry (Defense and Aerospace, Automotive, Industrial Machinery, Consumer Electronics, and More), and Geography. The Market Forecasts are Provided in Terms of Value (USD).
Global High-End Accelerometer Market Trends and Insights
Rising MEMS Miniaturization Cuts SWaP-C
Areas below 2 mm2 and standby currents under 2 µA have unlocked wearable, drone, and battery-monitoring use cases that were previously cost-prohibitive five years ago. Closed-loop sigma-delta cores now deliver 0.1% nonlinearity across +-16 G ranges, rivaling quartz for many mid-grade missions. The cost per axis in high-volume lines has slipped below USD 0.5; yet, hermetic MEMS parts for tactical roles still command USD 200-500 due to the need for extended burn-in and temperature compensation.
Defense and Aerospace Modernization Budgets
The U.S. Department of Defense increased missile-defense outlays by 12% year over year to USD 33.5 billion in fiscal 2024, securing multi-year demand for inertial subsystems. NATO members reaching the 2% of GDP spending threshold are refreshing artillery fuzes and unmanned aircraft guidance systems. India's Technology Development Fund set aside INR 10 billion (USD 120 million) to localize high-end accelerometer supply.
High Calibration and Packaging Costs
Navigation-grade parts require six-position tumble tests across a temperature range of -40 °C to +85 °C, consuming up to 12 hours per unit. Titanium hermetic lids add USD 80-150, yet shield bias drift to within 25 µg over a decade. The scarcity of ISO/IEC 17025-certified metrologists limits short-term capacity additions.
Other drivers and restraints analyzed in the detailed report include:
- Automotive ADAS and EV Safety Mandates
- Growing Demand for Predictive-Maintenance Sensors
- ITAR/EAR Export-License Delays
For complete list of drivers and restraints, kindly check the Table Of Contents.
Segment Analysis
Quartz accelerometers are projected to outpace the overall High-end accelerometer market at a 8.74% CAGR during the 2026-2031 period. Their less than 10 µg bias stability keeps submarine and GPS-denied aircraft on course for weeks, supporting fewer than 10 qualified global producers. MEMS maintained a 60.25% High-end accelerometer market share in 2025, driven by consumer and automotive volumes, but it confronts a bias-stability floor near 50 µg due to thermo-mechanical noise. Piezoelectric units dominate vibration monitoring above 10 kHz, while piezoresistive stacks withstand 200 °C downhole environments.
Demand for quartz surged 11% in Honeywell's QA-3000 line supplying commercial-aircraft reference systems. New closed-loop electronics from Thales reduced wiring by 30% and improved EMI immunity by 15 dB. Emerging autonomous underwater vehicles specify 25 µg drift caps, reinforcing quartz momentum.
Three-axis devices led the High-end accelerometer market with a 60.65% share in 2025, but six-axis IMUs are expected to grow faster at a 8.95% CAGR, as automotive Tier-1s consolidate accelerometer-gyroscope packages to reduce harness weight and calibration time. TDK's ICM-42688 secured design wins on 15 autonomous-vehicle platforms for its 32 kHz synchronous sampling.
Bosch's BMI323 executes gesture-recognition algorithms internally, reducing the power consumption of always-on wearables by 40%. Two-axis tiltmeter demand persists in construction equipment, trading off the third axis to save 25% of the system cost when roll-pitch data suffice.
Complete Report Scope:
- By Technology
- MEMS
- Piezoelectric
- Piezoresistive
- Quartz
- By Axis Type
- One-Axis
- Two-Axis
- Three-Axis
- Six-Axis / IMU Combo
- By Performance Grade
- Industrial
- Tactical
- Navigation
- Strategic
- By End-Use Industry
- Defense and Aerospace
- Automotive
- Industrial Machinery
- Consumer Electronics
- Healthcare
- Other End-Use Industries
- By Geography
- North America
- United States
- Canada
- Mexico
- South America
- Brazil
- Argentina
- Rest of South America
- Europe
- Germany
- United Kingdom
- France
- Italy
- Spain
- Russia
- Rest of Europe
- Asia-Pacific
- China
- Japan
- India
- South Korea
- Australia
- Rest of Asia-Pacific
- Middle East and Africa
- Middle East
- Saudi Arabia
- United Arab Emirates
- Turkey
- Rest of Middle East
- Africa
- South Africa
- Nigeria
- Egypt
- Rest of Africa
- Middle East
- North America
Geography Analysis
North America retained 37.80% of the High-end accelerometer market revenue in 2025, buoyed by USD 1.8 billion in U.S. defense inertial-sensor procurement. Canada earmarked CAD 1.2 billion (USD 880 million) to update CF-18 inertial systems. Mexico's Guadalajara MEMS cluster expanded 25% in 2024 to support 15.5 million North American vehicle builds.
The Asia-Pacific is set for the fastest 9.05% CAGR through 2031, as China produced 9.5 million EVs in 2024 and is expected to implement mandatory electronic stability control by 2025. Japan's MEMS Foundry Initiative invested JPY 15 billion (USD 100 million) to lift 8-inch automotive-grade capacity. India attracted USD 450 million under its production-linked incentive scheme for MEMS fabs.
Europe held a 24.00% market share in 2025. German sensor sales reached EUR 3.2 billion (USD 3.4 billion), sustained by mandatory stability and tire-pressure rules. The EU Chips Act allocates EUR 2.5 billion for the expansion of MEMS foundries at STMicroelectronics' Crolles site. Middle East buyers lengthened delivery cycles to 12 months due to ITAR approvals, nudging Saudi Arabia toward indigenous sourcing.
- Analog Devices Inc.
- Robert Bosch GmbH
- Honeywell International Inc.
- STMicroelectronics NV
- Safran Colibrys SA
- Sensonor AS
- Physical Logic Ltd
- Innalabs Limited
- TE Connectivity Ltd
- Thales Group
- Northrop Grumman Corporation
- Kistler Group
- PCB Piezotronics Inc.
- Meggitt PLC
- Murata Manufacturing Co., Ltd.
- TDK Corporation (InvenSense)
- Dytran Instruments Inc.
- Silicon Sensing Systems Ltd.
- KVH Industries Inc.
- Tronics Microsystems SA
Additional Benefits:
- The market estimate (ME) sheet in Excel format
- 3 months of analyst support
TABLE OF CONTENTS
1 INTRODUCTION
- 1.1 Study Assumptions and Market Definition
- 1.2 Scope of the Study
2 RESEARCH METHODOLOGY
3 EXECUTIVE SUMMARY
4 MARKET LANDSCAPE
- 4.1 Market Overview
- 4.2 Market Drivers
- 4.2.1 Rising MEMS miniaturisation cuts SWaP-C
- 4.2.2 Defence and aerospace modernisation budgets
- 4.2.3 Automotive ADAS and EV safety mandates
- 4.2.4 Growing demand for predictive-maintenance sensors
- 4.2.5 Quantum-grade bias-stability R&D spill-over
- 4.2.6 LEO-satellite constellations' high-G launch needs
- 4.3 Market Restraints
- 4.3.1 High calibration and packaging costs
- 4.3.2 Supply-chain fragility for specialty ASICs
- 4.3.3 ITAR/EAR export-licence delays
- 4.3.4 In-sensor AI cybersecurity attack-surface growth
- 4.4 Industry Value Chain Analysis
- 4.5 Impact of Macroeconomic Factors
- 4.6 Regulatory Landscape
- 4.7 Technological Outlook
- 4.8 Porter's Five Forces Analysis
- 4.8.1 Threat of New Entrants
- 4.8.2 Bargaining Power of Buyers
- 4.8.3 Bargaining Power of Suppliers
- 4.8.4 Threat of Substitute Products
- 4.8.5 Intensity of Competitive Rivalry
5 MARKET SIZE AND GROWTH FORECASTS (VALUE)
- 5.1 By Technology
- 5.1.1 MEMS
- 5.1.2 Piezoelectric
- 5.1.3 Piezoresistive
- 5.1.4 Quartz
- 5.2 By Axis Type
- 5.2.1 One-Axis
- 5.2.2 Two-Axis
- 5.2.3 Three-Axis
- 5.2.4 Six-Axis / IMU Combo
- 5.3 By Performance Grade
- 5.3.1 Industrial
- 5.3.2 Tactical
- 5.3.3 Navigation
- 5.3.4 Strategic
- 5.4 By End-Use Industry
- 5.4.1 Defense and Aerospace
- 5.4.2 Automotive
- 5.4.3 Industrial Machinery
- 5.4.4 Consumer Electronics
- 5.4.5 Healthcare
- 5.4.6 Other End-Use Industries
- 5.5 By Geography
- 5.5.1 North America
- 5.5.1.1 United States
- 5.5.1.2 Canada
- 5.5.1.3 Mexico
- 5.5.2 South America
- 5.5.2.1 Brazil
- 5.5.2.2 Argentina
- 5.5.2.3 Rest of South America
- 5.5.3 Europe
- 5.5.3.1 Germany
- 5.5.3.2 United Kingdom
- 5.5.3.3 France
- 5.5.3.4 Italy
- 5.5.3.5 Spain
- 5.5.3.6 Russia
- 5.5.3.7 Rest of Europe
- 5.5.4 Asia-Pacific
- 5.5.4.1 China
- 5.5.4.2 Japan
- 5.5.4.3 India
- 5.5.4.4 South Korea
- 5.5.4.5 Australia
- 5.5.4.6 Rest of Asia-Pacific
- 5.5.5 Middle East and Africa
- 5.5.5.1 Middle East
- 5.5.5.1.1 Saudi Arabia
- 5.5.5.1.2 United Arab Emirates
- 5.5.5.1.3 Turkey
- 5.5.5.1.4 Rest of Middle East
- 5.5.5.2 Africa
- 5.5.5.2.1 South Africa
- 5.5.5.2.2 Nigeria
- 5.5.5.2.3 Egypt
- 5.5.5.2.4 Rest of Africa
- 5.5.5.1 Middle East
- 5.5.1 North America
6 COMPETITIVE LANDSCAPE
- 6.1 Market Concentration
- 6.2 Strategic Moves
- 6.3 Market Share Analysis
- 6.4 Company Profiles (includes Global level Overview, Market level overview, Core Segments, Financials as available, Strategic Information, Market Rank/Share for key companies, Products and Services, and Recent Developments)
- 6.4.1 Analog Devices Inc.
- 6.4.2 Robert Bosch GmbH
- 6.4.3 Honeywell International Inc.
- 6.4.4 STMicroelectronics NV
- 6.4.5 Safran Colibrys SA
- 6.4.6 Sensonor AS
- 6.4.7 Physical Logic Ltd
- 6.4.8 Innalabs Limited
- 6.4.9 TE Connectivity Ltd
- 6.4.10 Thales Group
- 6.4.11 Northrop Grumman Corporation
- 6.4.12 Kistler Group
- 6.4.13 PCB Piezotronics Inc.
- 6.4.14 Meggitt PLC
- 6.4.15 Murata Manufacturing Co., Ltd.
- 6.4.16 TDK Corporation (InvenSense)
- 6.4.17 Dytran Instruments Inc.
- 6.4.18 Silicon Sensing Systems Ltd.
- 6.4.19 KVH Industries Inc.
- 6.4.20 Tronics Microsystems SA
7 MARKET OPPORTUNITIES AND FUTURE OUTLOOK
- 7.1 White-Space and Unmet-Need Assessment


