

|
시장보고서
상품코드
2114360
SNP 유전자형 분석 시장 : 시장 점유율 분석, 업계 동향 및 통계, 성장 예측(2026-2031년)SNP Genotyping - Market Share Analysis, Industry Trends & Statistics, Growth Forecasts (2026 - 2031) |
||||||
 Mordor Intelligence
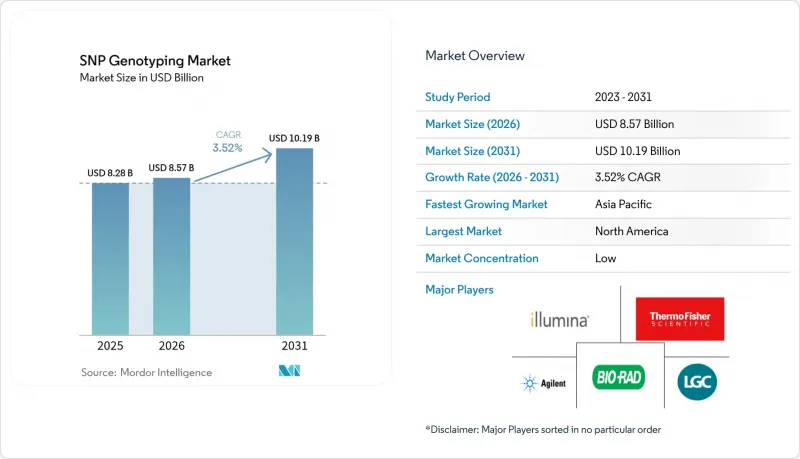
Mordor Intelligence에 의하면, 2026년 SNP 유전자형 분석 시장 규모는 85억 7,000만 달러로 추정되고, 2025년 82억 8,000만 달러에서 확대해, 2031년에는 101억 9,000만 달러에 이를 것으로 예측됩니다.
2026-2031년 연평균 성장률(CAGR)은 3.52%를 나타낼 것으로 전망됩니다.
본 보고서는 기술별(TaqMan SNP 유전자형 분석, Massarray SNP 유전자형 분석 등), 용도별(진단, 약리유전체학 및 정밀의료 등), 최종 사용자별(제약·바이오기술 기업, 학술·연구 기관 등), 지역별(북미, 유럽 등)로 분류되어 있습니다. 시장 전망은 금액(달러) 기준으로 제시되어 있습니다.
세계의 SNP 유전자형 분석 시장 동향 및 인사이트
NGS 비용의 감소와 처리량의 비약적 향상
표면 코팅 및 롤-투-롤 유체 기술을 통해 전체 유전체 리드를 15달러에 얻을 수 있게 되었습니다. 이는 2020년 수준에서 98% 하락한 것으로, 집단 연구 및 자원이 제한된 진료소에 대한 접근성이 확대되고 있습니다. 일루미나(Illumina)사의 NovaSeq X는 샘플당 비용을 어레이 가격보다 낮은 수준으로 낮추었으며, 2027년까지 한 자릿수 후반대의 높은 매출 성장이 예상되는 등 이러한 추세를 상징하고 있습니다. 레인 밀도의 향상으로 수백만 개의 SNP를 병렬로 스크리닝할 수 있게 되었으며, 라이브러리 조제 과정의 소형화를 통해 소모품 비용과 시료 투입량 요구 사항이 감소하고 있습니다. 이전에는 자본 예산의 제약을 받았던 학술 연구 기관도 현재는 대규모 코호트 분석을 수행할 수 있게 되어, 발견까지의 기간을 단축하고 있습니다. 따라서 비용 곡선은 고정 어레이에서 시퀀싱 기반의 SNP 유전자형 분석으로 도입 추세가 기울고 있습니다.
제약 업계의 동반 진단으로의 전환
현재 30건 이상의 동반 진단 관련 제휴를 통해 제약 기업의 투자가 투여량 및 치료법 선택을 안내하는 고정밀 SNP 패널로 향하고 있습니다. 324개의 유전자를 포괄하는 ‘FoundationOne CDx’와 같은 광범위한 분석법에 대한 FDA의 승인은 SNP 판정에 의존하는 다중 바이오마커 전략의 유효성을 입증하고 있습니다. 임상 워크플로우에 통합된 실시간 플랫폼을 통해 적격성 판정에 소요되는 시간이 며칠에서 몇 시간으로 단축되어, 종양학 및 만성 질환 치료에서 진료 당일 처방 지원이 가능해졌습니다. ‘허셉틴’이나 ‘글리벡’과 같은 성공 사례는 그 상업적 타당성을 입증하며, 개발 중인 의약품에서 2상 임상시험 단계부터 유전자형 판정을 도입하도록 뒷받침하고 있습니다. 약리유전학이 연구 단계에서 일상 진료로 전환됨에 따라, 검사실의 처리 능력, 규제 준수, 그리고 결과 보고까지 소요되는 시간이 결정적인 구매 기준이 되고 있습니다.
유능한 바이오정보학자 부족
유전체학 기업의 82%가 AI, 통계학, 분자생물학 기술을 통합할 수 있는 데이터 사이언스자 채용에 어려움을 겪고 있다고 보고하고 있습니다. 고처리량 플랫폼에서 쏟아지는 방대한 데이터는 기존의 분석 파이프라인을 압도하고 있어, 검사실은 프로젝트를 외부에 위탁하거나 연기할 수밖에 없는 상황입니다. 계산 유전체학 분야의 대학 과정 정원이 제한되어 있어 이러한 격차가 장기화되고 있는 반면, 급여 급등은 중소기업에 가장 큰 타격을 주고 있습니다. 신흥 시장에서는 이러한 영향이 가장 심각하게 나타나고 있으며, 장비 가격이 하락하더라도 현지 도입이 제한되고 있습니다. 중기적으로는 기술 재교육 프로그램이나 클라우드를 통한 자동화로 인해 이러한 제약이 완화되겠지만, 완전히 해소되지는 않을 것입니다.
부문 분석
TaqMan은 확립된 실시간 PCR의 정확도와 규제 대상 진단에 적합한 검증된 프로브 화학 기술을 바탕으로 2025년에 SNP 유전자형 분석 시장의 36.85% 점유율을 차지했습니다. AI를 활용한 마이크로플루이딕스 시스템은 현재 그 우위를 입증하고 있으며, 98%의 식별 정확도로 단일 세포 처리를 자동화함으로써 연평균 성장률(CAGR) 4.08%로 성장을 지속하고 있습니다. MassARRAY는 샘플 수가 많은 학술적 스크리닝에서 계속해서 사용되고 있지만, 시퀀싱 비용의 하락에 따라 성장이 정체되고 있습니다.
조기 도입 기업들은 머신러닝에 기반한 PCR 조건을 활용하여 열화된 DNA로부터의 법의학적 분석 결과를 개선함으로써, 변성되지 않은 시료에 국한되지 않는 용도 확대를 도모하고 있습니다. 프로브 설계와 관련된 특허 장벽이 기존 기업을 보호하고 있지만, 새로운 다가 결합 기술은 미래의 획기적인 발전을 예고하고 있습니다. AI 통합이 진행됨에 따라 구매 결정 요인은 단순한 화학 기술 그 자체가 아니라 처리량 향상 및 워크플로우 자동화로 이동하고 있습니다.
2025년에는 시약 및 키트가 매출의 32.78%를 차지했으며, 주요 공급업체 매출의 88%를 창출함으로써 지속적인 현금 흐름의 기반이 되는 소모품 주도형 비즈니스 모델을 부각시키고 있습니다. 소프트웨어 및 서비스는 클라우드 네이티브 분석 플랫폼이 멀티오믹스 통합 및 규제 준수에 대한 감사 추적을 실현함에 따라 연평균 성장률(CAGR) 3.74%로 가장 빠르게 성장하는 분야입니다.
장비 업그레이드는 5년 주기로 진행되고 있으며, 하드웨어 매출은 안정적이지만 성장세는 완만합니다. 한편, 자동화된 라이브러리 준비 스테이션은 오염 위험을 줄이고 결과를 표준화함으로써 소모품 판매를 견인하고 있습니다. 커넥티드 애널리틱스 분야의 ISO 27001 준수 등 컴플라이언스 기능은 기업 사용자에 대한 벤더 종속성을 강화하고 있습니다.
지역별 분석
북미가 38.74%의 점유율을 차지하는 배경에는 꾸준한 연구개발비, 상환 경로, 그리고 4년에 걸쳐 시판 전 심사를 단계적으로 도입하는 2024년 LDT 규정에 상징되는 규제 명확성이 있습니다. 일루미나와 서모피셔는 2024년 유전자 관련 매출을 합쳐 150억 달러 이상을 기록하며, 국내의 견고한 공급망을 더욱 강화하고 있습니다.
아시아태평양은 2031년까지 3.98%라는 가장 높은 연평균 성장률(CAGR)을 나타낼 전망입니다. 이는 중국의 90억 달러 규모 정밀의료 프로그램과 인도의 ‘유전체 인디아 프로젝트’가 대규모 코호트 연구의 기반을 마련하고 있기 때문입니다. 미국과 중국 간의 긴장이 고조되는 가운데, 비용 측면의 우위와 숙련된 인력 풀이 시퀀싱 업무의 아웃소싱을 유도하고 있어, 이 지역의 CRO(의약품 개발 수탁 기관)에 호재가 되고 있습니다.
유럽에서는 학술 컨소시엄 및 국민건강보험 서비스(NHS)의 시범 사업을 배경으로 꾸준한 성장이 나타나고 있으나, GDPR(EU 개인정보보호규정) 준수에 따른 부담이 성장세를 다소 둔화시키고 있습니다. 옥스퍼드 나노포어(Oxford Nanopore)의 부상과 142개에 달하는 유전체 관련 스타트업의 존재는 규제는 엄격하지만 활기찬 생태계를 잘 보여줍니다.
기타 혜택 :
- 엑셀 형식 시장 예측(ME) 시트
- 3개월간의 애널리스트 지원
자주 묻는 질문
목차
제1장 서론
제2장 조사 방법
제3장 주요 요약
제4장 시장 구도
제5장 시장 규모 및 성장 예측
제6장 경쟁 구도
제7장 시장 기회 및 향후 전망
AJY 26.08.26According to Mordor Intelligence, the SNP genotyping market size in 2026 is estimated at USD 8.57 billion, growing from 2025 value of USD 8.28 billion with 2031 projections showing USD 10.19 billion, growing at 3.52% CAGR over 2026-2031.
This report is Segmented by Technology (TaqMan SNP Genotyping, Massarray SNP Genotyping, and More), Application (Diagnostics, Pharmacogenomics & Precision Medicine, and More), End User (Pharmaceutical & Biotechnology Companies, Academic & Research Institutes, and More), and Geography (North America, Europe, and More). The Market Forecasts are Provided in Terms of Value (USD).
Global SNP Genotyping Market Trends and Insights
Falling NGS Costs & Throughput Explosion
Surface-coating and roll-to-roll fluidics now deliver whole-genome reads for USD 15, a drop of 98% from 2020 levels, broadening access for population studies and low-resource clinics. Illumina's NovaSeq X exemplifies the trend by pushing per-sample economics below array prices and forecasting high single-digit revenue growth through 2027. Higher lane density allows millions of SNPs to be screened in parallel, while miniaturized library prep cuts consumable spend and sample input requirements. Academic centers formerly constrained by capital budgets can now run large cohorts, accelerating discovery timelines. The cost curve therefore tilts adoption toward sequencing-based SNP genotyping and away from fixed arrays.
Pharmaceutical Pivot to Companion Diagnostics
More than 30 companion-diagnostic alliances now channel pharma investment into high-accuracy SNP panels that guide dosing and therapy selection. FDA backing for broad assays such as FoundationOne CDx, which covers 324 genes, validates multi-biomarker strategies reliant on SNP calls. Real-time platforms integrated into clinical workflows shorten eligibility decisions from days to hours, supporting same-visit prescriptions in oncology and chronic disease care. Successful precedents like Herceptin and Gleevec reinforce the commercial logic and encourage pipeline drugs to embed genotyping from Phase II onward. As pharmacogenomics shifts from research to routine, laboratory throughput, regulatory compliance, and turnaround time become decisive purchase criteria.
Shortage of Qualified Bioinformaticians
Eighty-two percent of genomics firms report difficulty hiring data scientists who can unify AI, statistics, and molecular biology skills. Rapid output from high-throughput platforms overwhelms existing analysis pipelines, forcing labs to outsource or delay projects. Limited academic seats in computational genomics prolong the gap, while salary inflation hits smaller firms hardest. Emerging markets feel the pinch most acutely, restricting local uptake even where instrument costs fall. Over the medium term, reskilling programs and cloud automation will ease but not eliminate the constraint.
Other drivers and restraints analyzed in the detailed report include:
- Agrigenomics Demand for Climate-Resilient Crops
- Growing DTC Wellness Genotyping Kits
- Regulatory Patchwork on Genetic Data Privacy
For complete list of drivers and restraints, kindly check the Table Of Contents.
Segment Analysis
TaqMan captured 36.85% of SNP genotyping market share in 2025 through established real-time PCR accuracy and validated probe chemistries suited for regulated diagnostics. AI-enabled microfluidic systems now challenge that dominance, posting 4.08% CAGR as they automate single-cell handling at 98% identification precision. MassARRAY sustains usage in high-sample academic screens, though its growth plateaus as sequencing costs compress.
Early adopters exploit machine-learning-guided PCR conditions to improve forensic results from degraded DNA, expanding utility beyond pristine samples. Patent barriers around probe designs insulate incumbents, yet novel multivalent binding chemistries hint at future breakthroughs. As AI integration deepens, purchasing decisions pivot on throughput gains and workflow automation rather than raw chemistry alone.
Reagents & kits represented 32.78% of revenue in 2025, underscoring a consumables-driven model that delivers 88% of top vendors' sales and anchors recurring cash flows. Software & services are the fastest-growing slice at 3.74% CAGR as cloud-native analytics platforms unlock multi-omics integration and regulatory-grade audit trails.
Instrument upgrades proceed on five-year cycles, keeping hardware sales steady but subdued. Meanwhile, automated library prep stations mitigate contamination risk and standardize results, adding pull-through for consumables. Compliance features such as ISO 27001 alignment within Connected Analytics strengthen vendor lock-in for enterprise users.
Complete Report Scope:
- By Technology (Value)
- TaqMan SNP Genotyping
- Massarray SNP Genotyping
- SNP GeneChip Arrays
- Other Technologies
- By Product Type (Value)
- Instruments & Workstations
- Reagents & Kits
- Software & Services
- By Application (Value)
- Diagnostics
- Pharmacogenomics & Precision Medicine
- Agriculture & Animal Genetics
- Forensics
- Drug Discovery & Development
- By End User (Value)
- Pharmaceutical & Biotechnology Companies
- Academic & Research Institutes
- Contract Research Organizations
- Clinical & Diagnostic Laboratories
- By Geography (Value)
- North America
- United States
- Canada
- Mexico
- Europe
- Germany
- United Kingdom
- France
- Italy
- Spain
- Rest of Europe
- Asia-Pacific
- China
- India
- Japan
- South Korea
- Australia
- Rest of Asia-Pacific
- South America
- Brazil
- Argentina
- Rest of South America
- Middle East and Africa
- GCC
- South Africa
- Rest of Middle East and Africa
- North America
Geography Analysis
North America's 38.74% share stems from entrenched R&D spending, reimbursement pathways, and regulatory clarity exemplified by the 2024 LDT rule that phases in premarket reviews over four years. Illumina and Thermo Fisher collectively reported more than USD 15 billion in 2024 genetics-related revenue, reinforcing a deep domestic supply chain.
Asia-Pacific posts the fastest 3.98% CAGR through 2031 as China's USD 9 billion precision-medicine program and India's Genome India Project seed vast cohort studies. Cost advantages and skilled talent pools attract outsourced sequencing workloads amid U.S.-China tensions, giving regional CROs a tailwind.
Europe grows steadily on the back of academic consortia and national health service pilots, though GDPR compliance overhead tempers momentum. Oxford Nanopore's emergence and a 142-company genomic startup base demonstrate a vibrant, if regulation-heavy, ecosystem.
- Illumina
- Thermo Fisher Scientific
- QIAGEN
- Roche
- Agilent Technologies
- Bio-Rad Laboratories
- LGC Biosearch Technologies (LGC Group)
- Standard BioTools Inc.
- Revvity
- Takara Bio
- Danaher Corp. (Integrated DNA Technologies)
- Eurofins
- BGI Genomics Co. Ltd.
- Oxford Nanopore Technologies plc
- Azenta
- Merck
- Agena Bioscience (Mesa Labs)
- Promega Corp.
- New England Biolabs
Additional Benefits:
- The market estimate (ME) sheet in Excel format
- 3 months of analyst support
TABLE OF CONTENTS
1 Introduction
- 1.1 Study Assumptions & Market Definition
- 1.2 Scope of the Study
2 Research Methodology
3 Executive Summary
4 Market Landscape
- 4.1 Market Overview
- 4.2 Market Drivers
- 4.2.1 Falling NGS Costs & Throughput Explosion
- 4.2.2 Pharmaceutical Pivot to Companion Diagnostics
- 4.2.3 Agrigenomics Demand for Climate-Resilient Crops
- 4.2.4 Growing DTC Wellness Genotyping Kits
- 4.2.5 AI-enabled Ultra-High-Throughput Microfluidics (under-reported)
- 4.2.6 Cloud-based Secure Genomic Data Marketplaces (under-reported)
- 4.3 Market Restraints
- 4.3.1 Shortage of Qualified Bioinformaticians
- 4.3.2 Regulatory Patchwork on Genetic Data Privacy
- 4.3.3 Patent Thickets around Probe Chemistries (under-reported)
- 4.3.4 Supply-chain Risk for Rare Earth Fluorophores (under-reported)
- 4.4 Value / Supply-Chain Analysis
- 4.5 Regulatory Landscape
- 4.6 Technological Outlook
- 4.7 Porter's Five Forces
- 4.7.1 Bargaining Power of Buyers
- 4.7.2 Bargaining Power of Suppliers
- 4.7.3 Threat of New Entrants
- 4.7.4 Threat of Substitutes
- 4.7.5 Competitive Rivalry
5 Market Size & Growth Forecasts
- 5.1 By Technology (Value)
- 5.1.1 TaqMan SNP Genotyping
- 5.1.2 Massarray SNP Genotyping
- 5.1.3 SNP GeneChip Arrays
- 5.1.4 Other Technologies
- 5.2 By Product Type (Value)
- 5.2.1 Instruments & Workstations
- 5.2.2 Reagents & Kits
- 5.2.3 Software & Services
- 5.3 By Application (Value)
- 5.3.1 Diagnostics
- 5.3.2 Pharmacogenomics & Precision Medicine
- 5.3.3 Agriculture & Animal Genetics
- 5.3.4 Forensics
- 5.3.5 Drug Discovery & Development
- 5.4 By End User (Value)
- 5.4.1 Pharmaceutical & Biotechnology Companies
- 5.4.2 Academic & Research Institutes
- 5.4.3 Contract Research Organizations
- 5.4.4 Clinical & Diagnostic Laboratories
- 5.5 By Geography (Value)
- 5.5.1 North America
- 5.5.1.1 United States
- 5.5.1.2 Canada
- 5.5.1.3 Mexico
- 5.5.2 Europe
- 5.5.2.1 Germany
- 5.5.2.2 United Kingdom
- 5.5.2.3 France
- 5.5.2.4 Italy
- 5.5.2.5 Spain
- 5.5.2.6 Rest of Europe
- 5.5.3 Asia-Pacific
- 5.5.3.1 China
- 5.5.3.2 India
- 5.5.3.3 Japan
- 5.5.3.4 South Korea
- 5.5.3.5 Australia
- 5.5.3.6 Rest of Asia-Pacific
- 5.5.4 South America
- 5.5.4.1 Brazil
- 5.5.4.2 Argentina
- 5.5.4.3 Rest of South America
- 5.5.5 Middle East and Africa
- 5.5.5.1 GCC
- 5.5.5.2 South Africa
- 5.5.5.3 Rest of Middle East and Africa
- 5.5.1 North America
6 Competitive Landscape
- 6.1 Market Concentration
- 6.2 Market Share Analysis
- 6.3 Company Profiles (includes Global level Overview, Market level overview, Core Segments, Financials as available, Strategic Information, Market Rank/Share for key companies, Products & Services, and Recent Developments)
- 6.3.1 Illumina Inc.
- 6.3.2 Thermo Fisher Scientific Inc.
- 6.3.3 QIAGEN N.V.
- 6.3.4 F. Hoffmann-La Roche Ltd
- 6.3.5 Agilent Technologies Inc.
- 6.3.6 Bio-Rad Laboratories Inc.
- 6.3.7 LGC Biosearch Technologies (LGC Group)
- 6.3.8 Standard BioTools Inc.
- 6.3.9 Revvity
- 6.3.10 Takara Bio Inc.
- 6.3.11 Danaher Corp. (Integrated DNA Technologies)
- 6.3.12 Eurofins Scientific SE
- 6.3.13 BGI Genomics Co. Ltd.
- 6.3.14 Oxford Nanopore Technologies plc
- 6.3.15 Azenta Life Sciences
- 6.3.16 Merck KGaA (Sigma-Aldrich)
- 6.3.17 Agena Bioscience (Mesa Labs)
- 6.3.18 Promega Corp.
- 6.3.19 New England Biolabs Inc.
7 Market Opportunities & Future Outlook
- 7.1 White-space & Unmet-Need Assessment


