|
시장보고서
상품코드
2114404
IT 운영 분석(ITOA) : 시장 점유율 분석, 업계 동향 및 통계, 성장 예측(2026-2031년)IT Operation Analytics (ITOA) - Market Share Analysis, Industry Trends & Statistics, Growth Forecasts (2026 - 2031) |
||||||
 Mordor Intelligence
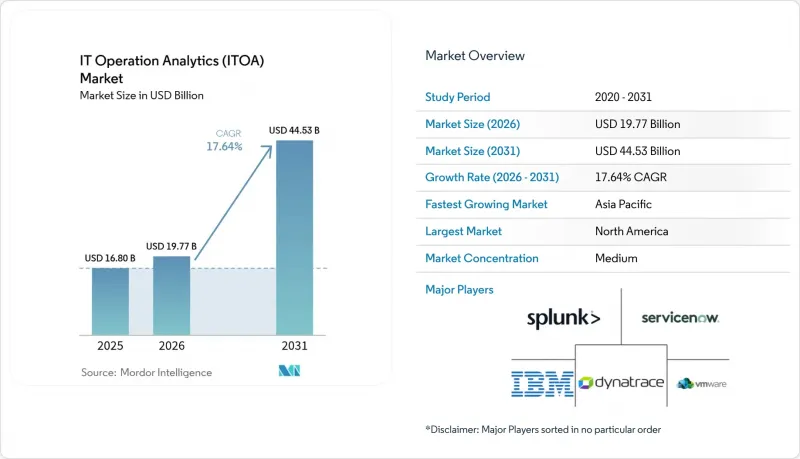
Mordor Intelligence에 의하면, IT 운영 분석 시장 규모는 2025년에 168억 달러, 2026년 197억 7,000만 달러에서 2031년까지 445억 3,000만 달러에 이를 것으로 예측되며, 예측 기간(2026-2031년) CAGR은 17.64%를 기록할 전망입니다.
본 보고서는 배포 방식(클라우드 기반, On-Premise), 용도(용도 모니터링, 비즈니스 및 IT 서비스 모니터링, 기타), 최종 사용자 산업(은행, 금융서비스 및 보험(BFSI), 헬스케어, 기타), 분석 유형(예측 분석, 근본 원인 분석, 기타), 지역별로 분류되어 있습니다. 시장 예측은 금액(달러) 단위로 표시됩니다.
세계 IT 운영 분석(ITOA) 시장 동향 및 인사이트
클라우드 네이티브 가시성의 도입이 실시간 ITOA 수요를 가속화
클라우드 퍼스트 아키텍처에서는 워크로드가 컨테이너, 서버리스 함수, 엣지 노드로 분산되므로 통합된 텔레메트리가 필수적입니다. 최신 가시성 플랫폼을 도입한 조직은 레거시 도구 사용자에 비해 평균 해결 시간(MTTR)을 45% 단축하고 있습니다. 통합된 파이프라인을 통해 로그, 메트릭, 트레이스가 단일 데이터 플레인에 집계되며, 여기서 머신러닝 모델이 이상을 감지하고 자동 복구를 실행합니다. DevOps 워크플로우와의 긴밀한 연동을 통해 엔지니어는 프로덕션 환경으로 전환하기 전에 성능 저하를 포착할 수 있습니다. 이러한 기능 덕분에 서비스 신뢰성이 향상되는 동시에 인시던트 노이즈가 감소하여 IT 운영 분석 시장의 성장이 촉진되고 있습니다.
사일로화된 ITOM 도구에서 통합형 AIOps 제품군으로의 급속한 전환
기존에 기업들은 15-20개에 달하는 독립적인 모니터링 제품을 병용하고 있었으며, 이로 인해 경보 피로와 모니터링 사각지대가 발생했습니다. 통합된 AIOps 제품군은 이러한 사일로를 해소하고, AI를 활용한 이벤트 상관 분석을 수행함으로써 수동 운영 작업을 90% 줄이고, 인시던트 해결 시간을 21% 단축합니다. 또한, 일원화된 인사이트를 통해 벤더 관련 오버헤드와 라이선싱의 복잡성도 경감됩니다. 하이브리드 아키텍처로 인해 데이터 소스가 증가함에 따라, 인프라, 용도, 비즈니스 지표를 융합한 원스톱 제품군이 필수적이 되었으며, 이는 단일 기능 벤더의 입지를 좁히고 IT 운영 분석 시장을 독점하는 플랫폼 전략을 강화하고 있습니다.
초기 데이터 엔지니어링 및 라이선싱 비용의 부담
데이터 레이크, 스트림 프로세서, AI 도구를 포함하면 본격적인 분석 파이프라인 구축 비용은 1,000만 달러를 초과하기도 합니다. 노드 단위나 GB 단위로 청구되는 요금 체계는 인프라 확장에 따라 직선적으로 증가하므로, 예산의 예측 가능성을 제한하게 됩니다. 중소규모 기업의 경우 총 소유 비용(TCO)이 연간 IT 지출의 15-20%를 차지하기 때문에 IT 운영 분석 시장 진입이 지연되고 있습니다. 클라우드 SaaS(Software-as-a-Service) 모델은 자본 지출(Capex) 부담을 경감시켜 주지만, 장기적인 구독 총액은 여전히 On-Premise 환경의 비용에 필적할 가능성이 있습니다.
부문 분석
클라우드 제공은 2025년에 IT 운영 분석 시장의 70.72% 점유율을 확보하고, 2031년까지 연평균 성장률(CAGR) 21.95%로 확대될 것으로 예측되며, 이는 하드웨어 유지보수가 필요 없는 매니지드 서비스에 대한 구매자의 선호도를 여실히 보여주고 있습니다. 이 모델은 도입 리드타임을 최대 60% 단축하고, 변동이 심한 텔레메트리 부하에 맞추어 용량을 조정할 수 있기 때문에 예측 기간 동안 IT 운영 분석 시장 규모를 151억 달러 직접 확대하게 될 것입니다. 대조적으로, 데이터를 관할 구역 내에 보관해야 하는 규제가 엄격한 산업 분야에서는 여전히 On-Premise형 옵션이 사용되고 있습니다.
금융 기관 및 공공 기관은 주권 관련 요건을 충족하기 위해 로컬 스택을 유지하고 있지만, 이러한 사용자들조차 기밀성이 낮은 워크로드를 SaaS형 AIOps 플랫폼으로 이전하는 하이브리드형 솔루션을 점점 더 많이 채택하고 있습니다. 각 하이퍼스케일러 기업들은 인프라-어-코드(IaC) 템플릿에 가시성 기능을 직접 통합함으로써 경쟁 우위를 강화하고, 구매자의 지출을 더욱 집중시키고 있습니다. 엣지 측에서는 경량 컬렉션이 개요 데이터를 클라우드 코어로 전송함으로써 저지연을 유지하면서 중앙 집중화된 분석 거버넌스를 확보하고 있습니다.
2025년에는 사이버 공격이 시그니처 기반 도구가 작동하기 전에 운영상의 취약점을 악용함에 따라, 보안 및 네트워크 모니터링이 IT 운영 분석 시장의 28.60%를 차지했습니다. 패킷 흐름과 용도 추적을 상호 연관시키는 통합형 SecOps 대시보드는 사일로화된 모델보다 50% 더 빠르게 이상을 감지하여, 위험 완화에 수반되는 IT 운영 분석 시장 규모 확대를 뒷받침하고 있습니다.
AI 기반 클러스터링을 통해 중복 경보가 감소하고 발생 원인의 장애를 파악할 수 있기 때문에 AIOps를 중심으로 한 근본 원인 분석은 연평균 성장률(CAGR) 23.86%를 기록하며 가장 빠르게 성장하고 있습니다. 인프라 모니터링은 예측적 용량 계획으로 발전하고 있는 반면, 비즈니스 서비스 모니터링은 SLO 위반과 수익에 미치는 영향을 연관시킵니다. 이 기능은 플래시 세일이 절정에 달하는 시기에 디지털 소매업체들로부터 높은 평가를 받고 있습니다. 통신 사업자들은 5G 네트워크의 데이터 분석 기능을 활용하여 총 소유 비용(TCO)을 45% 절감하고 있으며, 이는 IT 운영 분석 시장 전반에 걸친 이용 사례의 폭이 넓음을 여실히 보여주고 있습니다.
지역별 분석
북미는 성숙한 DevOps 문화, 자금력이 풍부한 벤처 생태계, 클라우드 전환을 지원하는 연방 정부 프로그램의 뒷받침을 받아 2025년에는 매출의 37.00%를 차지하며 IT 운영 분석 시장을 주도했습니다. Splunk, IBM, ServiceNow 등 주요 벤더들은 기업 내 도입 기반이 탄탄하기 때문에 이 지역의 성장은 신규 도입에서 부가가치가 높은 AI 확장 기능 및 크로스 도메인 통합으로 무게중심을 옮기고 있습니다. 제로 트러스트 아키텍처 도입을 위한 규제 당국의 추진으로 분석 예산은 더욱 확대되고 있으나, 1차 프로젝트가 최적화 단계에 도달함에 따라 전반적인 성장 속도는 완만해지고 있습니다.
아시아태평양은 가장 빠르게 성장하는 지역으로, 2031년 연평균 성장률(CAGR)은 19.1%로 예측됩니다. 각국 정부는 AI 도입을 산업 경쟁력 강화의 수단으로 간주하고 있으며, 이에 따라 제조업체들은 예측 유지보수 도입을 통해 현장의 OT 스트림과 IT 텔레메트리를 통합하도록 장려받고 있습니다. 기업의 43%가 AI 투자 의향으로 예산의 20% 이상을 증액할 것으로 예상하고 있으며, 이는 분석 수요의 방대한 파이프라인을 뒷받침하고 있습니다. 엣지 네이티브 아키텍처, 풍부한 엔지니어링 인력, 활기찬 스타트업 생태계가 고급 SRE 부문의 기술 인력 부족을 보완하고 있으며, 이를 통해 해당 지역을 IT 운영 분석 시장의 주요 원동력으로 확고히 자리매김하고 있습니다.
유럽에서는 혁신과 엄격한 데이터 주권 관련 규제의 균형이 잡혀 있어, 플랫폼에는 처리의 현지화가 요구되는 한편, 국경을 초월한 연합 분석도 가능해졌습니다. ‘디지털 운영 복원력 법(Digital Operational Resilience Act)’ 등의 법규로 인해 조달 기준은 감사 가능성과 거버넌스를 중시하는 방향으로 전환되고 있으며, 벤더들은 이러한 정책에 대응하는 데이터 라우팅 기능을 추가하도록 촉구받고 있습니다. 지속가능성 관련 지침에 따라, 기업이 분석을 활용하여 데이터센터 내 에너지 소비량 및 탄소 발자국을 추적하는 새로운 이용 사례가 등장하고 있습니다. 거시경제 성장은 둔화되고 있으나, 규정 준수를 주도하는 지출로 인해 유럽 전역에서 IT 운영 분석 시장은 활기를 띠고 있습니다.
기타 혜택
- 엑셀 형식 시장 예측(ME) 시트
- 3개월간의 애널리스트 지원
자주 묻는 질문
목차
제1장 서론
제2장 조사 방법
제3장 주요 요약
제4장 시장 구도
제5장 시장 규모와 성장 예측
제6장 경쟁 구도
제7장 시장 기회와 향후 전망
LSHAccording to Mordor Intelligence, the IT operations analytics market size was valued at USD 16.8 billion in 2025 and estimated to grow from USD 19.77 billion in 2026 to reach USD 44.53 billion by 2031, at a CAGR of 17.64% during the forecast period (2026-2031).
This report is Segmented by Deployment (Cloud and On-Premise), Application (Application Monitoring, Business and IT Services Monitoring, and More), End-User Industry (BFSI, Healthcare, and More), Analytics Type (Predictive Analytics, Root-Cause Analytics, and More), and Geography. The Market Forecasts are Provided in Terms of Value (USD).
Global IT Operation Analytics (ITOA) Market Trends and Insights
Cloud-Native Observability Adoption Accelerates Real-Time ITOA Demand
Cloud-first architectures fragment workloads across containers, serverless functions and edge nodes, making unified telemetry indispensable. Organizations that implement modern observability platforms record 45% faster mean-time-to-resolution than users of legacy tools. Integrated pipelines stream logs, metrics and traces into a single data plane, where machine-learning models flag anomalies and launch auto-remediation. Tight coupling with DevOps workflows lets engineers catch performance regressions before production cut-overs. Together these capabilities lift service reliability while shrinking incident noise, propelling the IT operations analytics market forward.
Rapid Shift from Siloed ITOM Tools to Unified AIOps Suites
Enterprises historically juggled 15-20 standalone monitoring products, breeding alert fatigue and blind spots. Consolidated AIOps suites collapse those silos and apply AI for event correlation, cutting manual operational effort by 90% and shrinking incident resolution time 21%.Centralized insight also trims vendor overhead and licensing complexity. As hybrid architectures multiply data sources, one-stop suites that fuse infrastructure, application and business metrics become essential, squeezing single-function vendors and reinforcing platform plays that dominate the IT operations analytics market.
High Initial Data-Engineering & Licensing Costs
Standing up full-scale analytics pipelines can top USD 10 million once data lakes, stream processors and AI tooling are counted. Fee structures that charge per node or per GB scale linearly with infrastructure growth, constraining budget predictability. Smaller enterprises see total cost of ownership absorb 15-20% of annual IT spend, delaying entry into the IT operations analytics market. Cloud SaaS models soften capex, but long-term subscription totals can still rival on-premise expense.
Other drivers and restraints analyzed in the detailed report include:
- Need for Predictive Outage Prevention in Hybrid-Cloud Estates
- FinOps Mandates Push Cost-Aware Analytics Adoption
- Shortage of Site-Reliability / DevSecOps Skillsets
For complete list of drivers and restraints, kindly check the Table Of Contents.
Segment Analysis
Cloud deliveries secured 70.72% of the IT operations analytics market share in 2025 and are forecast to rise at 21.95% CAGR through 2031, underscoring buyer preference for managed services that eliminate hardware upkeep. This model slashes deployment lead-times by up to 60% and aligns capacity with volatile telemetry loads, directly enlarging the IT operations analytics market size by USD 15.1 billion over the forecast window. In contrast, on-premise options persist in heavily regulated verticals that must anchor data within jurisdictional borders.
Financial institutions and public agencies retain local stacks for sovereignty mandates, yet even these users increasingly adopt hybrid blends that shuttle non-sensitive workloads to SaaS AIOps platforms. Hyperscalers strengthen their advantage by embedding observability hooks directly into infrastructure-as-code templates, further consolidating buyer spend. At the edge, lightweight collectors push summaries to cloud cores, preserving low latency while retaining centralized analytics governance.
Security and network monitoring constituted 28.60% of the IT operations analytics market in 2025 as cyberattacks exploit operational weak points before signature-based tools trigger. Converged SecOps dashboards that correlate packet flows with application traces detect anomalies 50% faster than siloed models, reinforcing the IT operations analytics market size premium attached to risk mitigation.
AIOps-centric root-cause analytics is the fastest riser, clocking 23.86% CAGR, as AI-driven clustering collapses duplicate alerts and pinpoints origin faults. Infrastructure monitoring matures toward predictive capacity planning, while business service monitoring links SLO breaches to revenue impact, a feature prized by digital retailers during flash-sale peaks. Telecom operators harness 5G network data-analytics functions to lower total cost of ownership 45%, illuminating the breadth of use cases spanning the IT operations analytics market.
Complete Report Scope:
- By Deployment
- Cloud-based
- On-premise
- By Application
- Application Monitoring
- Business and IT-Service Monitoring
- Infrastructure Monitoring
- Network and Security Monitoring
- By End-user Industry
- BFSI
- Healthcare
- Telecommunication
- Retail and E-commerce
- Industrial / Manufacturing
- Government and Public Sector
- By Analytics Type
- Predictive Analytics
- Root-Cause Analytics
- Visual / Dashboard Analytics
- Behavior Analytics
- By Geography (Cross-segmentation)
- North America
- United States
- Canada
- Mexico
- Europe
- United Kingdom
- Germany
- France
- Italy
- Rest of Europe
- Asia-Pacific
- China
- Japan
- India
- South Korea
- Rest of Asia
- Middle East
- Israel
- Saudi Arabia
- United Arab Emirates
- Turkey
- Rest of Middle East
- Africa
- South Africa
- Egypt
- Rest of Africa
- South America
- Brazil
- Argentina
- Rest of South America
- North America
Geography Analysis
North America led the IT operations analytics market with 37.00% revenue in 2025, buoyed by mature DevOps cultures, well-funded venture ecosystems and federal programs that subsidize cloud migration. Flagship vendors such as Splunk, IBM and ServiceNow enjoy dense enterprise install bases, so regional growth pivots from greenfield deployments toward value-added AI extensions and cross-domain integrations. Regulatory pushes for zero-trust architectures further elevate analytics budgets, though overall expansion moderates as first-wave projects reach optimization stage.
Asia-Pacific is the fastest-growing geography, projected at 19.1% CAGR to 2031. Governments position AI adoption as a lever for industrial competitiveness, prompting manufacturers to integrate shop-floor OT streams with IT telemetry for predictive maintenance rollouts. AI investment intentions exceed 20% budget growth among 43% of enterprises, feeding a sizeable pipeline of analytics demand. Edge-native architectures, abundant engineering talent and vibrant start-up ecosystems offset skills shortages in advanced SRE disciplines, cementing the region as a primary engine of the IT operations analytics market.
Europe balances innovation with strict data-sovereignty rules, requiring platforms to localize processing while enabling federated analysis across borders. Legislation such as the Digital Operational Resilience Act shapes procurement criteria toward auditability and governance, prompting vendors to add policy-aware data-routing features. Sustainability directives create incremental use cases as enterprises leverage analytics to track energy consumption and carbon footprints within data centers. Despite slower macro-economic growth, compliance-driven spending keeps the IT operations analytics market vibrant across the continent.
List of Companies Covered in this Report:
- Splunk Inc.
- IBM Corporation
- ServiceNow Inc.
- VMware Inc. (Broadcom)
- Dynatrace Inc.
- Oracle Corporation
- BMC Software Inc.
- Micro Focus Intl. plc
- Cisco Systems Inc.
- AppDynamics LLC
- Elastic N.V.
- SAS Institute Inc.
- New Relic Inc.
- PagerDuty Inc.
- Datadog Inc.
- SolarWinds Corp.
- ManageEngine (Zoho)
- OpsRamp Inc.
- Evolven Software
- XpoLog Ltd.
Additional Benefits:
- The market estimate (ME) sheet in Excel format
- 3 months of analyst support
TABLE OF CONTENTS
1 INTRODUCTION
- 1.1 Study Assumptions and Market Definition
- 1.2 Scope of the Study
2 RESEARCH METHODOLOGY
3 EXECUTIVE SUMMARY
4 MARKET LANDSCAPE
- 4.1 Market Overview
- 4.2 Market Drivers
- 4.2.1 Cloud-native observability adoption accelerates real-time ITOA demand
- 4.2.2 Rapid shift from siloed ITOM tools to unified AIOps suites
- 4.2.3 Need for predictive outage prevention in hybrid-cloud estates
- 4.2.4 FinOps mandates push cost-aware analytics adoption
- 4.2.5 Sovereign-cloud regulations spur regional ITOA variants
- 4.3 Market Restraints
- 4.3.1 High initial data-engineering and licensing costs
- 4.3.2 Shortage of site-reliability / DevSecOps skillsets
- 4.3.3 Data-residency limits on log export hamper AI training
- 4.4 Regulatory Landscape
- 4.5 Technological Outlook
- 4.6 Porter's Five Forces Analysis
- 4.6.1 Threat of New Entrants
- 4.6.2 Bargaining Power of Buyers
- 4.6.3 Bargaining Power of Suppliers
- 4.6.4 Threat of Substitutes
- 4.6.5 Intensity of Competitive Rivalry
5 MARKET SIZE AND GROWTH FORECASTS
- 5.1 By Deployment
- 5.1.1 Cloud-based
- 5.1.2 On-premise
- 5.2 By Application
- 5.2.1 Application Monitoring
- 5.2.2 Business and IT-Service Monitoring
- 5.2.3 Infrastructure Monitoring
- 5.2.4 Network and Security Monitoring
- 5.3 By End-user Industry
- 5.3.1 BFSI
- 5.3.2 Healthcare
- 5.3.3 Telecommunication
- 5.3.4 Retail and E-commerce
- 5.3.5 Industrial / Manufacturing
- 5.3.6 Government and Public Sector
- 5.4 By Analytics Type
- 5.4.1 Predictive Analytics
- 5.4.2 Root-Cause Analytics
- 5.4.3 Visual / Dashboard Analytics
- 5.4.4 Behavior Analytics
- 5.5 By Geography (Cross-segmentation)
- 5.5.1 North America
- 5.5.1.1 United States
- 5.5.1.2 Canada
- 5.5.1.3 Mexico
- 5.5.2 Europe
- 5.5.2.1 United Kingdom
- 5.5.2.2 Germany
- 5.5.2.3 France
- 5.5.2.4 Italy
- 5.5.2.5 Rest of Europe
- 5.5.3 Asia-Pacific
- 5.5.3.1 China
- 5.5.3.2 Japan
- 5.5.3.3 India
- 5.5.3.4 South Korea
- 5.5.3.5 Rest of Asia
- 5.5.4 Middle East
- 5.5.4.1 Israel
- 5.5.4.2 Saudi Arabia
- 5.5.4.3 United Arab Emirates
- 5.5.4.4 Turkey
- 5.5.4.5 Rest of Middle East
- 5.5.5 Africa
- 5.5.5.1 South Africa
- 5.5.5.2 Egypt
- 5.5.5.3 Rest of Africa
- 5.5.6 South America
- 5.5.6.1 Brazil
- 5.5.6.2 Argentina
- 5.5.6.3 Rest of South America
- 5.5.1 North America
6 COMPETITIVE LANDSCAPE
- 6.1 Market Concentration
- 6.2 Strategic Moves
- 6.3 Market Share Analysis
- 6.4 Company Profiles (includes Global level Overview, Market level overview, Core Segments, Financials as available, Strategic Information, Market Rank/Share for key companies, Products and Services, and Recent Developments)
- 6.4.1 Splunk Inc.
- 6.4.2 IBM Corporation
- 6.4.3 ServiceNow Inc.
- 6.4.4 VMware Inc. (Broadcom)
- 6.4.5 Dynatrace Inc.
- 6.4.6 Oracle Corporation
- 6.4.7 BMC Software Inc.
- 6.4.8 Micro Focus Intl. plc
- 6.4.9 Cisco Systems Inc.
- 6.4.10 AppDynamics LLC
- 6.4.11 Elastic N.V.
- 6.4.12 SAS Institute Inc.
- 6.4.13 New Relic Inc.
- 6.4.14 PagerDuty Inc.
- 6.4.15 Datadog Inc.
- 6.4.16 SolarWinds Corp.
- 6.4.17 ManageEngine (Zoho)
- 6.4.18 OpsRamp Inc.
- 6.4.19 Evolven Software
- 6.4.20 XpoLog Ltd.
7 MARKET OPPORTUNITIES AND FUTURE OUTLOOK
- 7.1 White-space and Unmet-need Assessment