|
시장보고서
상품코드
2114429
스쿨버스 시장 : 시장 점유율 분석, 업계 동향 및 통계, 성장 예측(2026-2031년)School Bus - Market Share Analysis, Industry Trends & Statistics, Growth Forecasts (2026 - 2031) |
||||||
 Mordor Intelligence
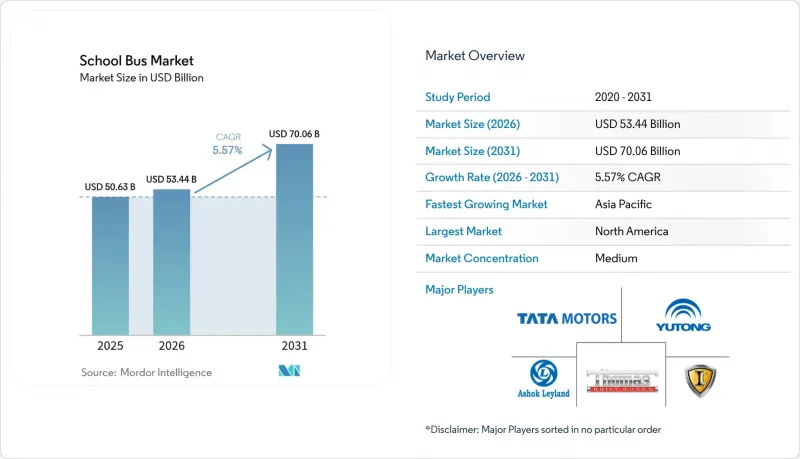
Mordor Intelligence에 의하면, 스쿨버스 시장 규모는 2025년에 506억 3,000만 달러로 평가되었고, 2026년 534억 4,000만 달러에서 2031년까지 700억 6,000만 달러에 이를 것으로 예측되며, 예측 기간(2026-2031년) CAGR은 5.57%를 나타낼 전망입니다.
본 보고서는 파워트레인별(내연기관 등), 좌석 수별(30석 이하 및 그 이상), 버스 유형별(유형 A, 유형 B 등), 최종 사용자별(공립 학군 등) 및 지역별로 분류되어 있습니다. 시장 전망은 금액(달러) 및 수량(대수)으로 제시되어 있습니다.
세계의 스쿨버스 시장 동향 및 인사이트
정부의 배기가스 규제가 차량의 전동화를 가속화
캘리포니아주의 ‘첨단 청정 차량 규정(Advanced Clean Fleets Rule)’은 2035년까지 신규 구매 차량을 모두 제로 배출 차량으로할 것을 의무화하고 있으며, 이 기준은 미국의 여러 주에서도 채택되어 현재 유럽 지자체의 입찰에도 영향을 미치고 있습니다. 규정 준수 체계에는 거래 가능한 탄소 크레딧이 포함되어 있어, 이를 통해 학군은 배출량 감축분을 통해 수익을 창출하고, 그 수익을 차량의 추가적인 현대화를 위한 노력에 재투자할 수 있게 됩니다. 유로 VII 미세먼지 배출 기준은 2025년에 시행되어, 기존의 디젤 파워트레인을 사실상 단계적으로 폐지하게 됩니다. 이에 따라 유럽의 사업자들은 무공해 대체 수단을 모색할 수밖에 없게 됩니다. 기준을 충족하지 못할 경우 운행 노선이 제한되고 서비스 유연성이 떨어지기 때문에 전기화는 환경 보호 차원이라기보다는 운영상의 필수 요건이 되었습니다.
무공해 스쿨버스를 위한 연방 및 주 차원의 전용 기금
미국의 ‘인프라 투자 및 고용법’에서는 친환경 스쿨버스 구입 보조금에만 막대한 자금이 배정되어 있으며, 이는 해당 분야 역사상 가장 중요한 단일 경제 부양책이 되었습니다. 자금 배분은 경제적으로 취약한 지역을 우선시하고 있으며, 예산 부족으로 인해 오랫동안 현대화가 지체되어 온 지역에서 기술 보급을 가속화하고 있습니다. 캘리포니아주의 HVIP와 같은 주 정부 보조금이 여기에 더해짐에 따라, 차량당 총 보조금 규모는 상당한 수준에 이르고, 디젤 차량에 비해 발생하는 추가 자본 비용을 사실상 모두 해소하고 있습니다. 이러한 인센티브의 상당수에 포함된 국내 조달 규정에 따라 구매 결정은 지역 조립 라인으로 기울어지며, 이는 세계 조달 전략을 형성하고 있습니다.
전기 버스 및 연료전지 버스의 높은 초기 비용
전기 버스는 차량 총 비용의 상당 부분을 차지하는 배터리 팩의 높은 비용으로 인해 디젤 버스보다 훨씬 비쌉니다. 특히 리튬이나 니켈과 같은 원자재 가격 변동은 예산상의 불확실성을 야기하여 조달 결정을 더욱 복잡하게 만듭니다. 연료전지 플랫폼은 비용이 훨씬 더 높습니다. 그 주된 요인은 차량용 수소 저장 장치, 고압 배관, 그리고 제조 비용이 여전히 높은 연료전지 스택과 관련된 비용에 있습니다. 자금 조달 문제는 기존 채권이나 그린 파이낸스 수단에 대한 접근이 제한된 지방 및 저소득 지역에서 특히 두드러집니다. 그 결과, 보조금을 널리 이용할 수 있는 지역이라 하더라도 도입률은 지역에 따라 편차를 보이고 있습니다.
부문 분석
2025년, 스쿨버스 시장에서 내연기관의 점유율은 82.74%를 차지했습니다. 이는 기존 정비 인프라와 디젤 차량 조달에 대한 익숙함으로 인해 자금 조달에 어려움을 겪는 학군에서 디젤 엔진 수요가 견조하게 유지되었기 때문입니다. 배터리식 전기 버스는 가장 빠르게 성장하는 하위 카테고리로, 2031년까지 연평균 성장률(CAGR)이 5.61%를 나타낼 것으로 예측됩니다. 이는 사업자들이 연방 정부의 보조금과 배터리 가격 하락을 활용하여 전환의 경제적 타당성을 입증하고 있기 때문입니다. 연료전지 버스는 여전히 틈새 시장에 머물러 있으며, 정책상 의무화가 시행되고 수소 공급망이 구축된 지역에 집중되어 있습니다. 회생 제동과 가동 부품의 감소로 인해 전기 버스의 유지보수 비용이 60-70% 절감되어, 결과적으로 전체 수명 주기 동안의 총비용이 감소합니다.
현재의 배터리 밀도로 인해 1회 충전으로 150-200마일의 주행 거리가 가능해졌으며, 이는 주중 추가 충전 없이 대부분의 일상 노선을 커버하기에 충분합니다. 연료전지 시스템은 신속한 연료 보급이 가능하지만, 충전소 네트워크가 드문 탓에 그 도입은 실증용 차량으로 한정되어 있습니다. 전반적으로 파워트레인의 전환에 따라 공급업체와의 계약 구조가 재검토되고 있으며, 스쿨버스 시장에서 배터리 팩 조달이 말하자면 ‘결정적인 병목 현상’이 되고 있습니다.
2025년에는 31-60석 규모의 버스가 스쿨버스 시장 점유율의 47.29%를 차지했습니다. 이는 차량 수를 과도하게 늘리지 않으면서도 평균적인 운행 수요를 충족시키는 최적의 균형입니다. 30석 이하 차량은 2031년까지 연평균 성장률(CAGR) 5.63%를 나타낼 것으로 예측되며, 학년, 특별한 지원이 필요한 아동·학생, 방과 후 활동 등에 따라 운행 노선을 세분화하는 경우가 늘고 있는 학군에 이점이 됩니다.
60석 이상 모델은 인구 밀도가 높은 노선을 담당하고 있지만, 회전 반경이나 연석 길이 같은 인프라상의 제약에 직면하여 성장이 둔화되고 있습니다. 소형 차량으로의 전환은 가구 규모 축소 및 학교 선택의 다양화와 같은 인구 동향과 부합하며, 이러한 요인들은 모두 운행 노선의 다양화를 촉진하고 있습니다. 또한 각 학구에서는 교외 학습이나 스포츠 활동을 위한 등하교 수송에 소형 버스를 재배치함으로써 자산 활용을 극대화하고 있습니다. 이러한 차량 크기 재편 추세는 향후 생산 라인이 단일 대량 생산 모델에서 다품종 생산으로 전환될 가능성을 시사하며, 이는 스쿨버스 시장의 생산 능력 계획 산정 방식을 재구축하게 될 것입니다.
지역별 분석
북미는 2025년에 스쿨버스 시장 점유율의 38.22%를 차지했으며, 이는 자금 조달, 제조, 전력망과의 통합에 있어 누적된 우위를 반영합니다. 주 정부와 유틸리티자의 파트너십을 통해 주차 중인 차량 군을 분산형 에너지 자원으로 전환하는 V2G(차량에서 전력망으로의 전력 공급) 시범 사업이 지원되고 있으며, 이를 통해 높은 취득 비용이 상쇄되고 있습니다. 캐나다는 그린 인프라 기금과 배출 감축 목표를 통해 추가적인 추진력을 창출하고 있는 반면, USMCA(미국·멕시코·캐나다 협정)에서 멕시코가 맡은 역할은 공급망을 효율화하고 있지만, 도입은 대도시권 회랑에 집중된 상태입니다.
아시아태평양은 이 분야에서 가장 높은 성장세를 보이고 있으며, 2031년까지 연평균 성장률(CAGR) 5.64%를 유지할 것으로 전망됩니다. 이는 중국이 의무화된 전기화 목표와 국내 배터리 생산 능력을 결합하여 비용 곡선을 낮추고 있기 때문입니다. 인도의 ‘국가 전기 버스 프로그램’은 대상 시장을 확대하고 있으며, 2급 도시에서는 최초로 전용 설계된 스쿨버스가 도입되고 있습니다. 일본과 한국에서는 첨단 ADAS(첨단 운전자 보조 시스템)가 도입되어 지역의 안전 기준이 높아지고 있으며, 그 영향은 국제 기준에도 파급되고 있습니다.
유럽에서는 유로 VII 기준에 따라 고황 디젤 연료가 단계적으로 폐지되고, 각국의 경제 부양책에 따른 보조금이 대체 구동 시스템에 투입됨에 따라 안정적인 성장을 유지하고 있습니다. 독일은 기존 연료전지 기술을 활용하여 수소 연료 활용 방안을 모색하고 있는 반면, 영국은 소형 버스를 도입함으로써 지방 교통망의 연결성을 중시하고 있습니다. 남유럽 국가들은 재정적 여력 제약으로 인해 보다 신중한 진전을 보이고 있지만, 지자체가 도입한 정체 과금 제도가 간접적으로 디젤 차량의 교체를 가속화하고 있습니다.
기타 혜택 :
- 엑셀 형식 시장 예측(ME) 시트
- 3개월간의 애널리스트 지원
자주 묻는 질문
목차
제1장 서론
제2장 조사 방법
제3장 주요 요약
제4장 시장 구도
제5장 시장 규모 및 성장 예측
제6장 경쟁 구도
제7장 시장 기회 및 향후 전망
AJY 26.08.26According to Mordor Intelligence, the school bus market size was valued at USD 50.63 billion in 2025 and estimated to grow from USD 53.44 billion in 2026 to reach USD 70.06 billion by 2031, at a CAGR of 5.57% during the forecast period (2026-2031).
This report is Segmented by Powertrain (Internal-Combustion Engine and More), Seating Capacity (Less Than or Equal To 30 Seats and More), Bus Type (Type A, Type B, and More), End User (Public School Districts and More), and Geography. The Market Forecasts are Provided in Terms of Value (USD) and Volume (Units).
Global School Bus Market Trends and Insights
Government Emissions Standards Accelerating Fleet Electrification
California's Advanced Clean Fleets Rule requires all new purchases to be zero-emission by 2035, a standard mirrored by several U.S. states and now influencing European municipal tenders. Compliance frameworks include tradable carbon credits, enabling districts to monetize avoided emissions and reinvest those proceeds in further fleet modernization efforts. Euro VII particulate limits come into effect in 2025 and will effectively phase out legacy diesel powertrains, compelling European operators to identify zero-emission alternatives. Failure to comply results in route restrictions that reduce service flexibility, making electrification an operational imperative rather than an environmental preference .
Dedicated Federal & State Funding Pools for Zero-Emission School Buses
The United States Infrastructure Investment and Jobs Act allocated a massive amount exclusively to clean school bus acquisition grants, the most significant single stimulus in the sector's history. Disbursements prioritize disadvantaged communities, accelerating the diffusion of technology where budget gaps have historically hindered modernization. Complementary state vouchers, such as California's HVIP, add up to a substantial amount per bus, effectively eliminating virtually all incremental capital premiums relative to diesel. Domestic-content rules embedded in many of those incentives tilt purchasing decisions toward local assembly lines, shaping global sourcing strategies .
High Upfront Cost of Electric & Fuel-Cell Variants
Electric buses are significantly more expensive than their diesel counterparts due to the high cost of battery packs, which make up a substantial portion of the vehicle's overall cost. The volatility in raw material prices, particularly for lithium and nickel, creates budget uncertainties, further complicating procurement decisions. Fuel-cell platforms are even more costly, primarily because of the expenses associated with onboard hydrogen storage, high-pressure lines, and fuel-cell stacks, which remain expensive to produce. Financing challenges are most pronounced in rural and low-income districts, where access to traditional bonds or green financing tools is limited. This results in uneven adoption rates, even in regions where subsidies are widely available.
Other drivers and restraints analyzed in the detailed report include:
- Rising Adoption of Advanced Safety Technologies
- Vehicle-to-Grid Revenue Potential for School Districts
- Limited Charging or Hydrogen Refueling Infrastructure
For complete list of drivers and restraints, kindly check the Table Of Contents.
Segment Analysis
Internal combustion engines held 82.74% of the school bus market share in 2025, as existing maintenance infrastructure and familiarity with diesel procurement kept diesel engines steady among cash-strapped districts. Battery-electric buses are the fastest-growing subcategory, tracking a 5.61% CAGR through 2031, as operators leverage federal grants and declining battery prices to justify the transition's economics. Fuel-cell variants remain a niche market, concentrated in regions with policy mandates and accessible hydrogen supply lines. Regenerative braking and fewer moving parts enable 60-70% lower maintenance costs for electric buses, thereby reducing total lifecycle expenses.
Current battery densities enable single-charge ranges of 150-200 miles, which are sufficient to cover most daily routes without requiring midday charging. Fuel-cell systems offer quick refueling but rely on a sparse station network, which limits their adoption to demonstration fleets. Overall, the powertrain shift is re-architecting supplier contracts as battery pack sourcing becomes the critical bottleneck in the school bus market.
Buses with 31-60 seats accounted for 47.29% of the school bus market share in 2025, an optimal compromise that meets average route demand without oversizing fleets. Vehicles with <=30 seats are projected to chart a 5.63% CAGR through 2031, benefiting districts that increasingly segment routes by grade level, special needs, or after-school activities.
Models exceeding 60 seats fill high-density corridors but face infrastructure constraints, such as turning radius and curb length, that slow their growth. Smaller capacity aligns with demographic trends, including reduced household sizes and higher school-choice variability, both of which increase route diversity. Districts also redeploy smaller buses for field trips or athletic transport, maximizing asset utilization. This resizing trend suggests that future manufacturing lines may shift towards multiplicity rather than single, high-volume models, reshaping the capacity planning calculus in the school bus market.
Complete Report Scope:
- By Powertrain
- Internal-Combustion Engine (ICE)
- Battery-Electric
- Fuel-Cell Electric
- By Seating Capacity
- Less than or equal to 30 Seats
- 31-60 Seats
- More than 60 Seats
- By Bus Type
- Type A
- Type B
- Type C
- Type D
- By End User
- Public School Districts
- Private & Charter Operators
- Contractors & Leasing Companies
- By Geography
- North America
- United States
- Canada
- Rest of North America
- South America
- Brazil
- Argentina
- Rest of South America
- Europe
- Germany
- United Kingdom
- France
- Italy
- Spain
- Russia
- Rest of Europe
- Asia Pacific
- China
- Japan
- India
- South Korea
- Rest of Asia Pacific
- Middle East and Africa
- Saudi Arabia
- United Arab Emirates
- Turkey
- South Africa
- Egypt
- Rest of Middle East and Africa
- North America
Geography Analysis
North America secures 38.22% of the school bus market share in 2025, reflecting cumulative advantages in funding, manufacturing, and grid integration. State-utility partnerships support V2G pilots that transform parked fleets into distributed energy resources, offsetting higher acquisition expense. Canada contributes additional momentum via green infrastructure funds and emissions-reduction targets, while Mexico's role in USMCA streamlines supply chains but leaves adoption centered in metropolitan corridors.
The Asia Pacific registers the sector's highest forward momentum, tracking a 5.64% CAGR through 2031, as China couples compulsory electrification targets with domestic battery capacity, which compresses cost curves. India's National Electric Bus Program widens the addressable base, with tier-two cities procuring purpose-built school buses for the first time. Japan and South Korea embed advanced ADAS, elevating regional safety benchmarks that reverberate into international standards.
Europe maintains stable gains as Euro VII standards phase out high-sulfur diesel and national stimulus funds subsidize alternative drivetrains. Germany explores hydrogen routes, leveraging existing fuel-cell competencies, while the United Kingdom emphasizes rural service connectivity through smaller bus footprints. Southern European economies progress more cautiously due to fiscal headroom constraints, yet municipal congestion-charging schemes indirectly hasten diesel replacement.
- Blue Bird Corporation
- Thomas Built Buses Inc.
- IC Bus LLC (International Motors LLC)
- Collins Bus Corporation
- Lion Electric Company
- BYD Co. Ltd.
- GreenPower Motor Company
- Girardin Minibus Inc.
- Yutong Bus Co. Ltd.
- Micro Bird Inc.
- Proterra Inc.
- Zhengzhou Yutong Bus Co. Ltd.
- Zhongtong Bus Holding Co. Ltd.
- FAW Bus and Coach Co. Ltd.
- Tata Motors Ltd.
- Ashok Leyland Ltd.
- Alexander Dennis Ltd.
- NFI Group Inc.
- Dongfeng Motor Corporation
- Mahindra & Mahindra Ltd.
- JCBL Limited
Additional Benefits:
- The market estimate (ME) sheet in Excel format
- 3 months of analyst support
TABLE OF CONTENTS
1 Introduction
- 1.1 Study Assumptions & Market Definition
- 1.2 Scope of the Study
2 Research Methodology
3 Executive Summary
4 Market Landscape
- 4.1 Market Overview
- 4.2 Market Drivers
- 4.2.1 Government Emissions Standards Accelerating Fleet Electrification
- 4.2.2 Dedicated Federal & State Funding Pools For Zero-Emission School Buses
- 4.2.3 Rising Adoption Of Advanced Safety Technologies
- 4.2.4 Vehicle-To-Grid (V2G) Revenue Potential For School Districts
- 4.2.5 Subscription-Based Fleet-As-A-Service Models
- 4.2.6 AI-Driven Route Optimisation Lowering OPEX
- 4.3 Market Restraints
- 4.3.1 High Upfront Cost Of Electric & Fuel-Cell Variants
- 4.3.2 Limited Charging / Hydrogen Refuelling Infrastructure
- 4.3.3 Battery-Supply Volatility Extending Production Lead-Times
- 4.3.4 Shortage Of Technicians Skilled In Alternative Drivetrains
- 4.4 Value / Supply-Chain Analysis
- 4.5 Technological Outlook
- 4.6 Regulatory Landscape
- 4.7 Porter's Five Forces
- 4.7.1 Bargaining Power of Suppliers
- 4.7.2 Bargaining Power of Buyers
- 4.7.3 Threat of New Entrants
- 4.7.4 Threat of Substitutes
- 4.7.5 Competitive Rivalry
5 Market Size & Growth Forecasts (Value (USD) and Volume (Units))
- 5.1 By Powertrain
- 5.1.1 Internal-Combustion Engine (ICE)
- 5.1.2 Battery-Electric
- 5.1.3 Fuel-Cell Electric
- 5.2 By Seating Capacity
- 5.2.1 Less than or equal to 30 Seats
- 5.2.2 31-60 Seats
- 5.2.3 More than 60 Seats
- 5.3 By Bus Type
- 5.3.1 Type A
- 5.3.2 Type B
- 5.3.3 Type C
- 5.3.4 Type D
- 5.4 By End User
- 5.4.1 Public School Districts
- 5.4.2 Private & Charter Operators
- 5.4.3 Contractors & Leasing Companies
- 5.5 By Geography
- 5.5.1 North America
- 5.5.1.1 United States
- 5.5.1.2 Canada
- 5.5.1.3 Rest of North America
- 5.5.2 South America
- 5.5.2.1 Brazil
- 5.5.2.2 Argentina
- 5.5.2.3 Rest of South America
- 5.5.3 Europe
- 5.5.3.1 Germany
- 5.5.3.2 United Kingdom
- 5.5.3.3 France
- 5.5.3.4 Italy
- 5.5.3.5 Spain
- 5.5.3.6 Russia
- 5.5.3.7 Rest of Europe
- 5.5.4 Asia Pacific
- 5.5.4.1 China
- 5.5.4.2 Japan
- 5.5.4.3 India
- 5.5.4.4 South Korea
- 5.5.4.5 Rest of Asia Pacific
- 5.5.5 Middle East and Africa
- 5.5.5.1 Saudi Arabia
- 5.5.5.2 United Arab Emirates
- 5.5.5.3 Turkey
- 5.5.5.4 South Africa
- 5.5.5.5 Egypt
- 5.5.5.6 Rest of Middle East and Africa
- 5.5.1 North America
6 Competitive Landscape
- 6.1 Market Concentration
- 6.2 Strategic Moves
- 6.3 Market Share Analysis
- 6.4 Company Profiles (Includes Global Level Overview, Market Level Overview, Core Segments, Financials as Available, Strategic Information, Market Rank/Share for Key Companies, Products and Services, SWOT Analysis, and Recent Developments)
- 6.4.1 Blue Bird Corporation
- 6.4.2 Thomas Built Buses Inc.
- 6.4.3 IC Bus LLC (International Motors LLC)
- 6.4.4 Collins Bus Corporation
- 6.4.5 Lion Electric Company
- 6.4.6 BYD Co. Ltd.
- 6.4.7 GreenPower Motor Company
- 6.4.8 Girardin Minibus Inc.
- 6.4.9 Yutong Bus Co. Ltd.
- 6.4.10 Micro Bird Inc.
- 6.4.11 Proterra Inc.
- 6.4.12 Zhengzhou Yutong Bus Co. Ltd.
- 6.4.13 Zhongtong Bus Holding Co. Ltd.
- 6.4.14 FAW Bus and Coach Co. Ltd.
- 6.4.15 Tata Motors Ltd.
- 6.4.16 Ashok Leyland Ltd.
- 6.4.17 Alexander Dennis Ltd.
- 6.4.18 NFI Group Inc.
- 6.4.19 Dongfeng Motor Corporation
- 6.4.20 Mahindra & Mahindra Ltd.
- 6.4.21 JCBL Limited
7 Market Opportunities & Future Outlook
- 7.1 White-space & Unmet-need Assessment