|
시장보고서
상품코드
2114451
모바일 엣지 컴퓨팅 시장 : 시장 점유율 분석, 업계 동향 및 통계, 성장 예측(2026-2031년)Mobile Edge Computing - Market Share Analysis, Industry Trends & Statistics, Growth Forecasts (2026 - 2031) |
||||||
 Mordor Intelligence
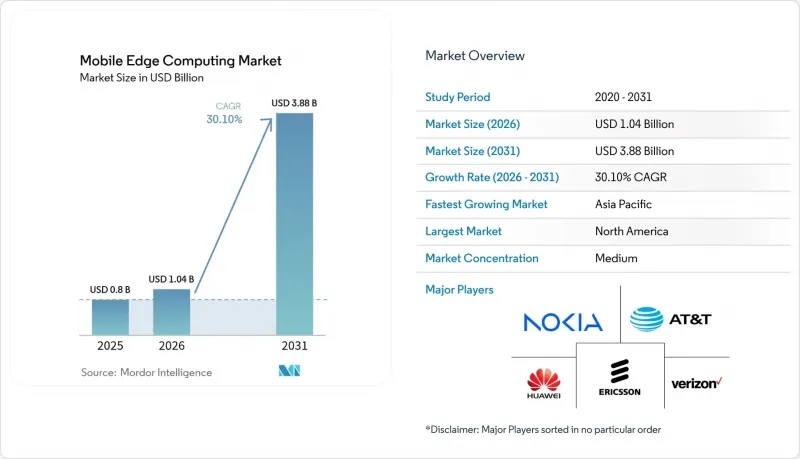
Mordor Intelligence에 의하면, 모바일 엣지 컴퓨팅 시장 규모는 2025년에 8억 달러로 평가되었고, 2026년 10억 4,000만 달러에서 2031년까지 38억 8,000만 달러에 이를 것으로 예상되며, 예측 기간(2026-2031년) CAGR은 30.10%를 나타낼 전망입니다.
본 보고서는 구성 요소별(하드웨어, 소프트웨어, 서비스), 최종 사용자별(은행 및 금융 서비스, 소매, 헬스케어 및 생명과학, 산업 제조 등), 지역별(북미, 남미, 유럽, 아시아태평양, 중동 및 아프리카)로 분류되어 있습니다. 시장 예측은 금액(달러) 기준으로 제시되어 있습니다.
세계의 모바일 엣지 컴퓨팅 시장 동향 및 인사이트
아시아에서는 지연에 민감한 소비자용 앱(AR/VR 게임, 라이브 스트리밍)이 세를 넓히고 있습니다.
AR/VR 게임 및 라이브 스트리밍은 왕복 지연 시간 20밀리초 미만을 요구함으로써 네트워크 설계 방식을 지속적으로 변화시키고 있습니다. 에릭슨의 실증 실험에 따르면, 게임 서버를 엣지 노드로 이전함으로써 전송 지연을 75% 줄일 수 있어, 전파 상황이 불안정한 환경에서도 원활한 게임 플레이를 지속할 수 있게 됩니다. 2024년 모바일 게임 매출이 56억 달러를 넘어선 한국에서는 통신 사업자들이 이미 인구 밀집 도시권 근처에 멀티 액세스 엣지 컴퓨팅(MEC) 클러스터를 구축하고 있으며, 지연에 민감한 게임 타이틀을 대상으로 프리미엄 구독 요금제를 제공합니다. 컨텐츠 제공업체는 사용자당 유지율과 수익 향상이라는 이점을 누리는 반면, 통신 사업자는 차별화된 경험 품질(QoE)을 통해 수익화를 꾀하고 있습니다. 5G SA의 커버리지 범위가 확대되고 단말기 보급이 진행됨에 따라 일본, 중국 및 미국의 특정 시장에서도 유사한 추세가 나타나고 있습니다.
북미의 5G 독립형(SA) 급속한 확장이 MEC 수익화를 가능하게 함
2024년 중반 기준으로 29개국 49개 통신 사업자가 5G SA를 시작했으나, 전국적인 커버리지 측면에서는 북미의 통신 사업자가 선두를 달리고 있습니다. T-Mobile의 본격적인 SA 구축으로 에지 워크로드에 맞춘 확정적인 네트워크 슬라이싱이 가능해졌으며, 이는 엔터프라이즈 용도를 위한 새로운 서비스 수준 계약(SLA)의 기반이 되고 있습니다. Verizon은 VR, 자율주행, 실시간 분석을 실현하기 위해 에지 지연을 10밀리초 미만으로 억제하는 것을 목표로 하고 있습니다. 수익 기회는 온디맨드 품질 및 위치 기반 컴퓨팅 등 네트워크 API의 종량제 제공에서 비롯됩니다. 하이퍼스케일러와의 협력을 통해 용도 도입이 가속화되고, 개발자 시장 출시까지 걸리는 시간이 단축됩니다.
멀티 액세스 엣지를 위한 전 세계적으로 통일된 보안 및 신뢰성 프레임워크의 부재
엣지 인프라에서는 워크로드, 데이터, 오케스트레이션이 수천 개의 무인 관리 노드에 걸쳐 있기 때문에 공격 표면이 확대되고 있습니다. 학술 연구에 따르면, 캐시된 컨텐츠나 오케스트레이션 API를 표적으로 한 DDoS 공격 및 측면 이동(lateral movement) 위협이 급증하고 있습니다. 규제 대상 산업에서는 제로 트러스트 참조 모델, 보안 엔클레이브 지원 및 연합 ID 표준이 성숙해질 때까지 기밀성이 높은 워크로드의 이전을 주저하고 있습니다. ETSI MEC 워킹그룹은 도메인 간 신뢰 사양을 수립 중이지만, 완전한 합의에 도달하기까지는 아직 수년이 소요될 것으로 예상되어 통합 주기가 장기화되고, 다국적 배포 시 규정 준수 비용이 증가하고 있습니다.
부문 분석
2025년에는 서버, 내환경성 섀시 및 전용 네트워크 인터페이스 카드에 대한 투자에 힘입어 하드웨어 부문이 모바일 엣지 컴퓨팅 시장 매출의 60.60%를 차지했습니다. 그럼에도 불구하고 오케스트레이션, CI/CD 파이프라인, AI 프레임워크를 통해 유연한 도입 모델이 가능해짐에 따라, 소프트웨어 부문은 2026년부터 2031년까지 연평균 성장률(CAGR) 36.2%를 나타낼 것으로 예측되며, 이는 모바일 엣지 컴퓨팅 시장 전체의 성장률을 크게 상회할 전망입니다. 엣지 오케스트레이션 제품군은 현재 서비스 메시와 정책 엔진을 결합하여 네트워크 슬라이스를 컴퓨팅 및 스토리지 예약으로 변환함으로써, 통신 사업자가 몇 달이 아닌 몇 시간 만에 새로운 서비스를 시작할 수 있도록 지원합니다.
2025년까지는 소프트웨어 정의 기능에 AI 기반 리소스 스케줄러, 예측 유지보수 및 제로 터치 프로비저닝이 통합된 것으로 평가되었습니다. Akamai의 WebAssembly 채택은 Fermyon과 결합되어 콜드 스타트 지연 시간을 10밀리초 미만으로 단축하는 경량 실행 환경을 구현하고 있으며, 이는 대화형 워크로드에 필수적인 요건입니다. 그 결과, 하이퍼스케일러와 통신 사업자들은 4-5년마다 엣지 하드웨어를 지속적으로 업데이트하는 한편, 연구 개발(R&D) 예산을 플랫폼 소프트웨어로 전환하고 있습니다. 기업들이 복잡한 업무를 외부에 위탁함에 따라 서비스, 컨설팅, 통합 및 관리형 운영에 대한 수요도 증가하고 있습니다. 특히, 프라이빗 및 퍼블릭 하이브리드 엣지 환경을 운영하는 의료 및 제조업 고객들 사이에서는 멀티 벤더 블루프린트에 대한 수요가 특히 높아지고 있습니다.
지역별 분석
북미는 전국 규모의 5G SA 연결, 고밀도 광섬유 백본, 그리고 하이퍼스케일러의 강력한 입지를 배경으로 2025년 모바일 엣지 컴퓨팅 시장 매출의 40.80%를 차지했습니다. AWS Wavelength Zones 및 Microsoft Azure Edge Zones는 40개 이상의 대도시권에 구축되어 있으며, 개발자들에게 소비자용 및 산업용 앱을 위한 20밀리초 미만의 왕복 지연 시간을 제공합니다. 클라우드 시장의 집중에 대한 규제 당국의 감시가 강화됨에 따라, 통신 사업자들은 공급업체의 다각화를 추진하고 있으며, 인프라 기업 및 반도체 벤더와의 제휴가 촉진되고 있습니다.
아시아태평양은 수십억 달러 규모의 스마트 시티 투자, 견고한 제조 거점, 그리고 세계 최고의 모바일 게임 지출에 힘입어 2026-2031년 연평균 성장률(CAGR) 35.4%라는 가장 빠른 성장을 기록할 것으로 예측됩니다. 차이나모바일과 화웨이가 진행한 실증 실험은 고속철도에서 AR을 활용한 유지보수 작업을 지원하는 국가 차원의 엣지 배포 사례를 보여줍니다. 일본의 통신 사업자들은 게임기 제조업체와 제휴하여 다운로드 없이 AAA급 타이틀을 스트리밍으로 제공하고 있는 반면, 인도의 Jio는 MEC를 통합하여 백홀의 혼잡을 완화하면서 농촌 지역의 통신 커버리지를 확대되고 있습니다.
유럽에서는 산업용도, 개인정보 보호, 데이터 현지화가 중시되고 있습니다. ETSI의 MEC 규격은 국경을 초월한 서비스 이식성을 보장하고 있으며, 보다폰이 2030년까지 기지국의 30%에 Open RAN을 도입하겠다는 계획은 해당 지역이 공급망의 회복탄력성에 주력하고 있음을 뒷받침합니다. 중동에서는 인지형 엣지 인프라를 통합한 NEOM과 같은 기가 프로젝트가 진행되고 있는 반면, 아프리카와 남미에서는 외딴 지역의 이러닝, 원격 의료, 광업 운영 시 발생하는 지연을 줄이기 위해 MEC가 도입되고 있습니다.
기타 혜택 :
- 엑셀 형식 시장 예측(ME) 시트
- 3개월간의 애널리스트 지원
자주 묻는 질문
목차
제1장 서론
제2장 조사 방법
제3장 주요 요약
제4장 시장 구도
제5장 시장 규모 및 성장 예측
제6장 경쟁 구도
제7장 시장 기회 및 향후 전망
AJY 26.08.26According to Mordor Intelligence, the mobile edge computing market size was valued at USD 0.80 billion in 2025 and estimated to grow from USD 1.04 billion in 2026 to reach USD 3.88 billion by 2031, at a CAGR of 30.10% during the forecast period (2026-2031).
This report is Segmented by Component (Hardware, Software, and Services), End-User (Banking and Financial Services, Retail, Healthcare and Life Sciences, Industrial Manufacturing, and More), and Geography (North America, South America, Europe, Asia-Pacific, and Middle East and Africa). The Market Forecasts are Provided in Terms of Value (USD).
Global Mobile Edge Computing Market Trends and Insights
Latency-critical consumer apps (AR/VR gaming, livestreaming) gaining traction in Asia
AR/VR gaming and livestreaming continue to reshape network design by demanding sub-20 millisecond round-trip latency. Ericsson's trials demonstrate that relocating game servers to edge nodes can reduce transport latency by 75%, enabling sustained fluid gameplay under fluctuating radio conditions. Telecom operators in South Korea, where mobile gaming revenue exceeded USD 5.6 billion in 2024, have already deployed multi-access edge computing clusters near dense urban zones, enabling premium subscription tiers for latency-sensitive titles. Content providers benefit from higher retention and revenue per user, while operators monetize the differentiated quality of experience. Similar patterns are emerging in Japan, China, and select U.S. markets as 5G SA coverage expands and device adoption grows.
Rapid 5G standalone roll-outs unlocking MEC monetization in North America
Forty-nine operators in 29 countries had launched 5G SA by mid-2024, but North American carriers lead in national coverage. T-Mobile's full-scale SA deployment permits deterministic network slicing aligned with edge workloads and underpins new service-level agreements for enterprise applications. Verizon targets sub-10 millisecond edge latency to enable VR, autonomous mobility, and real-time analytics. Revenue opportunities stem from pay-as-you-go exposure of network APIs, including quality-on-demand and location-based compute. Collaboration with hyperscalers accelerates application onboarding and shortens time-to-market for developers.
Absence of globally harmonized security & trust framework for multi-access edge
Edge infrastructure widens the attack surface because workloads, data, and orchestration span thousands of unattended nodes. Academic studies show a surge in DDoS and lateral-movement threats targeting cached content and orchestration APIs. Regulated sectors hesitate to migrate sensitive workloads until zero-trust reference models, secure enclave support, and federated identity standards mature. ETSI MEC working groups are drafting inter-domain trust specifications, yet full consensus remains years away, prolonging integration cycles and increasing compliance costs for multinational deployments.
Other drivers and restraints analyzed in the detailed report include:
- Telco adoption of disaggregated Open RAN driving on-prem edge demand in Europe
- Industrial Time-Sensitive Networking mandates (IEC/IEEE 60802) in manufacturing hubs
- Scarcity of ruggedized micro-data-center hardware in extreme climates
For complete list of drivers and restraints, kindly check the Table Of Contents.
Segment Analysis
In 2025 the hardware segment accounted for 60.60% of mobile edge computing market revenue, anchored by investments in servers, rugged enclosures, and specialized network interface cards. Nevertheless, software is projected to grow at a 36.2% CAGR between 2026 and 2031, significantly outpacing the overall mobile edge computing market growth rate, as orchestration, CI/CD pipelines, and AI frameworks enable flexible deployment models. Edge orchestration suites now combine service meshes with policy engines that translate network slices into compute and storage reservations, enabling operators to launch new services in hours instead of months.
By 2025, software-defined functions will embed AI-powered resource schedulers, predictive maintenance, and zero-touch provisioning. Akamai's adoption of WebAssembly, alongside Fermyon, exemplifies lighter-weight execution that trims cold-start latency to sub-10 milliseconds, a prerequisite for interactive workloads. Consequently, hyperscalers and telcos are shifting their R&D budgets toward platform software, even as they continue to refresh edge hardware every four to five years. Services, consulting, integration, and managed operations are catching up as enterprises outsource complexity. The demand for multi-vendor blueprints is particularly high among healthcare and manufacturing clients that operate hybrid private/public edge footprints.
Complete Report Scope:
- By Component
- Hardware
- Software
- Services
- By End-user
- Banking and Financial Services
- Retail
- Healthcare and Life Sciences
- Industrial Manufacturing
- Energy and Utilities
- Telecommunications
- Other End-users
- By Geography
- North America
- United States
- Canada
- Mexico
- South America
- Brazil
- Argentina
- Chile
- Peru
- Rest of South America
- Europe
- Germany
- United Kingdom
- France
- Italy
- Spain
- Rest of Europe
- Asia-Pacific
- China
- Japan
- South Korea
- India
- Australia
- New Zealand
- Rest of Asia-Pacific
- Middle East and Africa
- Middle East
- United Arab Emirates
- Saudi Arabia
- Rest of Middle East
- Africa
- South Africa
- Nigeria
- Rest of Africa
- Middle East
- North America
Geography Analysis
North America generated 40.80% of mobile edge computing market revenue in 2025, leveraged by nationwide 5G SA connectivity, dense fiber backbones, and strong hyperscaler presence. AWS Wavelength Zones and Microsoft Azure Edge Zones have been deployed in more than 40 metropolitan areas, offering developers sub-20 millisecond round-trip latency for consumer and industrial apps . Regulatory scrutiny of cloud concentration prompts carriers to diversify suppliers, spurring collaborative ventures with infrastructure companies and semiconductor vendors.
Asia-Pacific is expected to register the fastest growth, at a 35.4% CAGR during 2026-2031, driven by multi-billion-dollar smart-city investments, robust manufacturing bases, and the world's highest mobile-gaming spending. China Mobile's trials with Huawei illustrate nation-scale edge roll-outs supporting AR-assisted maintenance on high-speed rail. Japan's telcos partner with console publishers to stream AAA titles without downloads, whereas India's Jio integrates MEC to reduce backhaul congestion while expanding rural coverage.
Europe emphasizes industrial applications, privacy, and data localization. ETSI's MEC standards assure cross-border service portability, and Vodafone's commitment to deploy Open RAN across 30% of masts by 2030 underscores the region's focus on supply-chain resilience. The Middle East advances giga-projects such as NEOM that embed cognitive edge infrastructure, while Africa and South America adopt MEC to alleviate latency for e-learning, telemedicine, and mining operations in remote zones.
- Huawei Technologies Co. Ltd.
- Nokia Corporation
- Telefonaktiebolaget LM Ericsson
- AT&T Inc.
- Verizon Communications Inc.
- Amazon Web Services Inc.
- Microsoft Corp. (Azure Edge Zones)
- Google LLC (Google Distributed Cloud Edge)
- Cisco Systems Inc.
- Hewlett Packard Enterprise Co.
- IBM Corp.
- ZTE Corp.
- EdgeConneX Inc.
- Cloudflare Inc.
- Fermyon Technologies
- Saguna Networks Ltd.
- ADLINK Technology Inc.
- ADVA Optical Networking SE
- Akamai Technologies
- CoreSite
Additional Benefits:
- The market estimate (ME) sheet in Excel format
- 3 months of analyst support
TABLE OF CONTENTS
1 INTRODUCTION
- 1.1 Study Assumptions and Market Definition
- 1.2 Scope of the Study
2 RESEARCH METHODOLOGY
3 EXECUTIVE SUMMARY
4 MARKET LANDSCAPE
- 4.1 Market Overview
- 4.2 Market Drivers
- 4.2.1 Latency-critical consumer apps (AR/VR gaming, livestreaming) gaining traction in Asia
- 4.2.2 Rapid 5G standalone roll-outs unlocking MEC monetisation in North America
- 4.2.3 Telco adoption of disaggregated Open RAN driving on-prem edge demand in Europe
- 4.2.4 Industrial time-sensitive networking mandates (IEC/IEEE 60802) in manufacturing hubs
- 4.2.5 Government smart-city megaprojects (e.g., NEOM, Saudi Arabia) embedding MEC
- 4.2.6 AI-inferencing at the edge lowering cloud egress costs for hyperscalers
- 4.3 Market Restraints
- 4.3.1 Absence of globally harmonised security & trust framework for multi-access edge
- 4.3.2 Scarcity of ruggedised micro-data-centre hardware in tropical & desert climates
- 4.3.3 High TCO of edge orchestration platforms for Tier-2/3 mobile operators
- 4.3.4 Shortage of MEC-skilled DevOps talent delaying PoC-to-production conversions
- 4.4 Technological Outlook
- 4.5 Porter's Five Forces Analysis
- 4.5.1 Bargaining Power of Suppliers
- 4.5.2 Bargaining Power of Buyers
- 4.5.3 Threat of New Entrants
- 4.5.4 Threat of Substitutes
- 4.5.5 Intensity of Competitive Rivalry
- 4.6 Investment Analysis
- 4.7 Impact of Macroeconomic Factors on the Market
5 MARKET SIZE AND GROWTH FORECASTS (VALUE)
- 5.1 By Component
- 5.1.1 Hardware
- 5.1.2 Software
- 5.1.3 Services
- 5.2 By End-user
- 5.2.1 Banking and Financial Services
- 5.2.2 Retail
- 5.2.3 Healthcare and Life Sciences
- 5.2.4 Industrial Manufacturing
- 5.2.5 Energy and Utilities
- 5.2.6 Telecommunications
- 5.2.7 Other End-users
- 5.3 By Geography
- 5.3.1 North America
- 5.3.1.1 United States
- 5.3.1.2 Canada
- 5.3.1.3 Mexico
- 5.3.2 South America
- 5.3.2.1 Brazil
- 5.3.2.2 Argentina
- 5.3.2.3 Chile
- 5.3.2.4 Peru
- 5.3.2.5 Rest of South America
- 5.3.3 Europe
- 5.3.3.1 Germany
- 5.3.3.2 United Kingdom
- 5.3.3.3 France
- 5.3.3.4 Italy
- 5.3.3.5 Spain
- 5.3.3.6 Rest of Europe
- 5.3.4 Asia-Pacific
- 5.3.4.1 China
- 5.3.4.2 Japan
- 5.3.4.3 South Korea
- 5.3.4.4 India
- 5.3.4.5 Australia
- 5.3.4.6 New Zealand
- 5.3.4.7 Rest of Asia-Pacific
- 5.3.5 Middle East and Africa
- 5.3.5.1 Middle East
- 5.3.5.1.1 United Arab Emirates
- 5.3.5.1.2 Saudi Arabia
- 5.3.5.1.3 Rest of Middle East
- 5.3.5.2 Africa
- 5.3.5.2.1 South Africa
- 5.3.5.2.2 Nigeria
- 5.3.5.2.3 Rest of Africa
- 5.3.5.1 Middle East
- 5.3.1 North America
6 COMPETITIVE LANDSCAPE
- 6.1 Strategic Developments
- 6.2 Vendor Positioning Analysis
- 6.3 Company Profiles (includes Global level Overview, Market level overview, Core Segments, Financials as available, Strategic Information, Products & Services, and Recent Developments)
- 6.3.1 Huawei Technologies Co. Ltd.
- 6.3.2 Nokia Corporation
- 6.3.3 Telefonaktiebolaget LM Ericsson
- 6.3.4 AT&T Inc.
- 6.3.5 Verizon Communications Inc.
- 6.3.6 Amazon Web Services Inc.
- 6.3.7 Microsoft Corp. (Azure Edge Zones)
- 6.3.8 Google LLC (Google Distributed Cloud Edge)
- 6.3.9 Cisco Systems Inc.
- 6.3.10 Hewlett Packard Enterprise Co.
- 6.3.11 IBM Corp.
- 6.3.12 ZTE Corp.
- 6.3.13 EdgeConneX Inc.
- 6.3.14 Cloudflare Inc.
- 6.3.15 Fermyon Technologies
- 6.3.16 Saguna Networks Ltd.
- 6.3.17 ADLINK Technology Inc.
- 6.3.18 ADVA Optical Networking SE
- 6.3.19 Akamai Technologies
- 6.3.20 CoreSite
7 MARKET OPPORTUNITIES AND FUTURE OUTLOOK
- 7.1 White-space and Unmet-Need Assessment