

|
시장보고서
상품코드
2114483
광학 선별기 : 시장 점유율 분석, 업계 동향 및 통계, 성장 예측(2026-2031년)Optical Sorter - Market Share Analysis, Industry Trends & Statistics, Growth Forecasts (2026 - 2031) |
||||||
 Mordor Intelligence
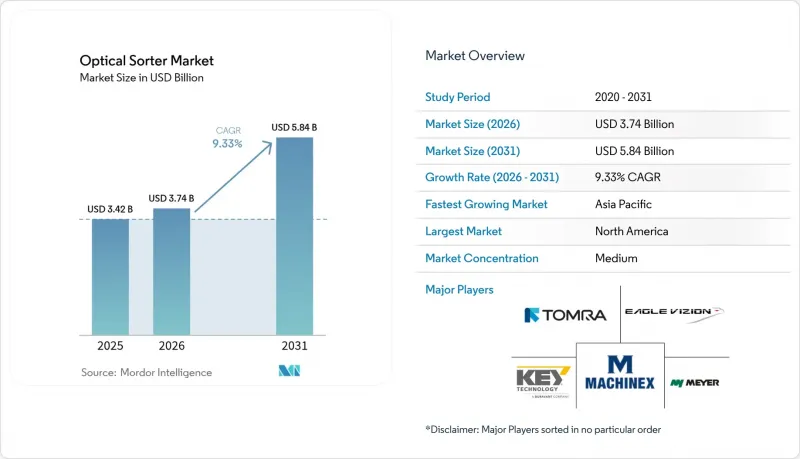
Mordor Intelligence에 의하면, 2026년 광학식 선별기 시장 규모는 37억 4,000만 달러로 추정되고 2025년 34억 2,000만 달러에서 확대해, 2031년에는 58억 4,000만 달러에 이를 것으로 예측됩니다.
2026년부터 2031년까지의 연평균 성장률(CAGR)은 9.33%가 될 것으로 전망됩니다.
본 보고서는 기술별(X선 투과식, 카메라 솔루션 등), 최종 사용자 산업별(식품 가공, 재활용, 광업 등), 플랫폼별(벨트식, 자유 낙하식 등) 및 지역별로 분류되어 있습니다. 시장 전망은 금액(미 달러) 단위로 제시되어 있습니다.
세계의 광학 선별기 시장 동향 및 인사이트
북미 대규모 식품 공장의 자동화 수요
만성적인 인력 부족-2024년 말 기준 미국에서 61만 5,000건의 제조업 구인 공고가 미충원 상태-으로 인해, 가공업체들은 연중무휴 24시간 가동을 유지하면서 제품 수율을 25-35% 향상시키는 고속 광학 선별기로,수작업 검사원을 대체할 수밖에 없는 상황에 처해 있습니다. 각 플랫폼 공급업체들은 현재 생산 변동으로부터 학습하는 비전 알고리즘을 통합하여, 생산 라인을 중단하지 않고도 정확도를 유지하고 있습니다. 자본 예산에도 이러한 우선순위의 변화가 반영되어, 미국의 식품 제조업체들은 2021년부터 2024년 사이에 자동화에 550억 달러를 투자하며, 99%의 검출 정확도를 달성할 수 있는 차세대 벨트식 선별기에 대한 투자 비중을 높이고 있습니다.
전 세계 HACCP 및 EU 식품 위생 규제의 강화
EU 규정 2023/915에서는 광학 선별기가 미코톡신 및 물리적 오염 물질에 대한 권장 완화 조치로 명시되어 있으며, 유럽 시장을 대상으로 하는 가공업체에 대해 인증된 시스템의 도입이 의무화되어 있습니다. 이와 유사한 규정이 아시아 전역으로 확산되고 있으며, 다국적 식품 기업들은 품질 관리에 대한 투자를 일제히 추진하고 있습니다. 규정 준수 감사에서는 디지털 결함 로그 제출이 점점 더 요구되고 있으며, 이 기능은 AI 탑재 선별기에 내장되어 있어 추적성을 확보하기 위해 모든 불량품을 기록하고 보관합니다.
중소규모 곡물 가공업체의 하이퍼스펙트럼 및 X선 시스템에 대한 고액의 설비 투자
완비된 하이퍼스펙트럼 선별기의 가격은 50만 달러를 초과하기도 하는데, 이 금액은 중소규모 곡물 가공업체의 재무 상황을 압박할 만한 수준입니다. 조사에 따르면, 특히 신용 한도가 엄격한 상황에서 초기 비용이 첨단 설비 도입의 가장 큰 장벽이 되고 있습니다. 리스 제도가 없기 때문에 많은 제분업자들은 여전히 성능이 떨어지는 카메라만 장착된 장비에 의존하고 있습니다.
부문별 분석
매출액 기준으로 볼 때, 2025년 광학 선별기 시장에서 카메라 시스템은 33.92%의 점유율을 차지했습니다. 이는 색상을 기반으로 한 결함 제거에 있어 그 범용성 덕분입니다. NIR(근적외선) 플랫폼에 기인한 광학 선별기 시장 규모는 가공업체들이 스펙트럼 지문을 활용하여 폴리머, 단백질 및 고부가가치 광석 성분을 구별하게 됨에 따라 11.45%라는 가장 높은 연평균 성장률(CAGR)을 나타낼 전망입니다. 현재 각 벤더들은 머신러닝 엔진을 통합하여 감지 정확도를 95%까지 높이고, 오배제율을 두 자릿수 수준으로 줄이고 있습니다. 레이저 솔루션은 형상 기반 판별 분야에서 틈새 수요를 유지하고 있는 반면, 하이퍼스펙트럼 시스템은 피스타치오의 아플라톡신 검출이나 보석 선별과 같은 프리미엄 부문을 목표로 하고 있습니다. X선 투과법은 구리 및 리튬 광산에서 고밀도 물질의 분리에 주목받고 있으며, 가치 회수가 색상이 아닌 밀도에 의해 결정되는 경우 광학 센서를 보완하는 역할을 하고 있습니다.
각 OEM 업체들이 카메라, NIR 어레이, 단파 적외선 검출기를 동일한 케이스에 탑재함에 따라 복합 센싱이 표준화되고 있습니다. 이러한 융합을 통해 설치 면적이 줄어들고, 보정이 용이해지며, 대상 결함 프로파일의 범위도 확대됩니다. EU의 자금 지원을 받은 연구개발 컨소시엄은 AI를 활용한 하이퍼스펙트럼 모듈을 통해 2023년 기준치에 비해 전체 수율이 20% 향상될 것으로 예측했습니다. 다국적 기업들이 턴키 솔루션을 요구하는 가운데, 센서 간 데이터 융합에 정통한 플랫폼 공급업체들은 장기 서비스 계약을 확보할 수 있을 것으로 보입니다.
지역별 분석
북미는 가공업체들이 만성적인 인력 부족에 대처하고, FSMA(식품 안전 현대화법) 및 주 차원의 재생 원료 함유율 규정을 준수하기 위해 자동화를 도입한 결과, 2025년 매출의 33.55%를 차지했습니다. 스마트 제조를 위해 총 3,300만 달러가 배정된 연방 정부의 에너지 보조금은 육류, 유제품, 음료 시설에서의 광학 선별 시스템 개조를 가속화하고 있습니다. 캐나다의 ‘플라스틱 혁신 과제(Plastic Innovation Challenge)’는 AI 주도 하이퍼스펙트럼 프로젝트에 추가 자금을 투입하고 있으며, 이를 통해 재활용 업체들은 연포장재의 회수율을 2배로 높일 수 있게 될 것입니다.
아시아태평양은 2031년까지 연평균 성장률(CAGR) 12.32%로 시장을 주도할 것으로 예측됩니다. 이는 중국 샤먼에 건설된 국내 최초의 완전 자동화 골판지 선별 공장과, 로봇 비전 시스템 수요 증가가 예상되는 일본의 인구 통계학적 역풍이 원동력이 되고 있습니다. 베트남의 생산자 책임 제도(EPR) 도입에 따라 브랜드 기업들은 다운스트림 공정에서의 순도 향상에 자금을 투입해야 할 의무가 생겼으며, 이로 인해 광학 장비를 많이 사용하는 PET 및 HDPE 선별 설비에 대한 설비 투자가 촉진되고 있습니다. 한국에서는 2018년 이후 플라스틱 폐기물이 49% 증가한 데 더해, 재활용률 70%라는 목표가 제시됨에 따라, 이로 인해 처리 용량이 큰 벨트식 플랫폼에 대한 수주가 촉진되고 있습니다. 한편, 호주는 2억 호주 달러(1억 2,864만 달러) 규모의 ‘재활용 현대화 기금’을 활용하여 국내에서 광학 선별기 조립을 지원함으로써 공급망 단축을 도모하고 있습니다.
유럽에서는 순환 경제에 관한 지침과 섬유, WEEE(폐전기전자기기), 그리고 섬유계 포장재 회수에 대한 보조금을 결합함으로써 안정적인 수요를 유지하고 있습니다. 프랑스에 위치한 ANDRITZ사의 자동 라인은 섬유 구성에 따라 의류를 분류하고 있으며, 이는 EU의 자금 지원이 식품 및 음료 분야를 넘어 새로운 원료 분야로 확대되고 있음을 보여줍니다. 라틴아메리카, 중동 및 아프리카는 여전히 발전 단계에 있지만 전략적으로 중요한 시장이며, 칠레와 짐바브웨의 구리·리튬 광산에서는 광석 품위 저하와 수자원 제약을 보완하기 위해 센서를 활용한 사전 농축 기술의 시범 도입이 진행되고 있습니다.
기타 혜택 :
- 엑셀 형식 시장 예측(ME) 시트
- 3개월간의 애널리스트 지원
자주 묻는 질문
목차
제1장 서론
제2장 조사 방법
제3장 개요
제4장 시장 구도
제5장 시장 규모 및 성장 예측
제6장 경쟁 구도
제7장 시장 기회 및 향후 전망
KTH 26.08.31According to Mordor Intelligence, the optical Sorter market size in 2026 is estimated at USD 3.74 billion, growing from 2025 value of USD 3.42 billion with 2031 projections showing USD 5.84 billion, growing at 9.33% CAGR over 2026-2031.
This report is Segmented by Technology (X-Ray Transmission, Camera Solutions, and More), End-User Industry (Food Processing, Recycling, Mining, and More), Platform (Belt, Freefall, and More), and Geography. The Market Forecasts are Provided in Terms of Value (USD).
Global Optical Sorter Market Trends and Insights
Automation demand in large-scale North American food plants
Persistent staffing gaps 615,000 manufacturing jobs remained vacant in the United States at end-2024 are forcing processors to replace manual inspectors with high-speed optical sorters that sustain 24/7 uptime while securing 25-35% higher product yield. Platform vendors now bundle vision algorithms that learn from production drifts to preserve accuracy without halting the line. Capital budgets reflect this priority shift, as U.S. food manufacturers invested USD 55 billion in automation between 2021 and 2024, allocating a growing slice to next-generation belt sorters capable of achieving 99% detection precision.
Tightening global HACCP and EU food-hygiene regulations
EU Regulation 2023/915 explicitly positions optical sorter as an endorsed mitigation measure against mycotoxins and physical contaminants, compelling processors targeting the European market to adopt certified systems.Comparable rules are rippling across Asia, prompting multinational food companies to synchronize quality-control investments. Compliance audits are increasingly requesting digital defect logs, a feature integrated into AI-enabled sorters that archives every rejected item for traceability.
High CapEx for hyperspectral and X-ray systems in SME grain mills
A fully loaded hyperspectral sorter can exceed USD 500,000, a threshold that strains balance sheets of small and medium grain processors. surveys rank upfront cost as the primary barrier to advanced equipment, especially where credit lines remain tight. Without leasing schemes, many mills continue to rely on less capable camera-only machines.
Other drivers and restraints analyzed in the detailed report include:
- Labor shortages and wage inflation in European recycling
- AI-driven hyperspectral breakthroughs
- Frequent calibrations increase downtime in continuous-flow mining
For complete list of drivers and restraints, kindly check the Table Of Contents.
Segment Analysis
In revenue terms, camera systems accounted for 33.92% of the optical sorter market share in 2025, owing to their versatility in color-based defect removal. The optical sorter market size attributable to NIR platforms is on track to post the fastest 11.45% CAGR as processors utilize spectral fingerprints to distinguish polymers, proteins, and valuable ore fractions. Vendors now embed machine-learning engines that raise detection accuracy to 95%, trimming false-reject rates by double digits. Laser solutions retain niche demand for geometry-based differentiation, while hyperspectral systems target premium segments such as aflatoxin detection in pistachios or gemstone sorting. X-ray transmission is gaining traction in the separation of dense materials within copper and lithium mines, complementing optical sensors when density, rather than color, determines value recovery.
Blended sensing is becoming standard as OEMs stack cameras, NIR arrays, and short-wave infrared detectors inside the same chassis. This convergence cuts footprint, eases calibration, and broadens target defect profiles. Euro-funded R&D consortia anticipate that AI-assisted hyperspectral modules will increase overall yield by 20% compared to 2023 baselines. As multinationals demand turnkey solutions, platform suppliers that master cross-sensor data fusion stand to secure long-term service contracts.
Complete Report Scope:
- By Technology
- Cameras
- Lasers
- NIR Sorters
- Hyperspectral Cameras
- X-ray Transmission
- By Platform
- Belt
- Freefall
- Lane
- Hybrid
- By End-User Industry
- Food Processing
- Fruits and Vegetables
- Grains and Cereals
- Nuts and Dry Fruits
- Meat and Seafood
- Confectionery and Snacks
- Recycling
- Plastics
- Metals
- Glass
- E-waste
- Mining
- Coal
- Precious and Base Metals
- Industrial Minerals
- Other Industries
- Food Processing
- By Geography
- North America
- United States
- Canada
- Mexico
- Europe
- United Kingdom
- Germany
- France
- Italy
- Rest of Europe
- Asia-Pacific
- China
- India
- Japan
- South Korea
- Australia
- Rest of Asia-Pacific
- South America
- Brazil
- Argentina
- Rest of South America
- Middle East and Africa
- Turkey
- South Africa
- Saudi Arabia
- Rest of Middle East and Africa
- North America
Geography Analysis
North America commanded 33.55% of 2025 revenues as processors adopted automation to address persistent labor shortages and comply with FSMA and state-level recycled-content regulations. Federal energy grants totaling USD 33 million earmarked for smart manufacturing accelerate optical-sorting retrofits across meat, dairy, and beverage facilities. Canada's Plastics Innovation Challenges channel additional funds toward AI-led hyperspectral projects, enabling recyclers to double the recovery of flexible packaging.
The Asia-Pacific region is forecast to lead with a 12.32% CAGR to 2031, driven by China's first fully automated carton-sorting plant in Xiamen and Japan's demographic headwinds, which are expected to boost demand for robotic vision systems. Vietnam's EPR rollout mandates brands to finance downstream purity improvements, mobilizing capex for optics-rich PET and HDPE sorting. South Korea's 49% increase in plastic waste since 2018, along with a 70% recycling rate goal, bolsters orders for high-throughput belt platforms. Meanwhile, Australia leverages its AUD 200 million (USD 128.64 million) Recycling Modernisation Fund to support local optical-sorter assembly, thereby shortening supply chains.
Europe sustains steady demand by coupling circular-economy directives with subsidies for textile, WEEE, and fiber-based packaging recovery. ANDRITZ's automated line in France that classifies garments by fiber composition illustrates how EU funding expands beyond food and beverage into new feedstocks. Latin America and Middle East & Africa remain nascent but strategic, with copper and lithium mines in Chile and Zimbabwe piloting sensor-based pre-concentration to offset declining ore grades and constrained water resources.
- TOMRA Systems ASA
- Buhler Group
- Key Technology Inc. (Duravant LLC)
- Hefei Meyer Optoelectronic Technology Inc.
- Satake Corporation
- Sesotec GmbH
- Cimbria A/S (AGCO Corporation)
- Machinex Industries Inc.
- Pellenc ST
- Eagle Vizion Inc.
- Raytec Vision S.p.A
- Steinert GmbH
- National Recovery Technologies Inc.
- Binder+Co AG
- Angelon Electronics Co. Ltd.
- Techik Instrument Co. Ltd.
- Hefei Baite Optoelectronic Technology Co. Ltd.
- Bhler Sortex Limited
- Bollegraaf Group
- Colour Sorting Group (CSG)
Additional Benefits:
- The market estimate (ME) sheet in Excel format
- 3 months of analyst support
TABLE OF CONTENTS
1 INTRODUCTION
- 1.1 Study Assumptions and Market Definition
- 1.2 Scope of the Study
2 RESEARCH METHODOLOGY
3 EXECUTIVE SUMMARY
4 MARKET LANDSCAPE
- 4.1 Market Overview
- 4.2 Market Drivers
- 4.2.1 Automation Demand for High-Throughput Sorting in Large-Scale Food Processing Plants Across North America
- 4.2.2 Tightening Global HACCP and EU Food-Hygiene Regulations Elevating Adoption of Optical Sorting
- 4.2.3 Labor Shortages and Wage Inflation Accelerating Automation Investments in European Recycling Facilities
- 4.2.4 Declining Ore Grades in Copper and Lithium Mines Triggering Sensor-Based Pre-Concentration in South America
- 4.2.5 Extended Producer Responsibility (EPR) Mandates Boosting High-Purity Plastic Flake Sorting in Asia
- 4.2.6 AI-Driven Hyperspectral Imaging Breakthroughs Expanding Addressable Use-Cases Beyond Color Sorting
- 4.3 Market Restraints
- 4.3.1 High CapEx for Hyperspectral and X-ray Systems Limiting Penetration in SME Grain Mills
- 4.3.2 Frequent Calibrations Elevate Downtime Cost in Continuous-Flow Mining Operations
- 4.3.3 Limited Availability of Skilled Vision Engineers in Developing Regions
- 4.3.4 Data Security Concerns Around Cloud-Connected Sorting Lines
- 4.4 Value / Supply-Chain Analysis
- 4.5 Regulatory Outlook
- 4.6 Technological Outlook
- 4.7 Porter's Five Forces Analysis
- 4.7.1 Bargaining Power of Suppliers
- 4.7.2 Bargaining Power of Buyers
- 4.7.3 Threat of New Entrants
- 4.7.4 Threat of Substitutes
- 4.7.5 Intensity of Competitive Rivalry
5 MARKET SIZE AND GROWTH FORECASTS (VALUE)
- 5.1 By Technology
- 5.1.1 Cameras
- 5.1.2 Lasers
- 5.1.3 NIR Sorters
- 5.1.4 Hyperspectral Cameras
- 5.1.5 X-ray Transmission
- 5.2 By Platform
- 5.2.1 Belt
- 5.2.2 Freefall
- 5.2.3 Lane
- 5.2.4 Hybrid
- 5.3 By End-User Industry
- 5.3.1 Food Processing
- 5.3.1.1 Fruits and Vegetables
- 5.3.1.2 Grains and Cereals
- 5.3.1.3 Nuts and Dry Fruits
- 5.3.1.4 Meat and Seafood
- 5.3.1.5 Confectionery and Snacks
- 5.3.2 Recycling
- 5.3.2.1 Plastics
- 5.3.2.2 Metals
- 5.3.2.3 Glass
- 5.3.2.4 E-waste
- 5.3.3 Mining
- 5.3.3.1 Coal
- 5.3.3.2 Precious and Base Metals
- 5.3.3.3 Industrial Minerals
- 5.3.4 Other Industries
- 5.3.1 Food Processing
- 5.4 By Geography
- 5.4.1 North America
- 5.4.1.1 United States
- 5.4.1.2 Canada
- 5.4.1.3 Mexico
- 5.4.2 Europe
- 5.4.2.1 United Kingdom
- 5.4.2.2 Germany
- 5.4.2.3 France
- 5.4.2.4 Italy
- 5.4.2.5 Rest of Europe
- 5.4.3 Asia-Pacific
- 5.4.3.1 China
- 5.4.3.2 India
- 5.4.3.3 Japan
- 5.4.3.4 South Korea
- 5.4.3.5 Australia
- 5.4.3.6 Rest of Asia-Pacific
- 5.4.4 South America
- 5.4.4.1 Brazil
- 5.4.4.2 Argentina
- 5.4.4.3 Rest of South America
- 5.4.5 Middle East and Africa
- 5.4.5.1 Turkey
- 5.4.5.2 South Africa
- 5.4.5.3 Saudi Arabia
- 5.4.5.4 Rest of Middle East and Africa
- 5.4.1 North America
6 COMPETITIVE LANDSCAPE
- 6.1 Market Concentration
- 6.2 Strategic Moves
- 6.3 Market Share Analysis
- 6.4 Company Profiles (includes Global level Overview, Market level overview, Core Segments, Financials as available, Strategic Information, Market Rank/Share for key companies, Products and Services, and Recent Developments)
- 6.4.1 TOMRA Systems ASA
- 6.4.2 Buhler Group
- 6.4.3 Key Technology Inc. (Duravant LLC)
- 6.4.4 Hefei Meyer Optoelectronic Technology Inc.
- 6.4.5 Satake Corporation
- 6.4.6 Sesotec GmbH
- 6.4.7 Cimbria A/S (AGCO Corporation)
- 6.4.8 Machinex Industries Inc.
- 6.4.9 Pellenc ST
- 6.4.10 Eagle Vizion Inc.
- 6.4.11 Raytec Vision S.p.A
- 6.4.12 Steinert GmbH
- 6.4.13 National Recovery Technologies Inc.
- 6.4.14 Binder+Co AG
- 6.4.15 Angelon Electronics Co. Ltd.
- 6.4.16 Techik Instrument Co. Ltd.
- 6.4.17 Hefei Baite Optoelectronic Technology Co. Ltd.
- 6.4.18 Bhler Sortex Limited
- 6.4.19 Bollegraaf Group
- 6.4.20 Colour Sorting Group (CSG)
7 MARKET OPPORTUNITIES AND FUTURE OUTLOOK
- 7.1 White-Space and Unmet-Need Assessment


