|
시장보고서
상품코드
2114521
중증근무력증 치료제 시장 : 시장 점유율 분석, 업계 동향 및 통계, 성장 예측(2026-2031년)Myasthenia Gravis Therapeutics - Market Share Analysis, Industry Trends & Statistics, Growth Forecasts (2026 - 2031) |
||||||
 Mordor Intelligence
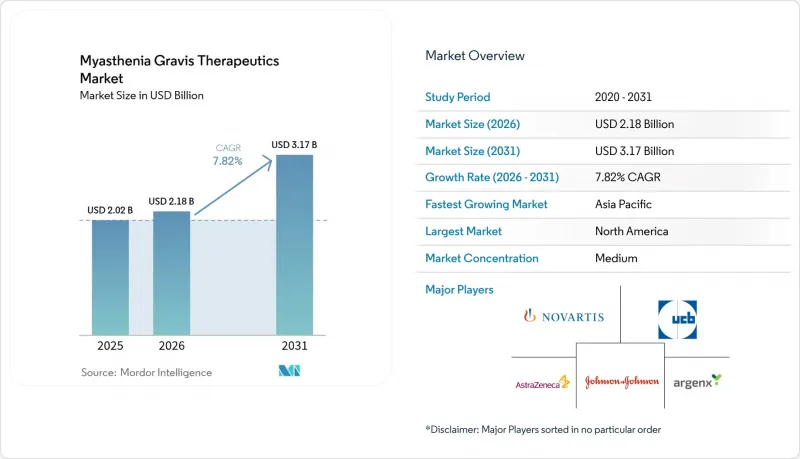
Mordor Intelligence에 의하면, 2026년 중증근무력증 치료제 시장 규모는 21억 8,000만 달러로 추정되고, 2025년 20억 2,000만 달러에서 확대해, 2031년에는 31억 7,000만 달러에 이를 것으로 예측됩니다.
2026-2031년 연평균 성장률(CAGR) 7.82%로 성장할 것으로 전망됩니다.
본 보고서는 치료법별(약제, 신속 면역요법(정맥 내 면역글로불린 등), 유전자·세포 치료 등), 투여 경로별(경구, 정맥 내 등), 약제 분류별별(콜린에스테라제 억제제, 단일클론 항체 등), 최종 사용자별(병원, 재택 간호 시설 등), 지역별로 분류되어 있습니다. 시장 예측은 금액(달러) 기준으로 제시되어 있습니다.
세계의 중증근무력증 치료제 시장 동향 및 인사이트
유병률 상승과 조기 진단
2024년에는 미국 내 신규 발병률이 100만 명당 68.5건으로 증가했습니다. 이는 인식도 향상과 신경근 검사에 대한 보험 적용 범위 확대를 반영한 것입니다. 3차 의료기관에서는 AI를 활용한 안구 운동 분석을 통해 60초 이내에 피로 징후를 파악할 수 있으며, 이로 인해 평균 진단까지의 기간이 2.3년에서 12개월 미만으로 단축된 것으로 보고되었습니다. 조기 확정 진단을 통해 임상의는 면역 조절 요법을 더 빨리 시작할 수 있게 되었으며, 1년 이내에 진단을 완료한 의료기관에서는 2년 후 추적 조사에서 최소 증상 발생률(minimal manifestation rate)이 40% 더 높은 것으로 보고되었습니다. 원격 신경학 서비스에 대한 접근성 확대와 더불어 신속한 검사 실시에 대한 보험사 측의 인센티브가 더해지면서, 중증근무력증 치료제 시장의 환자층은 지속적으로 확대되고 있습니다.
FcRn/보체 바이오로직스의 신속 승인
2023년부터 2025년에 걸쳐 4개의 획기적인 의약품(로자놀릭시주맙, 지르코플란, 니포칼리맙, 피하 투여용 에프갈티기모드)이 우선 심사 절차에 따라 불과 6-8개월 만에 규제 당국의 심사를 완료했습니다. 심사 기간 단축으로 자금 소모 기간이 줄어들어 벤처 투자자들을 유치하고, 대형 제약사의 인수 및 제휴 활동을 촉진하고 있습니다. EU, 일본, 호주에서의 병행 승인으로 거의 동시 출시가 가능해졌으며, 독점 판매 기간 동안의 전 세계 수익 창출이 가속화되고 있습니다. 이러한 동향은 중증근무력증 치료제 시장에 규모와 깊이를 더하며, 정밀 면역학이 핵심 성장 테마임을 입증하고 있습니다.
생물학적 제제의 높은 비용
FcRn 억제제의 연간 지출액은 약 83만 3,000달러이지만, 비용 대비 효과 연구에 따르면 미국 및 유럽의 지불 의향 수준을 충족시키기 위해서는 가격을 최대 88%까지 인하해야 할 필요가 있는 것으로 나타났습니다. 예산 상한선으로 인해 사전 승인에 4-6주의 지연이 발생하고 있으며, 신흥 시장의 환자들은 본인 부담금이 높기 때문에 스테로이드나 혈장 교환 요법을 선택할 수밖에 없는 상황에 내몰리는 경우가 많습니다. 따라서 신약의 임상적 우위에도 불구하고, 경제적 부담 능력의 격차가 중증근무력증 치료제 시장 수요 증가를 억제하고 있습니다.
부문 분석
유전자 치료 및 세포 치료는 연평균 성장률(CAGR) 9.41%로 가장 빠르게 성장하는 치료 범주이지만, 2025년 매출의 68.74%는 여전히 약물 치료가 차지했습니다. 초기 CAR-T에 관한 사례 연구에서는 정량적 MG 점수가 21에서 5로 감소했으며, 지속적인 면역 억제 없이도 근력 향상이 유지되고 있는 것으로 나타났습니다. 테리타시셉트가 후기 임상시험에서 보여준 98.1%의 MG-ADL 반응률과 병원성 B 세포를 선택적으로 제거하는 CAART 기술은 근치적 접근법에 대한 신뢰가 높아지고 있음을 뒷받침합니다. 벤처 캐피탈 및 질환 관련 재단의 보조금이 중요한 자금원이 되고 있는 한편, AAV 벡터에 정통한 규제 당국이 IND 심사를 효율화하고 있습니다. 일회성 치료법이 성숙해짐에 따라, 중증근무력증 치료제 시장은 초기 단계에 수익이 집중되는 경향으로 전환될 것이며, 만성적인 약제 예산은 점차 치료 후 경과 관찰로 이동할 가능성이 있습니다.
스테로이드, 콜린에스테라제 억제제, IVIg가 경증 또는 급속히 진행되는 발작 관리에 계속 사용되고 있기 때문에 기존 의약품 부문은 여전히 큰 규모를 유지하고 있습니다. 그러나 FcRn 길항제 및 보체 억제제 덕분에 현재 환자의 거의 절반에서 스테로이드 용량을 점차 줄일 수 있게 되어, 광범위한 면역억제제에 대한 의존도가 낮아지고 있습니다. 생물학적 제제와 표적 유전자 편집을 결합한 치료 프로토콜은 유지 요법의 여지를 확보하면서 고위험군에게 지속적인 관해를 가져다주는 하이브리드 치료 모델을 창출할 가능성이 있습니다. 이러한 혁신은 중증근무력증 치료제 시장의 수익 다각화를 유지하고, 제약 기업을 양극화된 규제 결과로부터 보호할 것입니다.
피하 투여는 연평균 9.85%의 성장률을 보이며, 2025년에 매출의 62.90%를 차지했던 정맥 내 투여의 우위를 서서히 잠식하고 있습니다. EMA의 자가 주사형 로자놀릭시주맙 승인 및 FDA의 Vyvgart Hytrulo 프리필드 주사기 승인은 환자 스스로 투여하는 방식의 안전성과 유효성을 입증하고 있습니다. 피하 투여는 집에서 5분 만에 완료할 수 있는 반면, 정맥 주사를 위한 병원 방문에는 몇 시간이 소요되기 때문에 복약 순응도가 89%로 향상되었으며, 병원 방문 시간을 단축하고자 하는 환자들 사이에서 피하 투여로의 전환이 진행되고 있습니다. 이러한 편의성 덕분에, 그동안 생물학적 제제 치료를 꺼려했던 지방 거주자나 이동에 제약이 있는 환자들까지 포함되면서, 중증근무력증 치료제 시장 규모가 확대되고 있습니다.
argenx사가 Halozyme사와 체결한 3,000만 달러 규모의 사업 확대와 같은 기술 제휴는 더 높은 약물 농도와 더 적은 주사량을 목표로 하고 있어, 편의성과 물류 효율을 향상시키고 있습니다. 이러한 전환으로 인해 다른 전문 분야를 위한 정맥주사 의자가 확보되어, 이는 병원 관리자에게는 환영할 만한 이점인 동시에 보험사 측의 시설 비용을 절감해 줍니다. 경구 제제는 여전히 기존의 콜린에스테라제 억제제나 스테로이드로 한정되어 있지만, 향후 서방형 제제나 나노 입자를 이용한 생물학적 제제가 등장함에 따라 더 많은 치료법이 재택 치료로 전환될 가능성이 있습니다. 따라서 피하 투여(SC)의 보급 확대는 중증근무력증 치료제 시장의 수익 분배를 앞으로도 계속해서 변화시킬 것입니다.
지역별 분석
북미는 광범위한 보험 적용과 FDA의 획기적 치료제(Breakthrough Therapy) 지정을 받은 후 바이오 의약품의 급속한 보급에 힘입어 2025년 매출의 44.01%를 차지했습니다. 현재 발병률은 100만 명당 68.5명으로, 이는 지속적인 치료가 필요한 미국 성인이 약 8만 2,700명에 해당합니다. AI를 활용한 안구 운동 검사 및 원격 신경학 진료를 통해 전문의 진료 대기 병목 현상이 해소되고 조기 치료 시작이 촉진됨에 따라, 약물의 누적 노출량이 증가하고 있습니다. 2025년, 존슨앤드존슨이 니포칼리맙을 출시하면서 경쟁이 격화되고 가격 면에서의 긴장이 고조되었습니다. 이로 인해 연간 비용 상승폭이 억제되어 환자의 접근성 확대로 이어질 가능성이 있습니다.
유럽에서는 일관된 규제 환경이 조성되어 있으며, 2024년 1월에 로자놀릭시주맙이 승인되었고, 2025년 2월에는 피하 자가 투여가 승인되었습니다. 의료 기술 평가를 통해 정가 대비 20-30%의 할인이 보장되고 있지만, 실제 임상 데이터에서 스테로이드 감량 속도가 빨라지고 발작 빈도도 감소하고 있는 것으로 나타나고 있어, 희귀질환 치료제로서의 가치는 여전히 인정받고 있습니다. 치료법 선호도에 관한 조사에서 유럽 환자의 83%가 피하 투여를 선호하는 것으로 확인되었으며, 이를 통해 지불 기관은 정맥 주입 투여 예산을 의약품 구매로 전환할 수 있게 됩니다. 조건부 승인에는 시판 후 조사가 의무화되어 있어, 안전성의 투명성을 확보하는 동시에 데이터 수집 기간 동안의 수익 확보가 가능해집니다. 보체 억제제 바이오시밀러 개발 프로그램 증가는 추가적인 비용 절감을 가져와, 각국의 처방집에서 FcRn 제제의 보다 광범위한 채택을 재정적으로 뒷받침할 가능성이 있습니다.
아시아태평양은 연평균 성장률(CAGR) 9.46%로 가장 빠르게 성장하고 있으며, PMDA 및 NMPA의 심사가 현재 미국 승인보다 6개월 미만의 지연에 그치고 있다는 점이 이를 뒷받침하고 있습니다. 일본에서는 전신성 중증 근력 약화증 및 면역성 혈소판 감소증에 대해 에프갈티기모드(상품명 : VYVDURA)가 승인되었으며, 중국에서는 전신성 중증 근력 약화증(gMG) 및 만성 염증성 탈수초성 다발성 신경염(CIDP)에 대해 정맥 내 투여와 피하 투여가 모두 승인되었습니다. 이러한 진전에도 불구하고, 중국에서는 본인 부담 비용이 여전히 연간 가구 소득의 평균 40%를 차지하고 있어, 이로 인해 고가의 생물학적 제제 사용이 제한되고 있습니다. 원격 의료와 AI를 활용한 적외선 분광법을 통해 전문의 부족 문제가 해소되기 시작하고 있습니다. 헬스케어 인프라에 대한 지속적인 투자와 계획 중인 FcRn 바이오시밀러를 포함한 현지 생산 노력 덕분에, 향후 10년 동안 중증근무력증 치료제 시장에서 해당 지역의 기여도는 높아질 전망입니다.
기타 혜택 :
- 엑셀 형식 시장 예측(ME) 시트
- 3개월간 애널리스트 지원
자주 묻는 질문
목차
제1장 서론
제2장 조사 방법
제3장 주요 요약
제4장 시장 구도
제5장 시장 규모 및 성장 예측
제6장 경쟁 구도
제7장 시장 기회 및 향후 전망
AJY 26.08.26According to Mordor Intelligence, myasthenia gravis therapeutics market size in 2026 is estimated at USD 2.18 billion, growing from 2025 value of USD 2.02 billion with 2031 projections showing USD 3.17 billion, growing at 7.82% CAGR over 2026-2031.
This report is Segmented by Treatment (Medication, Rapid Immunotherapies [Intravenous Immunoglobulin and More], Gene & Cell Therapies and More), Route of Administration (Oral, Intravenous and More), Drug Class (Cholinesterase Inhibitors, Monoclonal Antibodies and More), End-User (Hospitals, Home-Care Settings and More) and Geography. The Market Forecasts are Provided in Terms of Value (USD).
Global Myasthenia Gravis Therapeutics Market Trends and Insights
Rising incidence & earlier diagnosis
Incidence rose to 68.5 new U.S. cases per million in 2024, reflecting growing awareness and improved insurance coverage for neuromuscular testing. In tertiary clinics, AI-assisted ocular-motor analytics can identify fatigue signatures in under 60 seconds and have been associated with reducing average diagnostic lag from 2.3 years to under 12 months. Early confirmation allows clinicians to initiate immune-modifying therapy sooner, and centers that achieve a sub-one-year diagnosis report 40% higher minimal manifestation rates at two-year follow-up. Broader tele-neurology access, coupled with payer incentives for prompt work-ups, continues to enlarge the myasthenia gravis therapeutics market patient pool.
Accelerated approvals of FcRn/complement biologics
Between 2023 and 2025, four breakthrough drugs-rozanolixizumab, zilucoplan, nipocalimab and SC efgartigimod-completed regulatory review in just 6-8 months under priority pathways. Condensed timelines shorten cash-burn periods, encouraging venture investors and fostering big-pharma deal activity. Parallel approvals in the EU, Japan and Australia allow near-simultaneous launches, accelerating global revenue capture during exclusivity windows. These dynamics add scale and depth to the myasthenia gravis therapeutics market and validate precision immunology as a core growth theme.
High biologic therapy cost
Annual FcRn inhibitor expenditure approximates USD 833,000, while cost-utility studies suggest prices must fall by up to 88% to meet willingness-to-pay thresholds in the United States and Europe. Budget caps trigger prior-authorization delays of four to six weeks, and emerging-market patients often default to steroids or plasmapheresis because of high co-payments. Wide affordability gaps therefore temper demand growth for the myasthenia gravis therapeutics market despite clinical superiority of novel agents.
Other drivers and restraints analyzed in the detailed report include:
- Rare-disease incentives & premium pricing
- SC biologics improving adherence
- Low disease awareness in emerging economies
For complete list of drivers and restraints, kindly check the Table Of Contents.
Segment Analysis
Gene and cell therapies are the fastest-growing treatment category at a 9.41% CAGR, though medication regimens still captured 68.74% of 2025 revenue. Early CAR-T case studies show Quantitative MG scores dropping from 21 to 5, sustaining muscle strength gains without ongoing immunosuppression. Telitacicept's 98.1% MG-ADL response in late-stage trials and CAART technology that selectively depletes pathogenic B cells reinforce growing confidence in curative approaches. Venture capital and disease-foundation grants provide critical funding, while regulators familiar with AAV vectors streamline IND reviews. As one-time interventions mature, the myasthenia gravis therapeutics market may shift toward front-loaded revenue, with chronic medication budgets gradually pivoting to post-treatment monitoring.
The existing medication segment remains sizeable because steroids, cholinesterase inhibitors and IVIg continue to manage mild or rapidly progressive episodes. Nonetheless, FcRn antagonists and complement inhibitors now enable steroid tapering in nearly half of patients, eroding dependence on broad immunosuppressants. Combination protocols blending biologics with targeted gene-editing may create hybrid models of care that preserve maintenance margins while unlocking durable remission for high-risk groups. Such innovation sustains revenue diversity in the myasthenia gravis therapeutics market and cushions drug makers against binary regulatory outcomes.
Subcutaneous administration is growing 9.85% annually and is poised to chip away at intravenous dominance, which accounted for 62.90% of revenue in 2025. EMA endorsement of self-injected rozanolixizumab and FDA clearance for Vyvgart Hytrulo prefilled syringes confirm the safety and efficacy of patient-controlled delivery. SC dosing can be completed in five minutes at home, compared with several-hour infusion visits, lifting adherence to 89% and driving switch-over among patients eager to reduce clinic time. Such convenience broadens the myasthenia gravis therapeutics market size by engaging rural residents and mobility-limited patients who previously skipped biologic therapy.
Technology partnerships, like argenx's USD 30 million expansion with Halozyme, target higher drug concentrations and smaller injection volumes, enhancing comfort and logistics. The shift frees infusion chairs for other specialties, a benefit valued by hospital administrators, and lowers payer facility costs. Oral formulations remain confined to legacy cholinesterase inhibitors and steroids, yet future extended-release or nanoparticle biologics could move additional therapies into home care. Broader SC penetration will therefore continue reshaping revenue allocation within the myasthenia gravis therapeutics market.
Complete Report Scope:
- By Treatment
- Medication
- Rapid Immunotherapies
- Intravenous Immunoglobulin (IVIg)
- Plasmapheresis
- Gene & Cell Therapies
- Other Emerging Therapies
- By Route of Administration
- Oral
- Intravenous
- Sub-cutaneous
- By Drug Class
- Cholinesterase Inhibitors
- Corticosteroids & Other Immunosuppressants
- Monoclonal Antibodies
- Complement Inhibitors
- FcRn Antagonists
- Others
- By End-User
- Hospitals
- Specialty Neurology Clinics
- Home-care Settings
- Ambulatory Surgical Centers
- By Geography
- North America
- United States
- Canada
- Mexico
- Europe
- Germany
- United Kingdom
- France
- Italy
- Spain
- Rest of Europe
- Asia-Pacific
- China
- Japan
- India
- Australia
- South Korea
- Rest of Asia-Pacific
- Middle East and Africa
- GCC
- South Africa
- Rest of Middle East and Africa
- South America
- Brazil
- Argentina
- Rest of South America
- North America
Geography Analysis
North America generated 44.01% of 2025 revenue, underpinned by broad insurance coverage and rapid biologic uptake following FDA breakthrough designations. Incidence now sits at 68.5 per million, equating to roughly 82,700 U.S. adults needing ongoing therapy. AI-enabled ocular-motor testing and tele-neurology reduce specialist bottlenecks, promoting early starts that heighten cumulative drug exposure. Competitive intensity rose in 2025 when Johnson & Johnson launched nipocalimab, adding price tension that may widen patient access by tempering annual cost escalators.
Europe follows with a cohesive regulatory environment that approved rozanolixizumab in January 2024 and SC self-administration in February 2025. Health-technology assessments secure 20-30% list-price discounts, yet still recognise orphan-drug value where real-world data show faster steroid tapering and fewer crises. Preference studies confirm 83% of European patients favor SC dosing, letting payers reallocate infusion budgets to drug acquisition. Conditional approvals require post-market surveillance, ensuring safety transparency while allowing income flow during data collection. Rising biosimilar programs for complement inhibitors could generate additional savings, potentially funding broader FcRn adoption across national formularies.
Asia-Pacific is the fastest-growing region at a 9.46% CAGR, buoyed by PMDA and NMPA reviews that now lag U.S. clearances by less than six months. Japan approved efgartigimod as VYVDURA for generalized myasthenia gravis and immune thrombocytopenia, while China authorised both IV and SC forms for gMG and CIDP. Despite these gains, out-of-pocket costs still average 40% of annual household income in China, which caps utilisation for high-priced biologics. Telemedicine and AI-based infrared spectroscopy are beginning to close specialist gaps. Continued healthcare-infrastructure investment and local manufacturing initiatives, including planned FcRn biosimilars, should lift the regional contribution to the myasthenia gravis therapeutics market over the next decade.
- AstraZeneca
- argenx SE
- UCB
- Johnson & Johnson
- Novartis
- Mitsubishi Tanabe Pharma
- CSL Behring
- Horizon Therapeutics
- Immunovant Inc.
- Regeneron Pharmaceuticals
- Roche
- Takeda Pharmaceuticals
- Astellas Pharma
- Pfizer
- CuraVac N.V.
- Chugai Pharmaceutical
- Abbvie
- Grifols
- Bausch Health
Additional Benefits:
- The market estimate (ME) sheet in Excel format
- 3 months of analyst support
TABLE OF CONTENTS
1 Introduction
- 1.1 Study Assumptions and Market Definition
- 1.2 Scope of the Study
2 Research Methodology
3 Executive Summary
4 Market Landscape
- 4.1 Market Overview
- 4.2 Market Drivers
- 4.2.1 Rising Incidence & Earlier Diagnosis Of MG
- 4.2.2 Accelerating Approvals Of Complement- & FcRn-Targeted Biologics
- 4.2.3 Rare-Disease Incentives & Premium Pricing Leverage
- 4.2.4 Robust Clinical-Trial Pipeline Driven By Venture/Big-Pharma Deals
- 4.2.5 Self-Administered SC Biologics Improving Adherence
- 4.2.6 AI-Based Electromyography Analytics Enabling Earlier Intervention
- 4.3 Market Restraints
- 4.3.1 High Cost Of Long-Term Biologic Therapy
- 4.3.2 Low Disease Awareness In Emerging Economies
- 4.3.3 Cold-Chain & Assay QA Complexity For mAbs
- 4.3.4 Price-Erosion Risk Post-Soliris LOE & Biosimilar Entry
- 4.4 Value / Supply-Chain Analysis
- 4.5 Regulatory Landscape
- 4.6 Technology Outlook
- 4.7 Porter's Five Forces Analysis
- 4.7.1 Bargaining Power of Suppliers
- 4.7.2 Bargaining Power of Buyers
- 4.7.3 Threat of New Entrants
- 4.7.4 Threat of Substitutes
- 4.7.5 Intensity of Competitive Rivalry
5 Market Size and Growth Forecasts (Value-USD)
- 5.1 By Treatment
- 5.1.1 Medication
- 5.1.2 Rapid Immunotherapies
- 5.1.2.1 Intravenous Immunoglobulin (IVIg)
- 5.1.2.2 Plasmapheresis
- 5.1.3 Gene & Cell Therapies
- 5.1.4 Other Emerging Therapies
- 5.2 By Route of Administration
- 5.2.1 Oral
- 5.2.2 Intravenous
- 5.2.3 Sub-cutaneous
- 5.3 By Drug Class
- 5.3.1 Cholinesterase Inhibitors
- 5.3.2 Corticosteroids & Other Immunosuppressants
- 5.3.3 Monoclonal Antibodies
- 5.3.4 Complement Inhibitors
- 5.3.5 FcRn Antagonists
- 5.3.6 Others
- 5.4 By End-User
- 5.4.1 Hospitals
- 5.4.2 Specialty Neurology Clinics
- 5.4.3 Home-care Settings
- 5.4.4 Ambulatory Surgical Centers
- 5.5 By Geography
- 5.5.1 North America
- 5.5.1.1 United States
- 5.5.1.2 Canada
- 5.5.1.3 Mexico
- 5.5.2 Europe
- 5.5.2.1 Germany
- 5.5.2.2 United Kingdom
- 5.5.2.3 France
- 5.5.2.4 Italy
- 5.5.2.5 Spain
- 5.5.2.6 Rest of Europe
- 5.5.3 Asia-Pacific
- 5.5.3.1 China
- 5.5.3.2 Japan
- 5.5.3.3 India
- 5.5.3.4 Australia
- 5.5.3.5 South Korea
- 5.5.3.6 Rest of Asia-Pacific
- 5.5.4 Middle East and Africa
- 5.5.4.1 GCC
- 5.5.4.2 South Africa
- 5.5.4.3 Rest of Middle East and Africa
- 5.5.5 South America
- 5.5.5.1 Brazil
- 5.5.5.2 Argentina
- 5.5.5.3 Rest of South America
- 5.5.1 North America
6 Competitive Landscape
- 6.1 Market Concentration
- 6.2 Market Share Analysis
- 6.3 Company Profiles (includes Global level Overview, Market level overview, Core Segments, Financials as available, Strategic Information, Market Rank/Share for key companies, Products and Services, and Recent Developments)
- 6.3.1 AstraZeneca
- 6.3.2 argenx SE
- 6.3.3 UCB Pharma
- 6.3.4 Johnson & Johnson (Janssen)
- 6.3.5 Novartis AG
- 6.3.6 Mitsubishi Tanabe Pharma
- 6.3.7 CSL Behring
- 6.3.8 Horizon Therapeutics
- 6.3.9 Immunovant Inc.
- 6.3.10 Regeneron Pharmaceuticals
- 6.3.11 F. Hoffmann-La Roche Ltd
- 6.3.12 Takeda Pharmaceutical
- 6.3.13 Astellas Pharma
- 6.3.14 Pfizer Inc.
- 6.3.15 CuraVac N.V.
- 6.3.16 Chugai Pharmaceutical
- 6.3.17 AbbVie Inc.
- 6.3.18 Grifols S.A.
- 6.3.19 Bausch Health
7 Market Opportunities & Future Outlook
- 7.1 White-space & unmet-need assessment