

|
시장보고서
상품코드
2115214
터미널 트랙터 시장 : 점유율 분석, 업계 동향과 통계, 성장 예측(2026-2031년)Terminal Tractor - Market Share Analysis, Industry Trends & Statistics, Growth Forecasts (2026 - 2031) |
||||||
 Mordor Intelligence
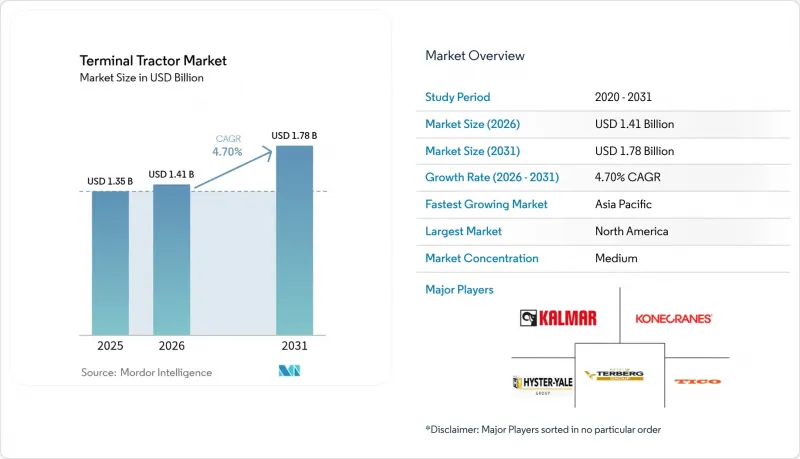
Mordor Intelligence에 의하면, 2026년 터미널 트랙터 시장 규모는 14억 1,000만 달러로 추정되고 있어 2025년 13억 5,000만 달러에서 확대해, 2031년에는 17억 8,000만 달러에 이를 것으로 예측됩니다.
2026년부터 2031년까지 연평균 성장률(CAGR) 4.7%로 성장할 것으로 전망됩니다.
본 보고서는 연료 유형(디젤, 하이브리드 등), 차량 유형(수동, 반자동 등), 구동 방식(4x2, 4x4 등), 적재 톤수(50톤 미만 등), 최종 이용 산업(식품 및 음료 등) 및 지역별로 분류되어 있습니다. 시장 규모 및 전망은 금액(달러) 기준으로 제시되어 있습니다.
세계 터미널 트랙터 시장 동향 및 인사이트
전자상거래로 인한 트레일러 교체 가속화가 터미널 트랙터의 교체 주기를 앞당기고 있습니다.
온라인 소매 물량의 급증으로 인해 북미의 메가 풀필먼트 센터에서는 기존 소매 허브에 비해 2.77배 빠른 속도로 트레일러 이동 처리가 이루어지고 있으며, 이러한 변화로 가동률이 향상되고 차량 교체가 가속화되고 있습니다. 전기 모델은 디젤 차량에 비해 유지비가 60-75% 저렴하여 지지를 얻고 있으며, 이를 통해 사업자는 장시간의 정비 중단 없이 24시간 운영을 유지할 수 있게 되었습니다. 현재 차량 관리자들은 24시간 365일 이어지는 교통 피크에 대응하기 위해 내구성이 뛰어난 프레임, 강화된 구동계 부품 및 스마트 야드 관리 소프트웨어를 사양으로 지정하고 있습니다. 그 결과 가동률이 비약적으로 향상되고 고가 차량도 경제적으로 수익성을 확보할 수 있게 되어, 터미널 트랙터 시장에서 대체 구동 방식으로의 전환이 더욱 가속화되고 있습니다. 유럽의 우편 배달 허브에서도 유사한 경향이 나타나고 있어, 이러한 움직임이 지리적으로 확산되고 있음을 시사합니다.
엄격한 IMO 및 CARB 배기가스 규제가 전동 야드 트럭 도입을 촉진
캘리포니아주의 ‘2025년 이동 발생원 전략’에서는 2026년까지 화물 취급 장비에서 발생하는 NOx 배출량을 90%, 디젤 미립자 물질을 80% 감축할 것을 의무화하고 있습니다. 이와 유사한 목표가 IMO의 2023년 탈탄소화 전략에도 포함되어 있어, 전 세계 항만에서 디젤 차량의 전면적인 교체가 시급한 상황입니다. 규제 준수 기한이 다가오는 가운데, 전기식 터미널 트랙터는 부두 크레인이나 육상 전원 공급 장치로의 개조에 비해 인프라 교체가 크게 필요하지 않기 때문에 단기적인 해결책이 됩니다. 롱비치 항구에서는 사상 최대의 컨테이너 처리량을 유지하면서 제로 에미션 야드 트럭을 도입하여, 높은 처리량 환경에서도 실현 가능함을 입증하고 있습니다. 이러한 규제로 인해 의사 결정 유예 기간이 단축되면서, 조달 팀은 구매 가격이 비싸더라도 배터리식 전기 모델을 채택할 수밖에 없게 되었고, 이는 터미널 트랙터 시장 전체의 급속한 성장을 가속하고 있습니다.
디젤 차량에 비해 높은 BEV/FC 터미널 트랙터의 초기 설비 투자(CAPEX)
배터리식 야드 트럭의 가격은 275,000-35만 달러로, 디젤 차량의 100,000-12만 5,000달러에 비해 약 3배에 달할 전망입니다. 이로 인해 인센티브가 없고 이용 빈도가 낮은 차량군의 경우, 투자 회수 기간이 5년을 초과하게 됩니다. 수소 연료전지 모델은 특수 주문 부품으로 인해 정가가 250-300% 더 비싸기 때문에 더욱 큰 장벽에 직면해 있습니다. 소규모 물류 사업자의 경우, 특히 보조금 제도가 없는 국가에서는 3-5년의 교체 주기에 상응하는 자금 조달을 확보하기 어렵습니다. 연간 가동 시간이 5,000시간을 초과하는 경우, 총 소유 비용의 추세는 현재 전기차에 유리하게 기울고 있지만, 높은 초기 비용이 여전히 잠재 수요를 억누르고 있어 터미널 트랙터 시장 전체의 발전을 둔화시키고 있습니다.
부문 분석
2025년, 디젤 기술은 광범위한 도입 실적과 낮은 취득 비용을 바탕으로 터미널 트랙터 시장에서 62.65%의 점유율을 차지했습니다. 그러나 규제 압력이 높아지고 배터리 가격이 하락함에 따라, 전기차 모델은 2026년부터 2031년까지 연평균 성장률(CAGR) 17.6%를 나타낼 것으로 예측됩니다. 캘리포니아주, 브리티시컬럼비아주, 광둥성에서의 조기 도입 사례에서는 높은 구매 가격을 4년간의 가동 기간 내에 상쇄할 정도의 유지보수 비용 절감 효과가 보고되었습니다. 하이브리드 차량 및 CNG/LNG 모델은 연료의 입수 가능성 및 가동 주기의 특성으로 인해 유연한 추진 방식이 요구되는 특정 규제 대응 범위를 충족하고 있습니다. 수소 연료전지 프로토타입은 현재 한 자릿수 초반의 소량 생산에 그치고 있지만, 주행 거리 및 한랭지 내구성이 전략적으로 중요시됨에 따라 EU로부터 자금 지원을 받고 있습니다. 터미널 트랙터 시장 전체에서 추진 시스템의 선택은 항만별 탄소 배출 목표, 전기 요금 및 인센티브의 조합에 점점 더 좌우되고 있으며, 지역별로 다른 도입 곡선이 더욱 뚜렷해지고 있습니다.
전기자동차의 보급률은 부품 공급 및 재판매 동향에도 영향을 미치고 있습니다. 각 OEM 업체들은 구매자의 라이프사이클 비용 리스크를 완화하기 위해 배터리 보증, 텔레매틱스, 예방 정비 계약을 세트로 제공합니다. 디젤 배기가스 처리 시스템이 복잡해짐에 따라 후처리와 관련된 가동 중단 시간이 운영 리스크를 증가시키고 있으며, 이는 배터리식 전기차에 대한 선호를 더욱 부추기고 있습니다. 따라서 향후 5년 동안은 디젤의 점유율이 하락하는 한편, 견고한 송전망 용량을 갖추지 못한 신흥 경제국에서는 여전히 중요한 위치를 차지할 것이라는 점진적인 변화가 예상되며, 적어도 2030년까지는 전 세계 차량 군이 이중 추진 방식을 유지할 것으로 보입니다.
2025년에도 터미널 트랙터 시장 점유율의 74.55%를 수동식 트랙터가 차지했습니다. 이는 많은 야드에서 교통 상황이 복잡하게 얽힌 시나리오에서 여전히 인간의 판단이 요구되기 때문입니다. 그러나 연평균 성장률(CAGR) 21.2%로 증가하고 있는 자율 주행형 유닛은 인건비를 절감하고 가동 시간을 연장함으로써 운영 경제성을 재구축하고 있습니다. 관리된 환경, 컨테이너 적재 셔틀, 자동차 차량 기지, 그리고 삼엄한 경비가 이루어지는 항공 화물 에이프런은 지오펜싱을 통해 예측 가능한 경로가 확보되는 이상적인 시험장이 되고 있습니다. 터미널 트랙터 시장에는 현재 로봇 공학 및 AI 분야의 신규 진출기업인 Forterra나 FERNRIDE 등이 진출해 있으며, 이들은 OEM 섀시에 후장착 가능한 드라이브-바이-와이어 키트와 원격 조작 플랫폼을 공급하고 있습니다. 기존 제조업체들은 출고 시 미리 내장된 자율 주행 인터페이스로 이에 대응하며, 통합 주기를 단축하고 있습니다.
도입 속도는 인력 확보 상황 및 현지 규제의 명확성과 밀접한 관련이 있습니다. FERNRIDE가 2025년에 취득한 유럽 기계 지침 인증은 EU 회원국 전체에서 도입을 가속화할 가능성이 있는 조화로운 프레임워크를 제공합니다. 북미의 각 OEM 업체들은 모듈식 업그레이드에 주력하고 있으며, 이를 통해 차량 군은 감시 모드와 무인 모드 사이를 유연하게 전환할 수 있게 됩니다. AI 지각 스택이 성숙해짐에 따라 비용 곡선은 하락 추세를 보이며, 소규모 터미널에서도 기존 예상보다 빠르게 자율 주행을 도입할 수 있게 될 것입니다. 이러한 추세로 인해 2020년대 후반까지는 자율 주행 기능이 주류 표준 사양으로 자리 잡게 될 것입니다.
지역별 분석
2025년, 북미는 터미널 트랙터 시장 매출의 36.30%를 차지했습니다. 이는 멕시코만 연안 및 서부 해안의 방대한 항만 처리 능력과 적극적인 제로 배출 규제에 힘입은 결과입니다. 캘리포니아주가 조기 도입을 주도하고 있지만, 캐나다에서도 프린스 루퍼트와 밴쿠버가 태평양 무역의 우회 노선을 흡수하기 위해 터미널 수심을 깊게 함에 따라 조달 규모가 확대되고 있습니다. 이 지역에서는 오로라 이노베이션(Aurora Innovation)사의 고속도로 플래토닝 알고리즘이 야드 자동화 플랫폼에 상호 활용되는 등 소프트웨어의 급속한 보급이 관찰되고 있어, 자율 주행의 또 다른 물결이 다가오고 있음을 예감하게 합니다. 다만, 전력 가격 변동은 도입 속도에 영향을 미치고 있습니다. 텍사스주와 조지아주 전력 회사는 배터리식 전기 트럭으로의 전환을 촉진하기 위해 산업용 우대 요금을 도입하고 있습니다.
아시아태평양은 중국의 스마트 항만 투자와 인도의 ‘가티샤크티’ 인프라 추진 정책에 힘입어 2031년까지 연평균 성장률(CAGR) 6.9%를 기록하며, 이 지역 내에서 가장 빠른 성장세를 보이고 있습니다. 광저우항은 최근 무인 운반차(IGV) 보유 대수를 158대로 확대하며, 자동화 분야에서 정부 주도의 규모 확대를 여실히 보여주고 있습니다. 일본과 한국에서는 높은 전기 요금을 상쇄하기 위해 하이브리드 전동화 모델로의 전환이 진행되고 있습니다. 한편, 동남아시아의 경제 회랑-태국의 ‘동부 경제 회랑’이나 베트남의 ‘카이멩 클러스터’-에서는 기존 시설의 개보수 프로그램이 아닌, 주로 신설 터미널을 위한 트랙터가 발주되고 있으며, 각 OEM 업체들에게는 그린필드 프로젝트에서 사양에 대한 유연성이 부여되고 있습니다.
유럽에서는 EU 그린딜에 따른 통일된 인센티브를 통해 저탄소 추진 시스템의 도입이 계속해서 높은 수준을 유지하고 있으며, 빌헬름스하펜과 로테르담은 연료전지 시범 사업의 거점으로 자리 잡고 있습니다. 북유럽 국가들은 수력 발전에서 생산된 전력을 활용하여 전체 수명 주기에 걸친 배출량 감축을 실현하고, 전천후 사륜구동 전기 차량 도입을 위한 기반을 마련하고 있습니다. 폴란드의 그단스크를 필두로 한 중동유럽의 허브에서는 발트해 지역의 환적 화물을 확보하기 위해 중복성 확보에 대한 투자가 진행되고 있으며, 이에 따른 수요가 확대되고 있습니다. 한편, 중동 및 아프리카에서는 사우디아라비아의 제다 항과 남아프리카공화국의 더반 항 확장을 위한 투자가 가속화되고 있으며, 이러한 허브들이 용량 제약이 있는 수에즈 항로로부터 환적 점유율을 터미널 트랙터 시장 전체에서 확보하려는 가운데 새로운 기회가 부각되고 있습니다.
기타 혜택:
- 엑셀 형식 시장 예측(ME) 시트
- 3개월간의 애널리스트 지원
자주 묻는 질문
목차
제1장 서론
제2장 조사 방법
제3장 주요 요약
제4장 시장 구도
제5장 시장 규모와 성장 예측
제6장 경쟁 구도
제7장 시장 기회와 향후 전망
JHS 26.08.26According to Mordor Intelligence, terminal tractor market size in 2026 is estimated at USD 1.41 billion, growing from 2025 value of USD 1.35 billion with 2031 projections showing USD 1.78 billion, growing at 4.7% CAGR over 2026-2031.
This report is Segmented by Fuel Type (Diesel, Hybrid and More), Vehicle Type (Manual, Semi-Automated and More), Drive Configuration (4x2, 4x4 and More), Tonnage Capacity (Less Than 50 Ton and More), End-Use Industry (Food and Beverages, and More), and by Geography. The Market Sizes and Forecasts are Provided in Terms of Value (USD).
Global Terminal Tractor Market Trends and Insights
E-Commerce-Driven Trailer Turnover Escalating Terminal Tractor Cycles
Surging online retail volumes push North American mega-fulfillment centers to process trailer moves at 2.77 times the pace seen in legacy retail hubs, a shift that elevates duty cycles and hastens fleet replacement. Electric models gain favor because their maintenance expense runs 60-75% lower than diesel equivalents , letting operators sustain round-the-clock shifts without lengthy service breaks. Fleet managers now specify high-durability frames, reinforced driveline components, and smart yard management software to handle 24/7 traffic peaks. The resulting jump in utilization makes premium-priced units financially viable, thereby reinforcing the ongoing migration toward alternative propulsion in the terminal tractor market. Comparable patterns emerge in European postal distribution hubs, signaling a broadening geographic ripple.
Stringent IMO & CARB Emission Mandates Catalyzing Electric Yard Truck Adoption
California's 2025 Mobile Source Strategy enforces a 90% cut in NOx and an 80% cut in diesel particulate matter from cargo-handling equipment by 2026. Similar targets appear in the IMO 2023 decarbonization strategy, pressuring global ports to overhaul diesel fleets. With compliance deadlines looming, electric terminal tractors offer a near-term pathway because they require less infrastructural overhaul than quay cranes or shore-power retrofits. The Port of Long Beach integrates zero-emission yard trucks while still processing record container volumes, demonstrating feasibility under high-throughput conditions . These regulations compress decision windows, pushing procurement teams to lock in battery-electric models despite higher purchase prices, driving measurable expansion across the terminal tractor market.
High up-front CAPEX of BEV/FC terminal tractors vs. diesel equivalents
Battery-electric yard trucks list between USD 275,000-350,000, nearly triple a diesel unit's USD 100,000-125,000 cost, which stretches payback beyond five years in moderate-utilization fleets lacking incentives. Hydrogen fuel-cell models face an even steeper hurdle as bespoke components keep sticker prices 250-300% higher. Smaller logistics providers struggle to secure financing that matches 3-5 year replacement cycles , especially in countries without subsidy schemes. Although total cost of ownership trends now tilt in favor of electric when annual hours exceed 5,000, upfront sticker shock continues to trim addressable demand, tempering overall progress in the terminal tractor market.
Other drivers and restraints analyzed in the detailed report include:
- Green Hydrogen Pilots In EU Ports Enabling Fuel-Cell Terminal Tractors
- Rise Of Rental-Model Warehousing In India Accelerating Short-Tenure Tractor Leasing
- Fragmented power infrastructure at brownfield ports delaying fast-charge roll-out
For complete list of drivers and restraints, kindly check the Table Of Contents.
Segment Analysis
Diesel technology accounted for a 62.65% terminal tractor market share in 2025, anchored by its extensive installed base and lower acquisition cost. Electric models, however, are projected to post an 17.6% CAGR from 2026-2031 as regulatory pressure stiffens and battery pricing eases. Early adopters in California, British Columbia, and Guangdong report maintenance savings that counterbalance higher purchase prices within four operating years. Hybrid and CNG/LNG variants fill specific compliance windows where fuel availability or duty cycle characteristics favor flexible propulsion. Hydrogen fuel-cell prototypes, though representing low single-digit volumes today, attract EU funding as range and cold-weather resilience gain strategic weight. Across the terminal tractor market, propulsion choice is increasingly bound to port-specific carbon targets, electricity tariffs, and incentive stacks, reinforcing a regionally divergent adoption curve.
Electric penetration also influences parts supply and resale dynamics. OEMs bundle battery warranties, telematics, and preventive maintenance contracts to de-risk lifetime costs for buyers. As diesel emission systems grow more complex, downtime linked to after-treatment adds operating risk that further tips preference toward battery-electric. The coming half-decade therefore signals a progressive shift where diesel's share declines but remains material in emerging economies without robust grid capacity, keeping the global fleet in a dual-propulsion state through at least 2030.
Manual tractors retained 74.55% of the terminal tractor market share in 2025 because many yards still demand human judgment in mixed-traffic scenarios. Yet autonomous units, rising at a 21.2% CAGR, re-shape operational economics by cutting labor costs and extending duty hours. Controlled environments, container stack shuttles, automotive marshalling yards, and high-security air cargo aprons offer ideal testbeds where geo-fencing ensures predictable routes. The terminal tractor market now hosts new entrants from robotics and AI, including Forterra and FERNRIDE, who supply drive-by-wire kits and remote-teleoperation platforms that retrofit OEM chassis. Traditional manufacturers answer with factory-ready autonomy interfaces, shortening integration cycles.
Roll-out speed links tightly to labor availability and local regulatory clarity. European Machinery Directive certification, achieved by FERNRIDE in 2025, provides a harmonized framework likely to accelerate deployments across EU member states. North American OEMs focus on modular upgrades, allowing fleets to shift between supervised and unsupervised modes. As AI perception stacks mature, cost curves bend downward, enabling smaller terminals to adopt autonomy sooner than previously expected. That trajectory cements self-driving functionality as a mainstream spec line-item by the late 2020s.
Complete Report Scope:
- By Propulsion Type
- Diesel
- Hybrid
- Electric (BEV)
- CNG / LNG
- Hydrogen Fuel-Cell
- By Vehicle Type
- Manual
- Semi-Automated
- Fully Autonomous
- By Drive Configuration
- 4x2
- 4x4
- 6x4
- By Tonnage Capacity
- Less than 50 Ton
- 50-100 Ton
- Greater than 100 Ton
- By End-Use Industry
- Retail & E-commerce 3PL
- Food & Beverages
- Heavy Industry & Manufacturing
- Automotive OEM Yards
- Marine Ports Industry
- Oil and Gas Industry
- Logistics Industry
- Others (Rail Logistics Yards, etc.)
- By Geography
- North America
- United States
- Canada
- Rest of North America
- South America
- Brazil
- Argentina
- Rest of South America
- Europe
- Germany
- United Kingdom
- France
- Italy
- Spain
- Russia
- Rest of Europe
- Asia-Pacific
- China
- India
- Japan
- South Korea
- Indonesia
- Vietnam
- Philippines
- Australia
- New Zealand
- Rest of Asia-Pacific
- Middle East and Africa
- Saudi Arabia
- United Arab Emirates
- Turkey
- South Africa
- Nigeria
- Egypt
- Rest of Middle East and Africa
- North America
Geography Analysis
North America represented 36.30% of the terminal tractor market revenue in 2025, anchored by extensive Gulf and West Coast port capacity and aggressive zero-emission rules. California drives early adoption, but Canada scales procurement as Prince Rupert and Vancouver deepen terminals to absorb Pacific trade diversions. The region demonstrates rapid software uptake as Aurora Innovation's highway platooning algorithms cross-pollinate into yard automation platforms, foreshadowing a broader autonomy wave. Electricity pricing variability nonetheless affects rollout speed; utilities in Texas and Georgia deploy preferential industrial tariffs to lure battery-electric conversions.
Asia-Pacific logs the fastest regional expansion at a 6.9% CAGR through 2031, buoyed by Chinese smart-port funding and India's GatiShakti infrastructure drive. Guangzhou Port recently expanded its intelligent guided vehicle fleet to 158 units, illustrating state-backed scale on automation. Japan and South Korea mature toward hybrid electrification models to offset high electricity tariffs, while Southeast Asian corridors-Thailand's Eastern Economic Corridor and Vietnam's Cai Mep cluster-order tractors primarily for new-build terminals rather than retrofit programs, giving OEMs greenfield specification flexibility.
Europe sustains high adoption of low-carbon propulsion through harmonized EU Green Deal incentives, making it a launchpad for fuel-cell pilots at Wilhelmshaven and Rotterdam. Nordic countries pave the road for all-weather 4x4 electric fleets, leveraging hydropower-sourced electricity to claim lifecycle emission savings. Central and Eastern European hubs, led by Poland's Gdansk, invest in redundancy to capture Baltic trans-shipment traffic, expanding addressable demand. Elsewhere, the Middle East and Africa witness stepped-up investment in Saudi Arabia's Jeddah port and South Africa's Durban expansion, revealing fresh opportunities as these hubs chase trans-shipment share from capacity-constrained Suez routes across the terminal tractor market.
- Kalmar (Cargotec Corp.)
- Konecranes Inc.
- Terberg Group BV
- TICO Tractors
- Mafi Transport-Systeme GmbH
- Sany Heavy Industry Co. Ltd.
- Volvo AB
- Mol CY nv
- BYD Auto Co. Ltd.
- Orange EV
- Hoist Liftruck Mfg.
- Trelleborg AB (Yard Systems)
- Autocar LLC
Additional Benefits:
- The market estimate (ME) sheet in Excel format
- 3 months of analyst support
TABLE OF CONTENTS
1 Introduction
- 1.1 Study Assumptions & Market Definition
- 1.2 Scope of the Study
2 Research Methodology
3 Executive Summary
4 Market Landscape
- 4.1 Market Overview
- 4.2 Market Drivers
- 4.2.1 E-commerce-Driven Trailer Turnover Escalating Terminal Tractor Cycles (North America)
- 4.2.2 Stringent IMO & CARB Emission Mandates Catalyzing Electric Yard Truck Adoption (Ports)
- 4.2.3 Green Hydrogen Pilots in EU Ports Enabling Fuel-Cell Terminal Tractors
- 4.2.4 Rise of Rental-Model Warehousing in India Accelerating Short-Tenure Tractor Leasing
- 4.2.5 4x4 Drive Demand From Intermodal Rail Yards in Nordics Boosting Premium Tractor Sales
- 4.2.6 AI-Enabled Fleet Optimization Software Increasing Utilization Rates & Replacement Cycles
- 4.3 Market Restraints
- 4.3.1 High Up-Front Capex of BEV/FC Terminal Tractors vs. Diesel Equivalents
- 4.3.2 Fragmented Power Infrastructure at Brownfield Ports Delaying Fast-Charge Roll-out
- 4.3.3 Volatile Battery-Grade Nickel & Lithium Prices Inflating TCO Forecasts
- 4.3.4 Limited Skilled Technicians for Autonomous Tractor Maintenance in Emerging Markets
- 4.4 Porter's Five Forces Analysis
- 4.4.1 Bargaining Power of Buyers
- 4.4.2 Bargaining Power of Suppliers
- 4.4.3 Threat of New Entrants
- 4.4.4 Threat of Substitute Products
- 4.4.5 Intensity of Competitive Rivalry
5 Market Size & Growth Forecasts (Value)
- 5.1 By Propulsion Type
- 5.1.1 Diesel
- 5.1.2 Hybrid
- 5.1.3 Electric (BEV)
- 5.1.4 CNG / LNG
- 5.1.5 Hydrogen Fuel-Cell
- 5.2 By Vehicle Type
- 5.2.1 Manual
- 5.2.2 Semi-Automated
- 5.2.3 Fully Autonomous
- 5.3 By Drive Configuration
- 5.3.1 4x2
- 5.3.2 4x4
- 5.3.3 6x4
- 5.4 By Tonnage Capacity
- 5.4.1 Less than 50 Ton
- 5.4.2 50-100 Ton
- 5.4.3 Greater than 100 Ton
- 5.5 By End-Use Industry
- 5.5.1 Retail & E-commerce 3PL
- 5.5.2 Food & Beverages
- 5.5.3 Heavy Industry & Manufacturing
- 5.5.4 Automotive OEM Yards
- 5.5.5 Marine Ports Industry
- 5.5.6 Oil and Gas Industry
- 5.5.7 Logistics Industry
- 5.5.8 Others (Rail Logistics Yards, etc.)
- 5.6 By Geography
- 5.6.1 North America
- 5.6.1.1 United States
- 5.6.1.2 Canada
- 5.6.1.3 Rest of North America
- 5.6.2 South America
- 5.6.2.1 Brazil
- 5.6.2.2 Argentina
- 5.6.2.3 Rest of South America
- 5.6.3 Europe
- 5.6.3.1 Germany
- 5.6.3.2 United Kingdom
- 5.6.3.3 France
- 5.6.3.4 Italy
- 5.6.3.5 Spain
- 5.6.3.6 Russia
- 5.6.3.7 Rest of Europe
- 5.6.4 Asia-Pacific
- 5.6.4.1 China
- 5.6.4.2 India
- 5.6.4.3 Japan
- 5.6.4.4 South Korea
- 5.6.4.5 Indonesia
- 5.6.4.6 Vietnam
- 5.6.4.7 Philippines
- 5.6.4.8 Australia
- 5.6.4.9 New Zealand
- 5.6.4.10 Rest of Asia-Pacific
- 5.6.5 Middle East and Africa
- 5.6.5.1 Saudi Arabia
- 5.6.5.2 United Arab Emirates
- 5.6.5.3 Turkey
- 5.6.5.4 South Africa
- 5.6.5.5 Nigeria
- 5.6.5.6 Egypt
- 5.6.5.7 Rest of Middle East and Africa
- 5.6.1 North America
6 Competitive Landscape
- 6.1 Market Concentration
- 6.2 Strategic Moves
- 6.3 Market Share Analysis
- 6.4 Company Profiles {(includes Global level Overview, Market level overview, Core Segments, Financials as available, Strategic Information, Market Rank/Share for key companies, Products & Services, and Recent Developments)}
- 6.4.1 Kalmar (Cargotec Corp.)
- 6.4.2 Konecranes Inc.
- 6.4.3 Terberg Group BV
- 6.4.4 TICO Tractors
- 6.4.5 Mafi Transport-Systeme GmbH
- 6.4.6 Sany Heavy Industry Co. Ltd.
- 6.4.7 Volvo AB
- 6.4.8 Mol CY nv
- 6.4.9 BYD Auto Co. Ltd.
- 6.4.10 Orange EV
- 6.4.11 Hoist Liftruck Mfg.
- 6.4.12 Trelleborg AB (Yard Systems)
- 6.4.13 Autocar LLC
7 Market Opportunities & Future Outlook
- 7.1 White-space & Unmet-need Assessment


