

|
시장보고서
상품코드
2115253
바이오 기반 폴리염화비닐 시장 : 시장 점유율 분석, 업계 동향 및 통계, 성장 예측(2026-2031년)Bio-Based Polyvinyl Chloride - Market Share Analysis, Industry Trends & Statistics, Growth Forecasts (2026 - 2031) |
||||||
 Mordor Intelligence
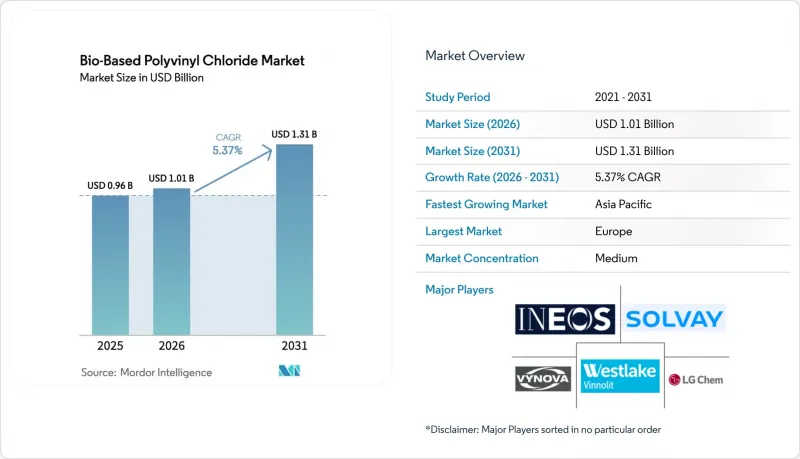
Mordor Intelligence에 의하면, 바이오 기반 폴리염화비닐(Bio-PVC) 시장 규모는 2025년 9억 6,000만 달러로 평가되었고, 2026년에는 10억 1,000만 달러로 추정되고, 2026-2031년 CAGR 5.37%로 성장을 지속할 전망이며, 2031년에는 13억 1,000만 달러에 이를 것으로 예측됩니다.
본 보고서는 제품 유형별(경질 바이오 PVC 및 연질 바이오 PVC), 용도별(파이프, 와이어, 케이블, 필름 및 시트, 기타), 최종 사용자 산업별(건축 및 건설, 운송·포장, 전기 및 전자기기, 기타), 지역별(아시아태평양, 북미, 유럽, 기타)로 분류되어 있습니다. 시장 전망은 금액(달러) 기준으로 제시되어 있습니다.
세계의 바이오 기반 폴리염화비닐(PVC) 시장 동향 및 인사이트
환경 규제 강화 및 ESG 요건
EU의 탄소 국경 조정 메커니즘은 2023년 후반에 이행 단계에 접어들고, 2026년부터는 내재된 탄소량에 따른 관세가 전면적으로 적용되어 2028년까지 고탄소 PVC의 수입 비용이 상승할 것입니다. 캘리포니아주의 SB 253 및 SB 261에 따르면, 2024년부터 스코프 3 공개가 의무화되어 건축 및 자동차 산업의 구매 담당자들은 폴리머의 원산지를 감사해야 합니다. Teknor Apex는 2025년에 탄소 발자국이 검증된 바이오 유래 컴파운드를 요구하는 유럽의 바닥재 고객이 증가하고 있다고 지적했습니다. 이러한 규제의 통합으로 인해 가격 프리미엄이 있음에도 불구하고 인증된 바이오 PVC에 대한 조달 경향이 강해지고 있습니다. 카스토디 체인 준수를 입증할 수 있는 제조업체는 규제 대상 입찰에서 우선 공급업체로서의 지위를 확보하고 있습니다.
기업의 지속가능성 노력과 그린빌딩 기준
2026년에 전면 도입될 LEED v5에서는 ISO 16620에 따라 검증된 바이오 함량에 대해 추가 점수가 부여되며, 골드 또는 플래티넘 등급을 목표로 하는 프로젝트의 사양서에 바이오 PVC가 포함될 것입니다. 또한, EPA가 2025년에 갱신한 탄성 바닥재 제품 카테고리 규정(PCR)에서는 원료의 출처를 명확히 하는 생애주기 평가가 의무화되어 있어, 이로 인해 공공 조달에서 화석 유래 수지는 사실상 불리한 입장에 놓이게 될 것입니다. 자동차 제조업체의 평가 기준도 이러한 추세를 뒷받침하고 있습니다. 폭스바겐(Volkswagen)은 공급업체 평가의 일부를 바이오 또는 재생 폴리머의 사용 현황에 따라 결정하고 있습니다. 한편, 포드는 2028년까지 북미 모델에 인증된 바이오 PVC의 사용을 의무화하고 있습니다. 이러한 목표는 바이오 원료를 처리하기 위해 크래커를 개조할 때 필수적인 수요량의 확실성을 수지 공급업체에 제시하고 있습니다.
화석 유래 PVC와의 큰 생산 비용 격차
바이오에탄올은 나프타 유래 에틸렌보다 비싸기 때문에 크래커 개조에 따른 자본 비용을 고려하기 전부터 수지에 프리미엄 가격이 책정되어 있습니다. 브라질과 인도에서는 연료 혼합 의무로 인해 에탄올 생산량의 대부분이 소비되어, 화학 용도로 전환할 수 있는 잉여량은 제한적입니다. 가격에 민감한 포장 및 건설 부문의 구매자들은 탄소 배출 벌금으로 그 차액이 메워지지 않는 한, 프리미엄 가격 지불을 주저하고 있습니다. 2025년, 리오넬 바셀(Lyonel Basell)사는 바이오 유래 폴리올레핀이 유럽에서는 프리미엄 가격을 달성한 반면, 화석 유래 수지 가격이 더 낮은 동남아시아에서는 어려움을 겪고 있다고 보고했습니다.
부문별 분석
2025년 생산량의 62.48%를 경질 등급이 차지했으며, 이는 음용수 배관이나 창틀에 50년의 수명이 요구된다는 점을 반영합니다. 이 압도적인 점유율이 바이오 기반 폴리염화비닐 시장 규모 대부분을 지탱하고 있으며, 수지 공급업체에게 예측 가능한 판매 경로를 확보해 주고 있습니다. 유연성 등급은 연평균 성장률(CAGR) 5.88%로 예측되며, 스코프 3 목표가 소재 선정에 영향을 미치는 자동차 내장재 부문에서 드롭인 대체재의 혜택을 받고 있습니다.
경질 컴파운드는 화석 유래 수지에서 바이오 유래 수지로 전환할 때 필요한 금형 변경을 최소화하여 도입 위험을 줄여주며, 인프라 프로젝트에서 바이오 기반 폴리염화비닐 시장의 꾸준한 성장을 보장하고 있습니다. 유연성 컴파운드는 적합한 가소제와 치밀한 전환 검사에 의존합니다. Teknor Apex는 이러한 성능 요건을 충족하기 위해 2025년에 바이오 함유율 40%의 유연성 컴파운드를 출시했습니다. 이러한 발전은 폴리머 화학이 아니라 배합 노하우야말로 바이오 기반 폴리염화비닐 산업의 각 부문에서 보급 속도를 결정짓는 요인임을 보여줍니다.
지역별 분석
2025년, 유럽은 바이오 기반 폴리염화비닐 시장에서 48.22%의 점유율을 차지했습니다. 이는 CBAM(탄소 국경 조정 메커니즘) 이행 기간 동안의 보고 요건과 INEOS, Vynova, 하류 가공업체 간의 물질 수지 공급 계약에 힘입은 결과입니다. 독일, 프랑스, 이탈리아가 수요를 주도하는 한편, 스웨덴과 덴마크에서는 지역 난방용 배관에 바이오 PVC 도입이 진행되고 있습니다. 러시아는 제재 조치와 바이오 원료 인프라가 미비한 탄화칼슘 공법에 대한 의존으로 인해 여전히 시장에서 뒤처진 상태입니다.
아시아태평양은 2031년 연평균 성장률(CAGR)이 5.94%로 가장 빠르게 성장하고 있는 지역입니다. 인도는 잉여 사탕수수 에탄올을 화학 공정으로 전환하고 있으며, Praj가 구자라트주에 운영 중인 시범 플랜트는 국내 원료 공급 준비가 완료되었음을 보여줍니다. 중국의 제14차 5개년 계획에서는 바이오에탄올 공동 처리에 관한 시범 할당량이 설정되어, 국영 크래커 기업들에게 탄소 조정 규제를 준수하기 위한 로드맵이 제시되었습니다. 일본과 한국은 전자기기 및 자동차 산업 고객을 위해 말레이시아와 태국에서 인증된 바이오나프타를 수입하고 있습니다.
북미는 시장 점유율은 작지만, 미국의 세액 공제 혜택을 크게 누리고 있으며, CO2에서 에틸렌으로의 전환 비용을 절감하고 있습니다. 다우(Dow)사는 원료 조달 제약에 직면해 있으며, 생산 병목 현상보다 공급업체 인증 일정이 더 중요하게 여겨지고 있습니다. 북미에서는 멕시코가 자사의 운영을 미국의 OEM 스코어카드에 맞추고 있을 뿐만 아니라, 브라질의 에탄올에서 에틸렌을 생산하는 플랜트가 남미 공급을 강화하고 있습니다. 중동은 아직 발전 초기 단계이지만, SABIC의 바이오나프타 시험 가동 예정은 수요의 싹트음을 시사하고 있으며, 시험이 성공할 경우 생산 능력의 대폭적인 확대 가능성이 예상됩니다.
기타 혜택
- 엑셀 형식 시장 예측(ME) 시트
- 3개월간의 애널리스트 지원
자주 묻는 질문
목차
제1장 서론
제2장 조사 방법
제3장 주요 요약
제4장 시장 구도
제5장 시장 규모 및 성장 예측
제6장 경쟁 구도
제7장 시장 기회 및 향후 전망
AJY 26.08.28According to Mordor Intelligence, the bio-Based polyvinyl chloride market size is expected to grow from USD 0.96 billion in 2025 to USD 1.01 billion in 2026 and is forecast to reach USD 1.31 billion by 2031 at 5.37% CAGR over 2026-2031.
This report is Segmented by Product Type (Rigid Bio-PVC and Flexible Bio-PVC), Application (Pipes, Wires, Cables, Films and Sheets, and Others), End-User Industry (Building and Construction, Transportation and Packaging, Electrical and Electronics, and Others), and Geography (Asia-Pacific, North America, Europe, and More). The Market Forecasts are Provided in Terms of Value (USD).
Global Bio-Based Polyvinyl Chloride Market Trends and Insights
Stricter Environmental Regulations And ESG Mandates
The EU Carbon Border Adjustment Mechanism entered its transitional phase in late 2023 and will apply full embedded-carbon tariffs from 2026, making high-carbon PVC imports costlier by 2028 . California's SB 253 and SB 261 require scope-3 disclosures from 2024, pushing building and automotive buyers to audit polymer origins. Teknor Apex noted in 2025 a growth of European flooring customers demanding bio-attributed compounds verified for carbon footprint. These converging rules tilt procurement toward certified bio-PVC despite its price premium. Producers able to document chain-of-custody compliance earn preferred-supplier status in regulated tenders.
Corporate Sustainability Commitments And Green-Building Standards
LEED v5, fully rolling out in 2026, grants extra points for ISO 16620-verified bio-based content, putting bio-PVC on specification lists for projects targeting Gold or Platinum ratings . The EPA's 2025 update of Product Category Rules for resilient flooring mandates life-cycle assessments that reveal feedstock origin, effectively disadvantaging fossil resin in public procurement. Automaker scorecards reinforce the pull: Volkswagen assigns a portion of its supplier ratings to bio-based or recycled polymers. Meanwhile, Ford mandates the use of certified bio-PVC in its North American models by 2028. Such targets provide resin suppliers with the volume certainty essential for retrofitting crackers to process bio-feedstocks.
High Production-Cost Gap Versus Fossil PVC
Bio-ethanol commands a higher price than naphtha-based ethylene, resulting in a resin premium before accounting for capital charges related to cracker retrofits. In Brazil and India, fuel-blending mandates consume the majority of ethanol volumes, leaving limited surplus for chemical applications. Buyers in the price-sensitive packaging and construction sectors hesitate to pay the premium unless carbon penalties bridge the difference. In 2025, LyondellBasell reported that while bio-attributed polyolefins achieved a premium in Europe, they faced challenges in Southeast Asia, where fossil resins are priced lower.
Other drivers and restraints analyzed in the detailed report include:
- Cost-Competitive Bio-Ethylene Routes Reaching Commercial Scale
- EU Carbon-Border Adjustments Accelerating Low-Carbon Feedstock Use
- Limited Commercial-Scale Renewable-Feedstock Supply
For complete list of drivers and restraints, kindly check the Table Of Contents.
Segment Analysis
Rigid variants controlled 62.48% of 2025 volume, reflecting the need for 50-year service lives in potable-water pipes and window profiles. This dominance underpins a substantial portion of the bio-based polyvinyl chloride market size, securing predictable offtake for resin suppliers. Flexible grades, forecast at a 5.88% CAGR, benefit from drop-in substitution in automotive interiors where scope-3 targets drive material choices.
Rigid compounds require minimal tooling changes when swapping fossil for bio-attributed resin, trimming adoption risk, and ensuring that the bio-based polyvinyl chloride market grows steadily within infrastructure projects. Flexible formulations depend on compatible plasticizers and careful migration testing; Teknor Apex launched a 40% bio-content flexible compound in 2025 to meet these performance demands. These advances show how formulation know-how, not polymer chemistry, sets the pace of segment uptake in the bio-based polyvinyl chloride industry.
Complete Report Scope:
- By Product Type
- Rigid Bio-PVC
- Flexible Bio-PVC
- By Application
- Pipes
- Wires
- Cables
- Films and Sheets
- Others
- By End-User Industry
- Building and Construction
- Transportation and Packaging
- Electrical and Electronics
- Others
- By Geography
- Asia-Pacific
- China
- India
- Japan
- South Korea
- ASEAN Countries
- Rest of Asia-Pacific
- North America
- United States
- Canada
- Mexico
- Europe
- Germany
- United Kingdom
- France
- Italy
- Russia
- NORDIC Countries
- Rest of Europe
- South America
- Brazil
- Argentina
- Rest of South America
- Middle-East and Africa
- Saudi-Arabia
- South Africa
- Rest of Middle-East and Africa
- Asia-Pacific
Geography Analysis
Europe claimed a 48.22% bio-based polyvinyl chloride market share in 2025, lifted by CBAM's transitional reporting and mass-balance supply deals between INEOS, Vynova, and downstream fabricators. Germany, France, and Italy lead demand, while Sweden and Denmark test bio-PVC in district-heating pipes. Russia remains sidelined due to sanctions and carbide-route dependence that lacks bio-feedstock infrastructure.
Asia-Pacific is the fastest-growing region at a 5.94% CAGR through 2031. India diverts surplus sugarcane ethanol into chemical routes, and Praj's Gujarat demo plant signals domestic feedstock readiness. China's five-year plan opens pilot quotas for bio-ethanol co-processing, giving state-owned crackers a pathway to carbon-adjustment compliance. Japan and South Korea import certified bio-naphtha from Malaysia and Thailand for electronics and automotive customers.
North America, while holding a smaller market share, reaps significant benefits from the United States tax credits, reducing CO2-to-ethylene costs. Dow faces feedstock constraints, highlighting supplier qualification timelines over production bottlenecks. In North America, Mexico aligns its operations with the United States OEM scorecards, and Brazil's ethanol-to-ethylene plant bolsters South America's supply. The Middle East remains in its infancy; however, SABIC's scheduled trial of bio-naphtha hints at budding demand, with potential for substantial capacity expansion if the trial proves successful.
- Avient Corporation
- Bio-Plastic Solutions LLC.
- Bio-Tec Environmental
- Braskem
- CLARIANT
- Dow
- ENSO Plastics
- Formosa Plastics Corporation, U.S.A.
- GEON Performance Solutions
- INEOS
- LG Chem
- LyondellBasell
- Metabolix, Inc.
- Nomaco
- Shin-Etsu Chemical Co., Ltd.
- Solvay SA
- Sylvin Technologies, Inc.
- Teknor Apex
- Vynova Group
- Westlake Vinnolit GmbH & Co. KG
Additional Benefits:
- The market estimate (ME) sheet in Excel format
- 3 months of analyst support
TABLE OF CONTENTS
1 Introduction
- 1.1 Study Assumptions
- 1.2 Scope of the Study
2 Research Methodology
3 Executive Summary
4 Market Landscape
- 4.1 Market Overview
- 4.2 Market Drivers
- 4.2.1 Stricter environmental regulations and ESG mandates
- 4.2.2 Corporate sustainability commitments and green-building standards
- 4.2.3 Cost-competitive bio-ethylene routes reaching commercial scale
- 4.2.4 EU carbon-border adjustments accelerating low-carbon feedstock use
- 4.2.5 Mass-balance flooring/pipe supply deals catalyzing downstream uptake
- 4.3 Market Restraints
- 4.3.1 High production-cost gap vs. fossil PVC
- 4.3.2 Limited commercial-scale renewable-feedstock supply
- 4.3.3 Traceability issues in mixed bio-attributed recycling streams
- 4.4 Value Chain Analysis
- 4.5 Porter's Five Forces
- 4.5.1 Threat of New Entrants
- 4.5.2 Bargaining Power of Buyers
- 4.5.3 Bargaining Power of Suppliers
- 4.5.4 Threat of Substitutes
- 4.5.5 Degree of Competition
5 Market Size and Growth Forecasts (Value)
- 5.1 By Product Type
- 5.1.1 Rigid Bio-PVC
- 5.1.2 Flexible Bio-PVC
- 5.2 By Application
- 5.2.1 Pipes
- 5.2.2 Wires
- 5.2.3 Cables
- 5.2.4 Films and Sheets
- 5.2.5 Others
- 5.3 By End-User Industry
- 5.3.1 Building and Construction
- 5.3.2 Transportation and Packaging
- 5.3.3 Electrical and Electronics
- 5.3.4 Others
- 5.4 By Geography
- 5.4.1 Asia-Pacific
- 5.4.1.1 China
- 5.4.1.2 India
- 5.4.1.3 Japan
- 5.4.1.4 South Korea
- 5.4.1.5 ASEAN Countries
- 5.4.1.6 Rest of Asia-Pacific
- 5.4.2 North America
- 5.4.2.1 United States
- 5.4.2.2 Canada
- 5.4.2.3 Mexico
- 5.4.3 Europe
- 5.4.3.1 Germany
- 5.4.3.2 United Kingdom
- 5.4.3.3 France
- 5.4.3.4 Italy
- 5.4.3.5 Russia
- 5.4.3.6 NORDIC Countries
- 5.4.3.7 Rest of Europe
- 5.4.4 South America
- 5.4.4.1 Brazil
- 5.4.4.2 Argentina
- 5.4.4.3 Rest of South America
- 5.4.5 Middle-East and Africa
- 5.4.5.1 Saudi-Arabia
- 5.4.5.2 South Africa
- 5.4.5.3 Rest of Middle-East and Africa
- 5.4.1 Asia-Pacific
6 Competitive Landscape
- 6.1 Market Concentration
- 6.2 Strategic Moves
- 6.3 Market Share/Ranking Analysis
- 6.4 Company Profiles (includes Global level Overview, Market level overview, Core Segments, Financials as available, Strategic Information, Market Rank/Share for key companies, Products and Services, and Recent Developments)
- 6.4.1 Avient Corporation
- 6.4.2 Bio-Plastic Solutions LLC.
- 6.4.3 Bio-Tec Environmental
- 6.4.4 Braskem
- 6.4.5 CLARIANT
- 6.4.6 Dow
- 6.4.7 ENSO Plastics
- 6.4.8 Formosa Plastics Corporation, U.S.A.
- 6.4.9 GEON Performance Solutions
- 6.4.10 INEOS
- 6.4.11 LG Chem
- 6.4.12 LyondellBasell
- 6.4.13 Metabolix, Inc.
- 6.4.14 Nomaco
- 6.4.15 Shin-Etsu Chemical Co., Ltd.
- 6.4.16 Solvay SA
- 6.4.17 Sylvin Technologies, Inc.
- 6.4.18 Teknor Apex
- 6.4.19 Vynova Group
- 6.4.20 Westlake Vinnolit GmbH & Co. KG
7 Market Opportunities and Future Outlook
- 7.1 White-Space and Unmet-Need Assessment


