

|
시장보고서
상품코드
2116026
농업용 화학제품 포장 : 시장 점유율 분석, 업계 동향과 통계, 성장 예측(2026-2031년)Agriculture Chemical Packaging - Market Share Analysis, Industry Trends & Statistics, Growth Forecasts (2026 - 2031) |
||||||
 Mordor Intelligence
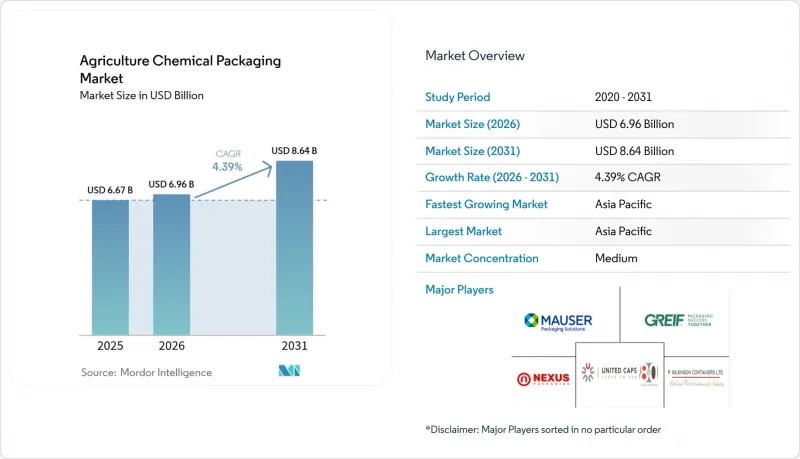
Mordor Intelligence에 따르면 농업용 화학제품 포장 시장 규모는 2025년에 66억 7,000만 달러로 평가되며, 2026년 69억 6,000만 달러에서 2031년까지 86억 4,000만 달러에 달할 것으로 예측되며, 예측 기간(2026-2031년) 동안 CAGR은 4.39%가 될 전망입니다.
본 보고서는 소재별(플라스틱, 금속, 종이·판지, 복합재), 제품 유형별(봉지·파우치, 병·용기, 드럼통·IBC, 캡·밀폐 부품), 화학제품별(비료, 농약, 생물제제, 보조제·계면활성제), 및 지역별(아메리카, 유럽, 기타)로 분류되어 있습니다. 시장 예측은 금액(달러) 기준으로 제시되어 있습니다.
세계 농업용 화학제품 포장 시장의 동향 및 인사이트
아시아태평양의 농약 생산량 급증으로 인해 용기 수요가 증가
아시아태평양의 농약 생산량 증가에 따라, 장거리 수출 운송을 견디면서도 위험물 관련 규제 요건을 충족하는 UN 인증 벌크 컨테이너, 드럼통 및 경질 병에 대한 전례 없는 수요가 발생하고 있습니다. 중국, 인도, 베트남, 인도네시아의 생산능력 확대는 규모의 경제를 가져와 단위당 포장 비용을 절감함으로써, 지역 제제 제조업체들이 세계 시장에서 경쟁할 수 있게 하고 있습니다. 정부의 비료 보조금 프로그램과 지속가능한 포장에 대한 인센티브는 규제 준수 포장에 대한 수요를 더욱 확대하고, 대량 생산형 드럼 라인 및 지역 밀착형 IBC 재생 센터에 대한 투자를 촉진하고 있습니다. 이 지역에 생산이 집중됨에 따라 캡, 라이너, 스마트 라벨의 지역 밀착형 공급망이 활성화되어 리드타임 단축과 물류 비용 절감으로 이어지고 있습니다. 이러한 요인들이 결합되어 아시아태평양은 농업용 화학제품 포장 시장의 성장 동력으로서의 입지를 공고히 하고 있습니다.
폐쇄형 IBC 재활용을 향한 규제 전환
EU와 북미의 확대 생산자 책임(EPR) 제도 및 매립 폐기물 감축 목표에 따라, 중간 벌크 컨테이너(IBC)는 일회용 자산에서 여러 주기에 걸친 물류 플랫폼으로 변모하고 있습니다. 전문적인 회수, 고압 세척, 재인증 프로그램을 통해 컨테이너의 수명이 연장되는 동시에, 버진 수지 수요가 감소하고, 전체 수명주기 동안의 배출량도 줄어들고 있습니다. 신품 IBC 구매에 비해 30-40%의 비용 절감이 도입의 인센티브가 되고 있으며, 자동화된 오염 제거 라인을 통해 농약, 비료, 첨가제 등 각 용도에서 일관된 품질이 보장되고 있습니다. 다국적 제제 제조업체들은 공급업체 계약에 폐쇄형 순환 계약을 규정하는 사례가 증가하고 있으며, 이에 따라 컨버터들은 지역별 재활용 허브에 대한 투자를 추진하고 있습니다. 예측 기간 동안 이 모델은 수익 구조를 일회성 컨테이너 판매에서 지속적인 서비스 수익으로 전환하는 동시에 기업의 탄소 중립 목표 달성에도 기여할 것입니다.
수지 가격 변동이 컨버터의 이익률을 압박
원유 가격의 급등락과 크래커의 예기치 못한 가동 중단으로 인한 폴리에틸렌 및 폴리프로필렌 원료 비용의 급격한 변동으로, 농업 분야의 구매자들이 빈번한 가격 조정에 저항하고 있어 컨버터의 스프레드가 압박받고 있습니다. 계절적인 조달 주기가 타이밍 불일치를 더욱 악화시켜, 중견 컨버터는 재고 손실 위험에 노출되어 있습니다. 일부 시장 선도 기업들은 장기 공급 계약을 통해 헤지를 하거나 수지 생산으로의 후방 통합을 추진하고 있지만, 규모가 작은 기업들은 규모의 경제를 갖추지 못해 통합 위험이 높아지는 상황에 직면해 있습니다. 이익률의 불확실성으로 인해 높은 진입 장벽을 가진 제품을 위한 신규 생산 라인에 대한 설비 투자가 억제되고 있으며, 이로 인해 농약 포장 시장에서의 혁신 전개가 지연되고 차세대 지속가능한 포장 형태의 공급이 제한될 가능성이 있습니다.
부문 분석
복합 솔루션은 2025년 매출의 18.86%를 차지하고 있으며, 그 성장률은 5.86%로 농업용 화학제품 포장 시장의 4.39%라는 성장 궤도를 크게 상회하고 있습니다. 이러한 다층 섬유·플라스틱 드럼 본체는 재생 가능한 판지 외장재와 HDPE 라이너를 결합하여 수지 사용량을 최대 60%까지 줄이고, 다국적 농업 자재 공급업체가 추구하는 탄소발자국 감축을 촉진하고 있습니다. 한편, 플라스틱은 55.48%라는 압도적인 점유율을 유지하고 있습니다. 이는 비용을 중시하는 범용 비료 분야에서 블로우 성형된 HDPE 병, PP 직물 봉투 및 LDPE 라이너가 여전히 표준적인 선택지로 자리 잡고 있기 때문입니다. 금속은 무게 증가보다 위조 방지가 우선시되는 휘발성 용제형 농약 및 가압식 훈증제 분야에서 틈새 시장으로서의 존재감을 유지하고 있습니다. 종이와 판지는 재활용성을 해치지 않으면서 건조 제제를 보호하는 95% 종이로 만들어진 캔을 통해 다시 주목받고 있습니다. 예측 기간 동안 하이브리드 복합 소재는 특히 낮은 투과성과 라이프사이클 지표 개선이 요구되는 규제 지역에서 증가하는 수요를 흡수할 준비가 되어 있습니다. 이는 기업의 ESG 목표와 부합하기 때문에 브랜드 소유자가 수지 감축 KPI를 설정하고 재생 가능 소재 함유율 기준을 의무화함에 따라 농약 포장 시장에서 더 큰 점유율을 확보할 수 있는 위치에 있습니다.
엄격한 화학적 적합성 시험을 통해 고산성 비료 및 특정 제초제용 복합 소재 드럼통의 적합성이 확인되어, 기존 도입 장벽이 완화되고 있습니다. 섬유제 드럼통 생산 라인의 신속한 개조 비용은 전체 플라스틱 드럼통 제조 기계를 새로 도입하는 경우에 비해 20-25% 저렴하여, 수지 가격의 불확실성이 높아지는 가운데 컨버터가 제품 포트폴리오의 다각화를 추진하는 데 박차를 가하고 있습니다. 또한, 운송 비용의 급등으로 인해, 특히 철도 인프라가 미비한 신흥 시장의 내륙 지역 물류에서 경량 복합재의 경쟁력이 높아지고 있습니다. EU와 북미의 규제 당국은 버진 플라스틱 사용량을 과세 대상으로 하는 포장세 제도 하에서 복합재 용기를 점점 더 선호하는 선택지로 간주하고 있으며, 이는 조기 도입 기업들에게 가격 면에서 호재가 되고 있습니다. 크래프트지나 특수 접착제의 원자재 공급망은 추가적인 규모 확대가 필요하지만, 복합재 용기는 플라스틱의 시장 점유율을 잠식할 전망이며, 농업용 화학제품 포장 시장에서 가장 빠르게 성장하는 소재 부문으로서의 입지를 공고히 하고 있는 것으로 보입니다.
지역별 분석
아시아태평양은 2025년 매출의 39.02%를 차지했으며, 2031년까지 연평균 성장률(CAGR) 5.28%를 기록할 전망으로, 판매량과 판매 속도 양면에서 선두를 유지할 것으로 예상됩니다. 중국의 친환경 포장에 대한 정부의 우대 조치와 인도의 비료 보조금 확대에 힘입어, 수요는 다층 드럼, 고차단성 파우치 및 리필 가능한 컨테이너 프로그램으로 이동하고 있습니다. 동남아시아가 대체 생산 거점으로 부상함에 따라 지역 내 컨테이너 운송량이 증가하고 있으며, 이 지역의 낮은 인건비가 재활용 처리 거점의 급속한 확장을 뒷받침하고 있습니다. 현지화된 공급망이 선호되는 경향은 캡 및 밀봉 부품 생산에 대한 투자를 더욱 촉진하고, 수입 의존도를 낮추며, 리드 타임을 단축시키고 있습니다.
북미는 2025년 시장 가치의 24.18%를 차지하며, 아시아태평양에 이어 2위를 기록했습니다. EPA(미국 환경보호청)의 엄격한 휘발성 규제 및 주 차원의 플라스틱 세금으로 인해 HDPE-EVOH 다층 병 및 폐쇄형 IBC(중간 벌크 용기)로의 전환이 가속화되고 있으며, 고가 제품군의 수익원이 육성되고 있습니다. 생산자들은 유통 감사 요건을 충족하기 위해 디지털화된 팔레트와 블록체인 지원 라벨에 투자하고 있으며, 높은 수확량을 목표로 하는 밭작물 재배 지역에서는 스마트 점적 관개 및 시비 시스템이 도입되어 유연한 혁신이 주류를 이루고 있습니다. 북미 농약 포장 시장 규모는 특정 농약 제제의 국내 복귀(리쇼어링)의 혜택을 받으며, 국내 포장 생산능력에 대한 수요를 뒷받침하고 있습니다.
유럽은 2025년 매출의 19.62%를 차지하고 있으며, 전 세계 규제의 벤치마크 대부분을 수립하고 있습니다. EU의 ‘포장 및 포장 폐기물 규정’에 따라 각 변환 업체들은 재생 재료 함량 30%의 HDPE 드럼 시험 도입 및 각 컨테이너에 고유 식별자 삽입을 추진하고 있습니다. 순환 경제의 목표는 다국적 화학 기업과 전문 재활용 업체 간의 파트너십을 촉진하고 있으며, 이러한 협력을 통해 위험물 용도에 적합한 고품질의 사용 후 소비자용 수지 원료 풀이 형성되고 있습니다. 연평균 성장률(CAGR)은 3.08%로 소폭이지만, 유럽의 혁신 성과는 다른 대륙으로의 기술 확산에 영향을 미치며 농업용 화학제품 포장 시장의 경쟁 구조를 형성하고 있습니다.
브라질을 중심으로 한 라틴아메리카와 중동 및 아프리카를 합치면 전 세계 매출의 약 17%를 차지합니다. 브라질에서는 생물 유래 농작물 투입이 연평균 15% 이상이라는 놀라운 속도로 확대되고 있어, 콜드체인의 무결성을 중시하는 특수한 포장 수요가 발생하고 있습니다. 한편, 걸프협력회의(GCC) 회원국에서는 해수 담수화를 이용한 점적 관개 프로젝트가 시범적으로 시행되고 있어, 염분이 포함된 환경에 적합한 수용성 영양소 팩이 필요합니다. 현재 규모는 작지만, 기후 변화에 대한 저항력을 높이기 위한 투자가 확대됨에 따라, 이러한 시장은 향후 10년 동안 상당한 성장이 예상됩니다.
기타 혜택:
- 엑셀 형식의 시장 예측(ME) 시트
- 3개월간의 애널리스트 지원
자주 묻는 질문
목차
제1장 소개
제2장 조사 방법
제3장 주요 요약
제4장 시장 구도
제5장 시장 규모와 성장 예측
제6장 경쟁 구도
제7장 시장 기회와 향후 전망
KSM 26.08.26According to Mordor Intelligence, the agriculture chemical packaging market size was valued at USD 6.67 billion in 2025 and estimated to grow from USD 6.96 billion in 2026 to reach USD 8.64 billion by 2031, at a CAGR of 4.39% during the forecast period (2026-2031).
This report is Segmented by Material Type (Plastic, Metal, Paper and Paperboard, and Composite), Product Type (Bags and Pouches, Bottles and Containers, Drums and IBCs, and Caps and Closures), Chemical (Fertilizer, Pesticide, Biologicals, and Adjuvants and Surfactants), and Geography (North America, South America, Europe, and More). The Market Forecasts are Provided in Terms of Value (USD).
Global Agriculture Chemical Packaging Market Trends and Insights
Surge in APAC Agrochemical Output Boosting Container Demand
Asia Pacific's rising agrochemical production volumes are generating unprecedented need for UN-certified bulk containers, drums, and rigid bottles that can withstand long-distance export shipping while meeting hazardous-materials protocols. Capacity expansions across China, India, Vietnam, and Indonesia are producing economies of scale that reduce per-unit packaging costs, enabling regional formulators to compete globally. Government fertilizer subsidy programs and sustainable packaging incentives further amplify demand for compliant packaging, channeling investments toward high-volume drum lines and localized IBC reconditioning centers. The concentration of production in the region is catalyzing localized supply chains for closures, liners, and smart labels, shortening lead times and lowering logistics spend. Collectively, these forces underpin Asia Pacific's status as the growth engine of the agriculture chemical packaging market.
Regulatory Shift Toward Closed-Loop IBC Re-conditioning
Extended producer responsibility schemes and landfill-reduction targets in the EU and North America are transforming intermediate bulk containers from single-use assets into multi-cycle logistics platforms. Specialized collection, high-pressure cleaning, and recertification programs extend container life while reducing virgin resin demand and cutting overall lifecycle emissions. Cost savings of 30-40% relative to new IBC purchases incentivize adoption, and automated decontamination lines ensure consistency across pesticide, fertilizer, and adjuvant applications. Multinational formulators increasingly specify closed-loop contracts in supplier agreements, prompting converters to invest in regional reconditioning hubs. Over the forecast horizon, the model shifts revenue mix from one-off container sales to recurring service income while satisfying corporate net-zero commitments.
Volatile Resin Prices Squeezing Converter Margins
Sharp swings in polyethylene and polypropylene feedstock costs, driven by crude price gyrations and unplanned cracker outages, compress converter spreads as agricultural buyers resist frequent price adjustments. Seasonal procurement cycles exacerbate timing mismatches, leaving mid-tier converters exposed to inventory losses. Some market leaders hedge through long-term supply agreements or integrate backward into resin production; smaller firms, lacking scale, confront heightened consolidation risk. Margin uncertainty curtails capital expenditure on new high-barrier lines, potentially delaying innovation rollouts and restricting supply of next-generation sustainable formats within the agriculture chemical packaging market.
Other drivers and restraints analyzed in the detailed report include:
- Rapid Adoption of HDPE-EVOH Multilayer Bottles for VOC Compliance
- Growth of Drip-Fertigation Driving Small-Dose Pouch Formats
- High Post-Use Decontamination Costs
For complete list of drivers and restraints, kindly check the Table Of Contents.
Segment Analysis
Composite solutions accounted for 18.86% of 2025 revenue yet are growing at 5.86% well above the 4.39% trajectory of the agriculture chemical packaging market. Their multilayer fiber-plastic drum bodies combine renewable paperboard exteriors with HDPE liners to cut resin use by up to 60% and facilitate carbon-footprint reductions requested by multinational crop-input suppliers. Meanwhile, plastic maintained a commanding 55.48% share because blow-molded HDPE bottles, PP woven sacks, and LDPE liners remain the default for cost-sensitive commodity fertilizers. Metals retain niche relevance for volatile solvent-based pesticides and pressurized fumigants where tamper resistance outweighs weight penalties. Paper and paperboard are re-entering the conversation via 95% paper-based cans that shield dry formulations without compromising recyclability. Over the forecast horizon, hybrid composites are poised to absorb incremental volume, particularly in regulated regions requiring lower permeation and improved life-cycle metrics. Their alignment with corporate ESG goals positions them to capture larger slices of the agriculture chemical packaging market size as brand owners set resin-reduction KPIs and mandate renewable content thresholds.
Rigorous chemical compatibility testing now validates composite drums for high-acid fertilizers and certain herbicides, easing historical adoption barriers. Rapid fiber-drum line retrofits cost 20-25% less than installing new all-plastic drum machines, encouraging converters to diversify portfolios amid resin price uncertainty. Elevated freight costs also favor lighter-weight composites, especially for inland distribution in emerging markets with underdeveloped rail infrastructure. Regulators in the EU and North America increasingly view composite containers as preferable under packaging taxes that penalize virgin-plastic intensity, creating pricing tailwinds for early adopters. Although raw-material supply chains for kraft paper and specialty adhesives require further scaling, composite formats appear set to erode plastic's share, reinforcing their status as the hot-growth material segment within the agriculture chemical packaging market.
Complete Report Scope:
- By Material Type
- Plastic
- Metal
- Paper and Paperboard
- Composite
- By Product Type
- Bags and Pouches
- Bottles and Containers
- Drums and Intermediate Bulk Containers
- Caps and Closures
- By Chemical
- Fertilizer
- Pesticide
- Biologicals
- Adjuvants and Surfactants
- By Geography
- North America
- United States
- Canada
- Mexico
- South America
- Brazil
- Argentina
- Chile
- Europe
- United Kingdom
- Germany
- France
- Italy
- Spain
- Russia
- Asia-Pacific
- China
- Japan
- India
- South Korea
- Australia and New Zealand
- Middle East and Africa
- Middle East
- United Arab Emirates
- Saudi Arabia
- Rest of Middle East
- Africa
- South Africa
- Nigeria
- Rest of Africa
- Middle East
- North America
Geography Analysis
Asia Pacific captured 39.02% of 2025 sales and is set to clock a 5.28% CAGR through 2031, preserving its lead in both volume and velocity. Government incentives for green packaging in China and the expansion of Indian fertilizer subsidies steer demand toward multilayer drums, high-barrier pouches, and refillable container programs. Southeast Asia's emergence as an alternative production hub amplifies intra-regional container shipments, and the region's lower labor costs support the rapid scaling of reconditioning depots. Preference for localized supply chains further spurs investment in cap and closure production, reducing dependency on imports and shortening turnaround times.
North America generated 24.18% of the 2025 value, ranking second behind the Asia Pacific. Tough EPA volatility rules and state-level plastic taxes are accelerating the shift toward HDPE-EVOH multilayer bottles and closed-loop IBC fleets, nurturing premium pricing streams. Producers invest in digitized pallets and blockchain-enabled labels to satisfy distribution audits, and yield-intensive row-crop belts adopt smart drip-fertigation that pulls flexible innovation into the mainstream. The agriculture chemical packaging market size in North America also benefits from the reshoring of certain pesticide formulations, reinforcing demand for domestic packaging capacity.
Europe contributed 19.62% of revenue in 2025 but sets many of the global regulatory benchmarks. The EU's Packaging and Packaging Waste Regulation spurs converters to pilot 30% recycled-content HDPE drums and to embed unique identifiers for each container. Circularity targets foster partnerships between chemical multinationals and specialized recyclers, and this collaboration is spawning feedstock pools for high-grade post-consumer resin suitable for hazardous-goods applications. Despite a modest 3.08% CAGR, Europe's innovation output influences technology diffusion into other continents, shaping the competitive dynamics of the agriculture chemical packaging market.
Latin America, anchored by Brazil, and the Middle East and Africa together account for roughly 17% of global revenue. In Brazil, the exponential uptake of biological crop inputs, advancing at more than 15% annually, creates specialized packaging needs that lean on cold-chain integrity. Meanwhile, Gulf Cooperation Council countries are piloting desalination-powered drip-irrigation projects that require water-soluble nutrient packs suitable for saline environments. Though smaller today, these markets represent substantial upside over the next decade as climate-resilience investments multiply.
- Greif, Inc.
- Mauser Packaging Solutions LLC
- Amcor plc
- Mondi plc
- United Caps Holding SA
- Ipackchem Group SAS
- ALPLA-Werke Alwin Lehner GmbH & Co KG
- BERICAP Holding GmbH
- Nexus Packaging Ltd
- P. Wilkinson Containers Ltd
- KSP International FZE
- Novolex Holdings LLC
- NNZ B.V.
- LC Packaging International B.V.
- Sonoco Products Company
- Smurfit Kappa Group plc
- Constantia Flexibles GmbH
- Flex-Pack Engineering LLC
Additional Benefits:
- The market estimate (ME) sheet in Excel format
- 3 months of analyst support
TABLE OF CONTENTS
1 INTRODUCTION
- 1.1 Study Assumptions and Market Definition
- 1.2 Scope of the Study
2 RESEARCH METHODOLOGY
3 EXECUTIVE SUMMARY
4 MARKET LANDSCAPE
- 4.1 Market Overview
- 4.2 Market Drivers
- 4.2.1 Surge in APAC agrochemical output boosting container demand
- 4.2.2 Regulatory shift toward closed-loop IBC re-conditioning
- 4.2.3 Rapid adoption of HDPE-EVOH multilayer bottles for VOC compliance
- 4.2.4 Growth of drip-fertigation driving small-dose pouch formats
- 4.2.5 Smart track-and-trace mandates under EU PPWR
- 4.2.6 Biobased barrier resin breakthroughs lowering permeation
- 4.3 Market Restraints
- 4.3.1 Volatile resin prices squeezing converter margins
- 4.3.2 High post-use decontamination costs
- 4.3.3 Evolving UN hazmat rules raising testing costs
- 4.3.4 Farm-level refill stations reducing single-use demand
- 4.4 Industry Value Chain Analysis
- 4.5 Regulatory Landscape
- 4.6 Technological Outlook
- 4.7 Porter's Five Forces Analysis
- 4.7.1 Bargaining Power of Suppliers
- 4.7.2 Bargaining Power of Buyers
- 4.7.3 Threat of New Entrants
- 4.7.4 Intensity of Competitive Rivalry
- 4.7.5 Threat of Substitute Products
5 MARKET SIZE AND GROWTH FORECASTS (VALUE)
- 5.1 By Material Type
- 5.1.1 Plastic
- 5.1.2 Metal
- 5.1.3 Paper and Paperboard
- 5.1.4 Composite
- 5.2 By Product Type
- 5.2.1 Bags and Pouches
- 5.2.2 Bottles and Containers
- 5.2.3 Drums and Intermediate Bulk Containers
- 5.2.4 Caps and Closures
- 5.3 By Chemical
- 5.3.1 Fertilizer
- 5.3.2 Pesticide
- 5.3.3 Biologicals
- 5.3.4 Adjuvants and Surfactants
- 5.4 By Geography
- 5.4.1 North America
- 5.4.1.1 United States
- 5.4.1.2 Canada
- 5.4.1.3 Mexico
- 5.4.2 South America
- 5.4.2.1 Brazil
- 5.4.2.2 Argentina
- 5.4.2.3 Chile
- 5.4.3 Europe
- 5.4.3.1 United Kingdom
- 5.4.3.2 Germany
- 5.4.3.3 France
- 5.4.3.4 Italy
- 5.4.3.5 Spain
- 5.4.3.6 Russia
- 5.4.4 Asia-Pacific
- 5.4.4.1 China
- 5.4.4.2 Japan
- 5.4.4.3 India
- 5.4.4.4 South Korea
- 5.4.4.5 Australia and New Zealand
- 5.4.5 Middle East and Africa
- 5.4.5.1 Middle East
- 5.4.5.1.1 United Arab Emirates
- 5.4.5.1.2 Saudi Arabia
- 5.4.5.1.3 Rest of Middle East
- 5.4.5.2 Africa
- 5.4.5.2.1 South Africa
- 5.4.5.2.2 Nigeria
- 5.4.5.2.3 Rest of Africa
- 5.4.5.1 Middle East
- 5.4.1 North America
6 COMPETITIVE LANDSCAPE
- 6.1 Market Concentration
- 6.2 Strategic Moves
- 6.3 Market Share Analysis
- 6.4 Company Profiles (includes Global level Overview, Market level overview, Core Segments, Financials as available, Strategic Information, Market Rank/Share for key companies, Products and Services, and Recent Developments)
- 6.4.1 Greif, Inc.
- 6.4.2 Mauser Packaging Solutions LLC
- 6.4.3 Amcor plc
- 6.4.4 Mondi plc
- 6.4.5 United Caps Holding SA
- 6.4.6 Ipackchem Group SAS
- 6.4.7 ALPLA-Werke Alwin Lehner GmbH & Co KG
- 6.4.8 BERICAP Holding GmbH
- 6.4.9 Nexus Packaging Ltd
- 6.4.10 P. Wilkinson Containers Ltd
- 6.4.11 KSP International FZE
- 6.4.12 Novolex Holdings LLC
- 6.4.13 NNZ B.V.
- 6.4.14 LC Packaging International B.V.
- 6.4.15 Sonoco Products Company
- 6.4.16 Smurfit Kappa Group plc
- 6.4.17 Constantia Flexibles GmbH
- 6.4.18 Flex-Pack Engineering LLC


