
|
시장보고서
상품코드
2116609
광학 게놈 매핑 시장 : 점유율 분석, 업계 동향과 통계, 성장 예측(2026-2031년)Optical Genome Mapping - Market Share Analysis, Industry Trends & Statistics, Growth Forecasts (2026 - 2031) |
||||||
 Mordor Intelligence
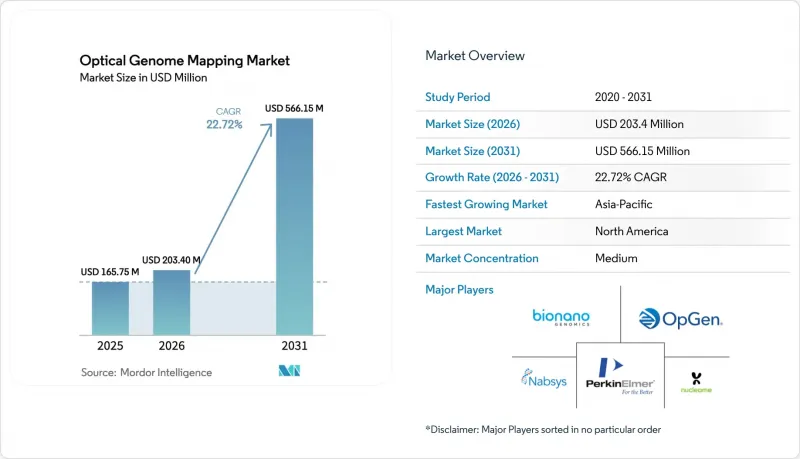
Mordor Intelligence에 의하면, 2026년 광학 게놈 매핑 시장 규모는 2억 340만 달러로 추정되고 있어 2025년 1억 6,575만 달러에서 확대해, 2031년에는 5억 6,615만 달러에 이를 것으로 예측됩니다.
2026년부터 2031년까지의 연평균 성장률(CAGR)은 22.72%를 나타낼 것으로 전망됩니다.
본 보고서는 제품 유형(장비, 소모품), 용도(종양학, 희귀질환 및 체질 유전학, 기타), 최종 사용자(생명공학·제약 기업, 연구·학술 기관, 기타), 지역(북미, 유럽, 아시아태평양, 중동 및 아프리카, 남미)별로 분류되어 있습니다. 시장 전망은 금액(달러) 기준으로 제시되어 있습니다.
세계 광학 게놈 매핑 시장 동향 및 인사이트
고급 유전체 분석에 대한 수요 증가
의료계에서는 기존의 세포유전학적 기법으로는 임상적으로 관련된 구조적 변이의 최대 40%를 놓칠 가능성이 있다는 점이 인식되고 있습니다. 광학 게놈 매핑은 이러한 과제를 해결하여, 현재의 표준 검사와 비교하여 혈액 악성 종양 사례의 58%에서 추가적인 임상적으로 유용한 변이를 식별합니다. 검사 기관들은 진단 정확도를 높이는 동시에 검사 기간을 수 주에서 수일로 단축하는 단일 분석 워크플로우를 높이 평가했습니다. 메디케어 카테고리 I CPT 코딩에 기반한 환급 전망은 의료 서비스 제공업체에게 경제적 타당성을 뒷받침하며, 종양학 분야에서 ‘유전체 우선’ 진단으로의 전환이 지속적인 수요 증가를 확고히 하고 있습니다.
유전성 질환 및 암 유병률 증가
암 발생률의 급증과 알려진 유전적 이질성이 맞물리면서, 고해상도 구조적 변이 프로파일링에 대한 수요가 높아지고 있습니다. 광학 게놈 매핑은 기존 방법으로는 감지할 수 없는 약물 내성 메커니즘을 감지하여, 의사가 더 조기에 치료 방침을 재검토할 수 있게 해줍니다. 희귀질환 프로그램도 마찬가지로 그 혜택을 누리고 있습니다. 연구에 따르면, 쇼트 리드 시퀀싱으로는 결론을 내릴 수 없었던 사례의 15%에서 병인성 변이가 검출된 것으로 나타났습니다. 시퀀싱 비용의 감소, 정밀의료 이니셔티브의 확대, 그리고 분석 기술의 향상으로 인해 다양한 환자 코호트에서 광학 게놈 매핑의 역할이 더욱 강화되고 있습니다.
장비 비용 부담
Saphyr이나 고처리량형 Stratys 시스템을 구입하려면 막대한 설비 투자가 필요합니다. 특히 신흥 시장의 소규모 검사실에서는 이것이 장벽으로 간주됩니다. 하지만 워크플로우 통합을 통해 시료당 비용이 절감되고 여러 가지 보완적인 검사가 불필요해짐에 따라 그 부담은 상쇄됩니다. 리스나 시약 대여 프로그램, 그리고 보상 경로의 확대를 통해 초기 비용에 대한 우려는 점차 완화되고 있습니다.
부문 분석
2025년 광학 게놈 매핑 시장 규모에서 장비는 부문 매출의 63.05%를 차지할 것으로 예측됩니다. 주로 나노 채널 어레이 플로우셀로 구성된 소모품은 가장 높은 성장세를 보이고 있으며, 검사 실행 횟수가 늘어날수록 혜택을 받아 연평균 성장률(CAGR) 25.10%로 증가할 것으로 예측됩니다. 2024년 4분기 플로우셀 출하 대수는 총 8,058대에 달했으며, 도입된 371개 시스템 전체에서 양호한 가동률을 보이고 있습니다.
자본 설비 매출은 정기적인 기술 주기의 영향을 받습니다. 2024년 1월에 출시된 ‘Stratys’는 기존 시스템보다 4배 많은 데이터를 생성하고 최대 12개의 검체를 동시에 처리할 수 있어, 고처리량 임상 실험실의 교체 수요를 자극하고 있습니다. 장비 매출에는 소프트웨어 라이선스 및 유지보수 수익도 포함되어 있어, 초기 비용과 지속적인 수익을 결합한 하이브리드 모델을 강화하고 있습니다. 이러한 동향이 맞물리면서, 장비가 플랫폼의 정착률을 뒷받침하는 한편, 소모품이 전반적인 성장을 견인하고 있는 이유가 부각되고 있습니다.
지역별 분석
북미는 2025년에 매출의 41.95%를 차지하며 광학 게놈 매핑 시장에서 주도적인 위치를 유지했습니다. 혈액 악성 종양 검사와 관련된 카테고리 I CPT 코드 및 FDA의 실험실 개발 검사(LDT)에 대한 감독 강화는 검증된 플랫폼에 유리한 규제적 확실성을 제공합니다. 대학 병원 및 유전체 연구 기관의 시스템 도입이 확대되고 있으며, 메디케어의 보험 적용에 대한 지속적인 검토가 병원 내 더 광범위한 도입으로 이어질 가능성이 있습니다.
아시아태평양은 가장 빠르게 성장하는 지역으로, 2031년까지 연평균 성장률(CAGR)이 28.90%를 나타낼 것으로 예측됩니다. 중국의 15년에 걸친 정밀의료 이니셔티브를 통해 수백만 건의 유전체 염기서열 분석이 수행되었으며, 이는 구조적 변이에 초점을 맞춘 기술에 대한 수요를 촉진하고 있습니다. 일본의 ‘TOP-GEAR’ 프로그램은 유전체 분석을 국가 암 대책 전략과 연계하고 있으며, 유전자 패널 검사에 대한 보험의 일부 급여는 보다 광범위한 보험 적용을 위한 선례가 되고 있습니다. 지역 바이오기술 클러스터는 국제적인 공급업체와 협력하여 제조, 교육, 지원의 현지화를 추진하고 있으며, 주요 대도시권 이외 지역에서의 도입 촉진에 기여하고 있습니다.
유럽에서는 공적 의료 제도, 범유럽 연구 컨소시엄, 그리고 성숙한 검사 기관 네트워크의 지원을 받아 꾸준한 보급이 진행되고 있습니다. 라틴아메리카 및 중동에서는 도입 단계가 아직 초기 단계이지만, 의료 현대화가 가속화되는 가운데 시범 프로그램이나 학술 제휴를 통해 관심이 표명되고 있습니다.
기타 혜택:
- 엑셀 형식 시장 예측(ME) 시트
- 3개월간의 애널리스트 지원
자주 묻는 질문
목차
제1장 서론
제2장 조사 방법
제3장 주요 요약
제4장 시장 구도
제5장 시장 규모와 성장 예측
제6장 경쟁 구도
제7장 시장 기회와 향후 전망
JHS 26.08.28According to Mordor Intelligence, optical genome mapping market size in 2026 is estimated at USD 203.4 million, growing from 2025 value of USD 165.75 million with 2031 projections showing USD 566.15 million, growing at 22.72% CAGR over 2026-2031.
This report is Segmented by Product Type (Instruments, Consumables), Application (Oncology, Rare-Disease & Constitutional Genetics, and More), End User (Biotechnology & Pharmaceutical Companies, Research & Academic Institutions, and More), and Geography (North America, Europe, Asia-Pacific, Middle East and Africa, South America). The Market Forecasts are Provided in Terms of Value (USD).
Global Optical Genome Mapping Market Trends and Insights
Rising Demand for Advanced Genomic Analysis
Health systems acknowledge that legacy cytogenetic techniques can miss up to 40% of clinically relevant structural variants. Optical genome mapping corrects this gap, identifying additional actionable variants in 58% of hematological malignancy cases compared with current standard testing. Laboratories value the single-assay workflow that trims turnaround from weeks to days while boosting diagnostic accuracy. The prospect of Medicare reimbursement under Category I CPT coding underscores financial viability for providers, and the shift toward genomic-first diagnostics in oncology cements sustainable demand growth.
Growing Prevalence of Genetic Disorders and Cancer
Escalating cancer incidence, coupled with recognized genetic heterogeneity, fuels the need for high-resolution structural-variant profiling. Optical genome mapping detects drug-resistance mechanisms invisible to conventional methods, allowing physicians to revise therapies earlier. Rare-disease programs benefit as well; studies show detection of pathogenic variants in 15% of cases that were inconclusive with short-read sequencing.Falling sequencing costs, expanding precision-medicine initiatives, and improved analytics reinforce optical genome mapping's role across diverse patient cohorts.
High Instrument Costs
Purchasing a Saphyr or high-throughput Stratys system requires significant capital outlays. Smaller laboratories, particularly in emerging markets, perceive this as a hurdle. Nonetheless, workflow consolidation offsets the burden by lowering per-sample costs and avoiding multiple complementary assays. Leasing and reagent-rental programs plus expanding reimbursement pathways gradually mitigate upfront expense concerns.
Other drivers and restraints analyzed in the detailed report include:
- Limitations of Traditional Cytogenetic Methods
- Technological Advancements in Genomics
- Requirement for Specialized Expertise
For complete list of drivers and restraints, kindly check the Table Of Contents.
Segment Analysis
The optical genome mapping market size for instruments corresponding to 63.05% of segment revenue in 2025. Consumables, mainly nanochannel array flowcells, recorded the highest momentum and are forecast to climb at a 25.10% CAGR, benefiting from each incremental test run. Flowcell shipments totaled 8,058 units in Q4 2024, indicating healthy utilization across 371 installed systems.
Capital equipment sales hinge on periodic technology cycles. Stratys, launched in January 2024, produces four times the data of earlier systems and processes up to 12 samples concurrently, spurring replacement demand among high-throughput clinical labs. Instrument revenue also accrues from software licenses and maintenance, reinforcing a hybrid model of upfront and recurring streams. The resonance of these dynamics underscores why consumables pace overall growth even as instruments anchor platform stickiness.
Complete Report Scope:
- By Product Type
- Instruments
- Consumables
- By Application
- Oncology
- Rare-Disease & Constitutional Genetics
- Prenatal & Reproductive Health
- Microbial & Pathogen Genomics
- Agricultural & Plant Genomics
- By End User
- Biotechnology & Pharmaceutical Companies
- Research & Academic Institutions
- Clinical Diagnostic Laboratories
- Contract Research Organizations
- By Geography
- North America
- United States
- Canada
- Mexico
- Europe
- Germany
- United Kingdom
- France
- Italy
- Spain
- Rest of Europe
- Asia-Pacific
- China
- Japan
- India
- Australia
- South Korea
- Rest of Asia-Pacific
- Middle East & Africa
- GCC
- South Africa
- Rest of Middle East & Africa
- South America
- Brazil
- Argentina
- Rest of South America
- North America
Geography Analysis
North America retained leadership in the optical genome mapping market with 41.95% revenue contribution in 2025. Category I CPT codes for hematological malignancy testing and the FDA's heightened oversight of laboratory-developed tests provide regulatory certainty that favors validated platforms. Academic medical centers and genomic-research enterprises proliferate system placements, and Medicare's ongoing coverage deliberations could unlock broader hospital adoption.
Asia Pacific is the fastest-growing region, projected at a 28.90% CAGR through 2031. China's 15-year precision-medicine initiative is sequencing millions of genomes, fostering demand for structural-variant-centric technologies. Japan's TOP-GEAR program aligns genomic analysis with national cancer-control strategies, and partial insurance coverage for gene-panel testing sets precedent for wider reimbursement. Regional biotechnology clusters collaborate with international vendors to localize manufacturing, training, and support, helping spur adoption beyond tier-one urban centers.
Europe exhibits steady uptake underpinned by public health-care systems, pan-European research consortia, and a mature laboratory network. Latin America and the Middle East are earlier in adoption curves yet show interest through pilot programs and academic partnerships as health-care modernization accelerates.
- Bionano Genomics
- OpGen
- Nabsys
- Nucleome Informatics
- PerkinElmer
- Agilent Technologies
- Thermo Fisher Scientific
- Illumina
- Roche Sequencing Solutions
- QIAGEN
- Pacific Biosciences
- Revvity
- Genetron Holdings
- Berry Genomics
- Dante Genomics
- Bio-Rad Laboratories
- Oxford Nanopore Technologies
- Gene by Gene
- Stratec SE
- CN Life Sciences Instruments
- Novogene
Additional Benefits:
- The market estimate (ME) sheet in Excel format
- 3 months of analyst support
TABLE OF CONTENTS
1 Introduction
- 1.1 Study Assumptions & Market Definition
- 1.2 Scope of the Study
2 Research Methodology
3 Executive Summary
4 Market Landscape
- 4.1 Market Overview
- 4.2 Market Drivers
- 4.2.1 Rising Demand for Advanced Genomic Analysis
- 4.2.2 Growing Prevalence of Genetic Disorders and Cancer
- 4.2.3 Limitations of Traditional Cytogenetic Methods
- 4.2.4 Technological Advancements in Genomics
- 4.2.5 Expanding Applications in Precision Medicine
- 4.2.6 Increasing Collaborations and Investments
- 4.3 Market Restraints
- 4.3.1 High Instrument Costs
- 4.3.2 Requirement for Specialized Expertise
- 4.3.3 Concerns Over Data Interpretation and Standardization
- 4.3.4 Regulatory and Ethical Considerations
- 4.4 Porter's Five Forces Analysis
- 4.4.1 Threat of New Entrants
- 4.4.2 Bargaining Power of Buyers
- 4.4.3 Bargaining Power of Suppliers
- 4.4.4 Threat of Substitutes
- 4.4.5 Intensity of Competitive Rivalry
5 Market Size & Growth Forecasts (Value in USD)
- 5.1 By Product Type
- 5.1.1 Instruments
- 5.1.2 Consumables
- 5.2 By Application
- 5.2.1 Oncology
- 5.2.2 Rare-Disease & Constitutional Genetics
- 5.2.3 Prenatal & Reproductive Health
- 5.2.4 Microbial & Pathogen Genomics
- 5.2.5 Agricultural & Plant Genomics
- 5.3 By End User
- 5.3.1 Biotechnology & Pharmaceutical Companies
- 5.3.2 Research & Academic Institutions
- 5.3.3 Clinical Diagnostic Laboratories
- 5.3.4 Contract Research Organizations
- 5.4 By Geography
- 5.4.1 North America
- 5.4.1.1 United States
- 5.4.1.2 Canada
- 5.4.1.3 Mexico
- 5.4.2 Europe
- 5.4.2.1 Germany
- 5.4.2.2 United Kingdom
- 5.4.2.3 France
- 5.4.2.4 Italy
- 5.4.2.5 Spain
- 5.4.2.6 Rest of Europe
- 5.4.3 Asia-Pacific
- 5.4.3.1 China
- 5.4.3.2 Japan
- 5.4.3.3 India
- 5.4.3.4 Australia
- 5.4.3.5 South Korea
- 5.4.3.6 Rest of Asia-Pacific
- 5.4.4 Middle East & Africa
- 5.4.4.1 GCC
- 5.4.4.2 South Africa
- 5.4.4.3 Rest of Middle East & Africa
- 5.4.5 South America
- 5.4.5.1 Brazil
- 5.4.5.2 Argentina
- 5.4.5.3 Rest of South America
- 5.4.1 North America
6 Competitive Landscape
- 6.1 Market Concentration
- 6.2 Market Share Analysis
- 6.3 Company Profiles (includes Global level Overview, Market level overview, Core Segments, Financials as available, Strategic Information, Market Rank/Share for key companies, Products & Services, and Recent Developments)
- 6.3.1 Bionano Genomics
- 6.3.2 OpGen
- 6.3.3 Nabsys
- 6.3.4 Nucleome Informatics
- 6.3.5 PerkinElmer, Inc.
- 6.3.6 Agilent Technologies
- 6.3.7 Thermo Fisher Scientific
- 6.3.8 Illumina
- 6.3.9 Roche Sequencing Solutions
- 6.3.10 Qiagen
- 6.3.11 Pacific Biosciences
- 6.3.12 Revvity
- 6.3.13 Genetron Holdings
- 6.3.14 Berry Genomics
- 6.3.15 Dante Genomics
- 6.3.16 Bio-Rad Laboratories
- 6.3.17 Oxford Nanopore Technologies
- 6.3.18 Gene by Gene
- 6.3.19 Stratec SE
- 6.3.20 CN Life Sciences Instruments
- 6.3.21 Novogene
7 Market Opportunities & Future Outlook
- 7.1 White-space & Unmet-Need Assessment