|
시장보고서
상품코드
2117253
북미의 구조화 배선 : 시장 점유율 분석, 업계 동향과 통계, 성장 예측(2026-2031년)North America Structured Cabling - Market Share Analysis, Industry Trends & Statistics, Growth Forecasts (2026 - 2031) |
||||||
 Mordor Intelligence
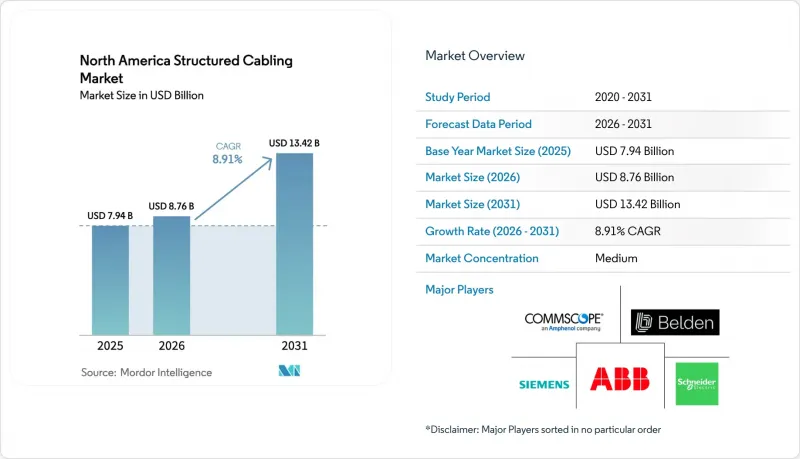
Mordor Intelligence에 따르면 북미의 구조화 배선 시장 규모는 2025년 79억 4,000만 달러에서 2026년에는 87억 6,000만 달러로 확대되고, 2031년까지 134억 2,000만 달러에 달할 것으로 예상되며, 2026년부터 2031년까지 CAGR 8.91%로 성장할 것으로 전망됩니다.
본 보고서는 제품 유형(구리선 및 광섬유), 케이블 카테고리(카테고리 5e, 카테고리 6 등), 구성요소(케이블, 접속 장비 등), 용도(LAN 및 데이터센터), 최종사용자 산업(IT·통신, 의료, 제조 등), 설치 유형(신규 설치, 업그레이드 및 개보수), 그리고 지역별로 분류되어 있습니다. 시장 전망은 금액(달러) 단위로 제시되어 있습니다.
북미 구조화 배선 시장의 동향 및 인사이트
하이퍼스케일 데이터센터의 확대
하이퍼스케일 사업자들은 기가와트 규모의 캠퍼스 건설을 지속적으로 추진하고 있으며, 2025년 중반까지 아메리카 전역에서 건설 중인 시설에 7.8기가와트의 전력을 추가할 전망입니다. 아마존이 인디애나주에 건설하는 150억 달러 규모의 복합 시설이나 마이크로소프트가 위스콘신주에 건설하는 40억 달러 규모의 시설은 신규 1메가와트당 얼마나 많은 자본 집약성이 필요한지를 여실히 보여주고 있으며, 각각 톱 오브 랙(Top-of-Rack) 연결을 위해 3-5킬로미터의 광섬유 간선 케이블과 10-15킬로미터의 구리선 케이블을 매설하고 있습니다. 미국은 전 세계 하이퍼스케일 용량의 54%를 차지하며, 해당 지역의 케이블 수요를 지탱하는 핵심 축이 되고 있습니다. 듀얼 패스웨이 및 N+1 케이블 관리를 규정하는 TIA-942-B 인증은 1제곱피트당 지출을 증가시키는 한편, 800기가비트로의 업그레이드를 대비한 미래 지향적인 시설을 구현합니다. 미시간주에 위치한 70억 달러 규모의 OpenAI-Oracle 시설과 같이 AI에 최적화된 설계에서는 저지연 스파인-리프 토폴로지가 필요하며, 이로 인해 광섬유 밀도가 더욱 높아집니다.
더 높은 대역폭을 가진 카테고리 케이블로의 전환
2025년, 미국 내 구리선 판매의 41%를 카테고리 6A가 차지하여 2023년 대비 4포인트 증가했습니다. 이는 기업들이 카테고리 8의 30미터라는 거리 제한을 피하기 위해 10기가비트 이더넷을 목표로 삼았기 때문입니다. 800기가비트 이더넷을 향한 IEEE 802.3df 로드맵에 따라 데이터센터 스파인에서의 싱글 모드 채택이 가속화되고 있지만, RJ45의 친숙함과 기계적 내구성 덕분에 수평 배선에서는 여전히 구리선이 자리 잡고 있습니다. 예정된 ANSI/TIA-568 개정으로 카테고리 6B가 도입되어 10기가비트 전송 거리가 150미터로 연장됨에 따라, 캠퍼스 백본에서 구리선의 중요성이 더욱 높아질 것으로 예상됩니다. 2.5기가비트 업링크가 필요한 Wi-Fi 6E 및 Wi-Fi 7로의 업그레이드에 따라, 호텔 업계와 교육 기관에서는 기존의 카테고리 5e 드롭선 개보수가 진행되고 있으며, 미사용 배선이 수익 기회로 전환되고 있습니다. 이러한 요인들이 복합적으로 작용하여 해당 지역의 연평균 성장률(CAGR)에 1.5%포인트의 상승 요인으로 작용하고 있습니다.
고성능 무선 솔루션에 대한 수요 증가
Wi-Fi 6E 및 Wi-Fi 7은 유선 네트워크와 무선 네트워크 간의 처리량 격차를 해소하며, 일부 기업에서는 고밀도 액세스 포인트 네트워크를 우선시하여 수평 방향 케이블 수를 줄이는 추세가 나타나고 있습니다. 각 AP에는 여전히 중복성을 확보하기 위해 2개의 카테고리 6A 업링크가 필요하지만, 48포트에서 24포트 토폴로지로 전환함으로써 총 포트 밀도가 낮아져 케이블 사용량을 최대 40%까지 줄일 수 있습니다. 2024년 FCC가 6 GHz 대역 사용을 승인함에 따라 장비 교체 주기가 가속화되고 있으며, 딜로이트는 2023년 이전의 무선 인프라 중 40%가 2027년까지 교체될 것으로 예측하고 있습니다. 구조화된 케이블 배선은 백홀에서 여전히 핵심적인 역할을 하고 있지만, ‘무선 우선(Wireless First)’ 레이아웃이 가진 유연성과 낮은 초기 비용으로 인해 예측 연평균 성장률(CAGR)은 0.7포인트 하락할 것으로 전망됩니다.
부문 분석
2025년, 북미 구조화 배선 시장에서 구리선 솔루션은 58.13%의 점유율을 유지하며, PoE(Power over Ethernet)가 필수적인 수평 링크 분야에서 그 우위를 입증하고 있습니다. 그러나 400기가비트 및 800기가비트 스파인 네트워크에서는 100미터를 초과하는 단일 모드 광섬유의 도달 거리가 요구되기 때문에 광섬유 매출은 연평균 9.37%의 성장률을 보이고 있습니다. 구리 제품의 이익률은 2025년 2분기 톤당 9,513달러의 가격으로 인해 압박을 받고 있으며, 이는 원자재 가격 변동에 민감한 지방 지역 프로젝트에서 광섬유로의 대체를 가속화했습니다.
다중 모드 OM4 및 OM5는 랙 간 단거리 배선에 적합하지만, 통신 사업자들은 코히어런트 광통신으로의 업그레이드에 대응할 수 있는 하이브리드 트렁크를 이용한 사전 배선을 추진하고 있습니다. 광섬유의 비용 곡선 하락과 낮은 감쇠 특성이 결합되어, 장거리 통신의 경제성은 결정적으로 광섬유에 유리하게 작용하고 있습니다. 구리선의 주요 강점은 PoE 조명 및 산업용 이더넷에서 단일 매체를 통해 데이터와 90와트의 전력을 동시에 전송해야 하는 경우에 필수적인 직류(DC) 전원 공급 기능에 있습니다.
2025년에는 카테고리 6 케이블이 매출의 33.89%를 차지했지만, 100미터를 초과하는 거리에서 10기가비트 표준화가 진행됨에 따라 카테고리 6A는 연평균 성장률(CAGR) 9.89%로 성장하고 있습니다. 미국 내 판매 점유율은 2025년에 41%에 달하며, 카테고리 5e가 오랫동안 지배해 온 상황에서 뚜렷한 전환을 보였습니다. 카테고리 8은 30미터의 전송 거리 제한으로 인해 스위치에서 서버로의 연결로만 제한될 뿐만 아니라, 가격이 40-60% 더 비싸기 때문에 광섬유에 비해 투자 수익률이 낮아 시장 점유율은 5% 미만에 그치고 있습니다.
10기가비트 전송 거리를 150미터까지 연장할 것으로 예상되는 카테고리 6B의 사양으로 인해, 캠퍼스 백본에서 구리선의 입지는 더욱 공고해질 것이며, 비-RJ45 커넥터의 채택 및 TIA 승인을 받지 못해 보급이 제한되고 있는 카테고리 7의 회복세는 둔화될 가능성이 있습니다. BSRIA의 조사에 따르면, 2024년에는 카테고리 6A의 전 세계 도입이 12% 증가하여 구리선 규격 중 가장 높은 성장률을 보일 것으로 예측됩니다. 이는 건물 소유주들이 기가비트로 전환할 때 겪었던 ‘투자 낭비’ 상황을 피하고자 하기 때문입니다.
기타 혜택:
- 엑셀 형식의 시장 예측(ME) 시트
- 3개월간의 애널리스트 지원
자주 묻는 질문
목차
제1장 소개
제2장 조사 방법
제3장 주요 요약
제4장 시장 구도
제5장 시장 규모와 성장 예측
제6장 경쟁 구도
제7장 시장 기회와 향후 전망
KSM 26.08.26According to Mordor Intelligence, the North America structured cabling market size is expected to increase from USD 7.94 billion in 2025 to USD 8.76 billion in 2026 and reach USD 13.42 billion by 2031, growing at a CAGR of 8.91% over 2026-2031.
This report is Segmented by Product Type (Copper, and Fiber), Cable Category (Category 5e, Category 6, and More), Component (Cables, Connectivity, and More), Application (LAN, and Data Center), End-User Industry (IT and Telecom, Healthcare, Manufacturing, and More), Installation Type (New Installation, and Upgrade and Retrofit), and Geography. Market Forecasts are Provided in Value (USD).
North America Structured Cabling Market Trends and Insights
Growing Expansion of Hyperscale Data Centers
Hyperscale operators continue to commission gigawatt-scale campuses, adding 7.8 gigawatts of power under construction across the Americas by mid-2025. Amazon's USD 15 billion Indiana complex and Microsoft's USD 4 billion Wisconsin build illustrate the capital intensity behind every new megawatt, each pulling 3-5 kilometers of fiber trunk and 10-15 kilometers of copper cabling for top-of-rack links. The United States hosts 54% of global hyperscale capacity, anchoring regional cable demand. TIA-942-B certification, which prescribes dual pathways and N+1 cable management, elevates per-square-foot spending yet future-proofs plants for 800-gigabit upgrades. AI-optimized designs, such as the USD 7 billion OpenAI-Oracle facility in Michigan, require low-latency spine-leaf topologies that further increase fiber density.
Migration to Higher Bandwidth Category Cables
Category 6A accounted for 41% of United States copper sales in 2025, a four-point gain over 2023, as enterprises targeted 10-gigabit Ethernet to avoid the 30-meter ceiling of Category 8. The IEEE 802.3df roadmap toward 800-gigabit Ethernet accelerates single-mode adoption in data-center spines, yet copper remains entrenched in horizontals due to RJ45 familiarity and mechanical durability. Anticipated ANSI/TIA-568 updates may introduce Category 6B, stretching 10-gigabit reach to 150 meters and extending copper's relevance in campus backbones. Wi-Fi 6E and Wi-Fi 7 upgrades, which need 2.5-gigabit uplinks, are prompting retrofits of legacy Category 5e drops in hospitality and education, converting dormant runs into revenue opportunities. These factors collectively add 1.5 percentage points to the regional CAGR.
Rising Demand for High-Performance Wireless Solutions
Wi-Fi 6E and Wi-Fi 7 close the throughput gap between wired and wireless networks, prompting some enterprises to scale back on horizontal cable counts in favor of dense access-point grids. Although each AP still requires dual Category 6A uplinks for redundancy, the switch from 48-port to 24-port topologies cuts total port density, trimming cable volumes by up to 40%. FCC authorization of the 6 GHz band in 2024 accelerated refresh cycles, and Deloitte expects 40% of pre-2023 wireless estates to be swapped by 2027. While structured cabling retains an anchor role for backhaul, the flexibility and lower upfront cost of wireless-first layouts subtract 0.7 percentage points from forecast CAGR.
Other drivers and restraints analyzed in the detailed report include:
- Increasing Fiber-To-The-Home and 5G Backhaul Deployments
- Rising Adoption of Power over Ethernet for Smart Building Applications
- Complex and Costly Installation in Brownfield Retrofits
For complete list of drivers and restraints, kindly check the Table Of Contents.
Segment Analysis
Copper solutions maintained 58.13% of the North America structured cabling market share in 2025, underscoring their dominance in horizontal links, where Power over Ethernet is paramount. However, fiber revenue is growing 9.37% annually as 400-gigabit and 800-gigabit spines demand single-mode reach beyond 100 meters. Copper margins are under pressure from USD 9,513-per-ton pricing in Q2 2025, which accelerated fiber substitution in rural programs sensitive to material swings.
Multi-mode OM4 and OM5 sustain shorter inter-rack runs, yet operators are pre-cabling with hybrid trunks that accommodate coherent optics upgrades. Fiber's falling cost curve, paired with lower attenuation, tilts long-haul economics decisively in its favor. Copper's chief insulation remains its DC power capability, vital for PoE lighting and industrial Ethernet, where a single medium must carry both data and 90 watts of power.
Category 6 cables accounted for 33.89% of revenue in 2025, yet Category 6A is growing at a 9.89% CAGR on the back of 10-gigabit standardization over 100 meters. United States sales share reached 41% in 2025, a clear pivot from Category 5e's historical dominance. Category 8 remains confined below 5% share because its 30-meter ceiling restricts reach to switch-to-server hops, and its 40-60% price premium erodes return on investment versus fiber.
Anticipated Category 6B specifications extending 10-gigabit to 150 meters could entrench copper even deeper into campus backbones, slowing any rebound for Category 7, whose non-RJ45 connectors and lack of TIA endorsement limit acceptance. BSRIA surveys showed Category 6A global installations rising 12% in 2024, the strongest among copper classes, as building owners avoid stranded investment scenarios experienced during the gigabit transition.
Complete Report Scope:
- By Product Type
- Copper
- Copper Cable
- Copper Connectivity
- Fiber
- Fiber Cable (Single-mode)
- Fiber Cable (Multi-mode)
- Fiber Connectivity
- Copper
- By Cable Category
- Category 5e
- Category 6
- Category 6A
- Category 7
- Category 8
- By Component
- Cables
- Connectivity
- Patch Panels and Cross Connects
- Racks and Cabinets
- Cable Management Accessories
- By Application
- LAN
- Data Center
- By End-User Industry
- IT and Telecom
- Banking, Financial Services, and Insurance (BFSI)
- Government and Defense
- Healthcare
- Manufacturing
- Commercial Buildings
- By Installation Type
- New Installation
- Upgrade and Retrofit
- By Country
- United States
- Canada
- Mexico
List of Companies Covered in this Report:
- Belden Inc.
- The Siemon Company
- Corning Incorporated
- CommScope Inc.
- Anixter Inc.
- Legrand S.A.
- Panduit Corp.
- Schneider Electric SE
- Siemens AG
- Nexans S.A.
- Hubbell Incorporated
- Datwyler IT Infra GmbH
- Prysmian Group
- Superior Essex
- HellermannTyton
- Leviton Manufacturing Co., Inc.
- Reichle & De-Massari AG
- Fluke Networks
- Sterlite Technologies Limited
- ABB Ltd.
Additional Benefits:
- The market estimate (ME) sheet in Excel format
- 3 months of analyst support
TABLE OF CONTENTS
1 INTRODUCTION
- 1.1 Study Assumptions and Market Definition
- 1.2 Scope of the Study
2 RESEARCH METHODOLOGY
3 EXECUTIVE SUMMARY
4 MARKET LANDSCAPE
- 4.1 Market Overview
- 4.2 Market Drivers
- 4.2.1 Growing Expansion of Hyperscale Data Centers
- 4.2.2 Migration to Higher Bandwidth Category Cables
- 4.2.3 Increasing Fiber-To-The-Home and 5G Backhaul Deployments
- 4.2.4 Rising Adoption of Power over Ethernet for Smart Building Applications
- 4.2.5 Edge Data Center Proliferation in Tier-2 Cities
- 4.2.6 Federal Infrastructure Funding Incentives for Rural Broadband Cabling
- 4.3 Market Restraints
- 4.3.1 Rising Demand for High-Performance Wireless Solutions
- 4.3.2 Complex and Costly Installation in Brownfield Retrofits
- 4.3.3 Supply Chain Volatility of Copper and Optical Fiber Raw Materials
- 4.3.4 Skilled Labor Shortage in Certified Cabling Installers
- 4.4 Industry Value Chain Analysis
- 4.5 Regulatory Landscape
- 4.6 Technological Outlook
- 4.7 Impact of Macroeconomic Factors on the Market
- 4.8 Impact of COVID-19 on the North America Structured Cabling Market
- 4.9 Porter's Five Forces Analysis
- 4.9.1 Bargaining Power of Suppliers
- 4.9.2 Bargaining Power of Buyers
- 4.9.3 Threat of New Entrants
- 4.9.4 Threat of Substitutes
- 4.9.5 Intensity of Competitive Rivalry
- 4.10 Investment Analysis
5 MARKET SIZE AND GROWTH FORECASTS (VALUE)
- 5.1 By Product Type
- 5.1.1 Copper
- 5.1.1.1 Copper Cable
- 5.1.1.2 Copper Connectivity
- 5.1.2 Fiber
- 5.1.2.1 Fiber Cable (Single-mode)
- 5.1.2.2 Fiber Cable (Multi-mode)
- 5.1.2.3 Fiber Connectivity
- 5.1.1 Copper
- 5.2 By Cable Category
- 5.2.1 Category 5e
- 5.2.2 Category 6
- 5.2.3 Category 6A
- 5.2.4 Category 7
- 5.2.5 Category 8
- 5.3 By Component
- 5.3.1 Cables
- 5.3.2 Connectivity
- 5.3.3 Patch Panels and Cross Connects
- 5.3.4 Racks and Cabinets
- 5.3.5 Cable Management Accessories
- 5.4 By Application
- 5.4.1 LAN
- 5.4.2 Data Center
- 5.5 By End-User Industry
- 5.5.1 IT and Telecom
- 5.5.2 Banking, Financial Services, and Insurance (BFSI)
- 5.5.3 Government and Defense
- 5.5.4 Healthcare
- 5.5.5 Manufacturing
- 5.5.6 Commercial Buildings
- 5.6 By Installation Type
- 5.6.1 New Installation
- 5.6.2 Upgrade and Retrofit
- 5.7 By Country
- 5.7.1 United States
- 5.7.2 Canada
- 5.7.3 Mexico
6 COMPETITIVE LANDSCAPE
- 6.1 Market Concentration
- 6.2 Strategic Moves
- 6.3 Market Share Analysis
- 6.4 Company Profiles (includes Global Level Overview, Market Level Overview, Core Segments, Financials as available, Strategic Information, Market Rank/Share for key companies, Products and Services, and Recent Developments)
- 6.4.1 Belden Inc.
- 6.4.2 The Siemon Company
- 6.4.3 Corning Incorporated
- 6.4.4 CommScope Inc.
- 6.4.5 Anixter Inc.
- 6.4.6 Legrand S.A.
- 6.4.7 Panduit Corp.
- 6.4.8 Schneider Electric SE
- 6.4.9 Siemens AG
- 6.4.10 Nexans S.A.
- 6.4.11 Hubbell Incorporated
- 6.4.12 Datwyler IT Infra GmbH
- 6.4.13 Prysmian Group
- 6.4.14 Superior Essex
- 6.4.15 HellermannTyton
- 6.4.16 Leviton Manufacturing Co., Inc.
- 6.4.17 Reichle & De-Massari AG
- 6.4.18 Fluke Networks
- 6.4.19 Sterlite Technologies Limited
- 6.4.20 ABB Ltd.
7 MARKET OPPORTUNITIES AND FUTURE OUTLOOK
- 7.1 White-Space and Unmet-Need Assessment