|
시장보고서
상품코드
2119230
커뮤니티 성장 서비스 시장 : 시장 점유율 분석, 업계 동향 및 통계, 성장 예측(2026-2031년)Community Growth Services - Market Share Analysis, Industry Trends & Statistics, Growth Forecasts (2026 - 2031) |
||||||
 Mordor Intelligence
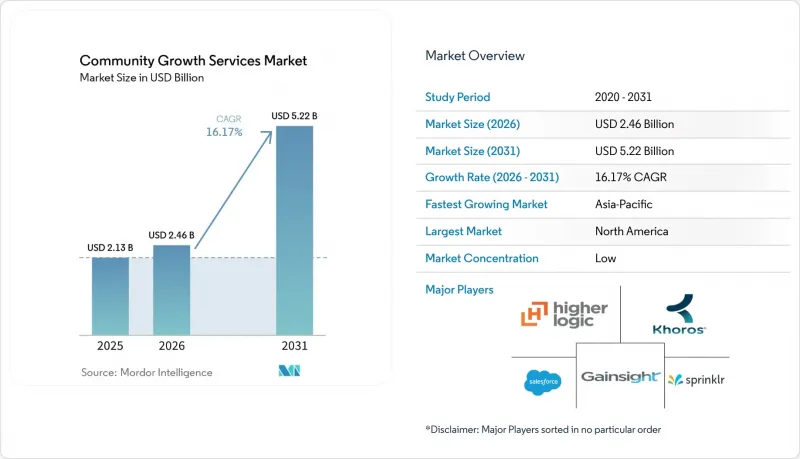
Mordor Intelligence에 의하면, 커뮤니티 성장 서비스 시장 규모는 2025년 21억 3,000만 달러로 평가되었고, 2026년에는 24억 6,000만 달러로 추정되고, 2031년까지 52억 2,000만 달러에 이를 것으로 예측되며, 2026-2031년 연평균 복합 성장률(CAGR)은 16.17%를 나타낼 전망입니다.
본 보고서는 서비스 유형별(커뮤니티 확보 서비스, 참여 유도 프로그램 서비스, 모더레이션 및 신뢰성 확보 서비스, 기타), 최종 사용자별(소프트웨어·기술, 미디어 및 출판, 전문 단체·회원 조직, 소비자 대상 브랜드·소매, 금융 서비스, 기타), 지역별로 분류되어 있습니다. 시장 전망은 금액(달러) 기준으로 제시되어 있습니다.
세계의 커뮤니티 성장 서비스 시장 동향 및 인사이트
고객 유지 주도 성장에 대한 기업의 관심 증가
고객 유지는 많은 소프트웨어 및 기술 기업에게 핵심 성장 지표로 자리 잡고 있으며, 프로그램 활동을 고객의 성과로 연결할 수 있는 커뮤니티 전문가에 대한 지속적인 수요를 창출하고 있습니다. 커뮤니티는 고객이 공식 지원 채널에만 의존하지 않고, 동종 업계 동료로부터 배우고, 문제를 해결하며, 공급업체의 제품과의 유대감을 심화할 수 있는 장을 제공합니다. Gainsight의 보고서에 따르면, 피어 투 피어(P2P) 해결책을 제공한 매우 활동적인 회원은 참여하지 않은 고객에 비해 해지할 가능성이 낮은 것으로 나타났습니다. 이러한 경향으로 인해 벤더 주도 환경 내에서 고객 관계, 실무 지식, 사용자 신뢰가 시간이 지남에 따라 축적되므로, 커뮤니티를 대체하기 어려워질 수 있습니다. Zoom과 Cognite는 Gainsight Customer Communities와 Skilljar를 활용하여 동료 간의 교류와 체계적인 학습을 결합하고, 계약 갱신 의사결정 과정에서 교육 및 지원의 활용을 강화했습니다. 따라서 커뮤니티 성장 서비스 시장에서는 프로그램 설계에 고객 유지 전략을 통합하고, 고객 성공 팀과 협력하며, 회원의 활동이 무엇을 의미하는지에 대한 공통된 인식을 확립하고, 연간 계약 검토 전에 결과를 보고하는 공급자가 높이 평가받습니다. 이를 통해 커뮤니티 프로그램을 독립적인 커뮤니케이션 활동이 아닌, 고객 관계의 일부로 자리매김하기가 쉬워집니다.
피어 지원 및 사례 전환에 대한 관심 증가
피어 지원은 공식 지원 팀으로 전달되는 사례의 양을 줄이고, 그로 인해 발생하는 비용 절감 효과를 재무 담당자와의 협의에서 설명하기 쉽게 함으로써 커뮤니티 예산을 지킬 수 있습니다. Salesforce는 피어 투 피어(peer-to-peer) 포럼이 일정 규모로 운영될 경우, 지원 티켓의 20%-28%를 방지할 수 있다고 밝혔습니다. Higher Logic의 방법론에서는 채택된 답변과 평균 티켓 비용을 통해 직접적인 비용 절감 효과를 측정하는 동시에, 향후 케이스 발생을 미연에 방지할 가능성이 있는 컨텐츠 페이지 뷰의 가치도 고려합니다. 이러한 접근 방식을 통해 재무 팀은 단일 부서 내부가 아닌 지원, 고객 성공, 제품 팀 전체에 가치를 제공하는 프로그램을 보다 명확하게 평가할 수 있게 됩니다. FeverBee의 보고서에 따르면, 체계적인 관리 및 마찰 완화 프로그램 도입을 통해 조직 내 AI 시스템의 커뮤니티 컨텐츠 검색률이 55% 향상되었다고 합니다. 커뮤니티 성장 서비스 시장에는 지원 비용 절감 외에도, 적절하게 관리된 지식, 명확한 컨텐츠 구조, 사내 AI의 출력 품질을 향상시킬 수 있는 실증 데이터를 결합한 제공업체를 위한 여지가 있습니다. 그 가치는 정확한 답변을 유지하고, 유용한 컨텐츠를 쉽게 찾을 수 있게 하며, 회원의 참여와 공식적인 컨텐츠 검토를 통해 지식 기반이 발전하는 과정에서 저품질 컨텐츠가 지식 기반에 영향을 미치기 전에 이를 제한하는 모더레이션 관행을 적용하는 데 달려 있기 때문입니다.
마케팅 예산이 정체된 상황에서 커뮤니티 ROI 입증
커뮤니티 프로그램은 특히 마케팅 예산이 정체된 상황에서 직접적이고 친숙한 성과 지표를 제공하는 채널과 자금 확보를 놓고 경쟁합니다. 그 가치는 지원 문의 감소, 고객 유지, 지지자 육성, 제품 피드백, 검색 가시성 등 다양한 측면에서 나타나기 때문에 많은 조직에서 단일 기여도 모델을 확립하기는 어렵습니다. Higher Logic은 직접적인 티켓 비용 절감은 ‘채택된 답변’과 ‘평균 티켓 비용’을 통해 측정할 수 있는 반면, 간접적인 비용 절감에는 프로그램 고유의 활동 가정이 필요하다고 설명합니다. 커뮤니티 네트워크는 회원 수나 컨텐츠가 충분한 규모에 도달한 후에 가장 높은 성과를 내는 경향이 있지만, 이는 짧은 예산 주기나 분기별 계획 수립에 대한 기대와 상충될 수 있습니다. 제공업체는 회원을 프로그램에 초대하기 전에 지표, 기준선,책임 소재, 기여도 산정 논리를 명확히 정의함으로써 이 문제를 완화할 수 있습니다. 제공업체가 측정을 운영상의 의사결정을 이끄는 핵심 서비스 요소가 아닌, 사후 보고 업무로만 간주한다면 커뮤니티 성장 서비스 시장은 여전히 취약한 상태에 머물게 됩니다. 왜냐하면 합의된 출발점이나 정기적인 보고 프로세스가 없다면, 팀은 참여 현황, 지원 활동 또는 유지율의 변화가 서비스 프로그램과 관련이 있는지, 또한 보고된 결과가 향후 예산 결정에 활용될 수 있는지 설명하는 데 어려움을 겪을 가능성이 있기 때문입니다.
부문 분석
2025년, 커뮤니티 성장 서비스 시장의 매출액 중 38.27%를 커뮤니티 확보 서비스가 차지했습니다. 이러한 주도적인 위상은 참여 유도, 관리, 옹호 서비스가 성과를 내기 전에 회원 기반을 확립해야 한다는 점을 반영합니다. 유치 프로그램에는 온보딩 프로세스, 회원에 대한 가치 제안, 초기 활성화 유도 방안 등이 포함됩니다. 이러한 활동에는 일반 마케팅 대행사가 제공할 수 없는 전용 커뮤니티 계획이 필요하기 때문에 기업들은 종종 외부 전문가를 찾습니다.
직원 옹호 프로그램은 2026-2031년 참여 프로그램 서비스 분야에서 연평균 성장률(CAGR) 17.28%로 확대될 것으로 예측됩니다. DSMN8의 보고서에 따르면, 2026년에는 옹호자의 68%가 주당 3회 이상 게시물을 올렸으며, 이는 전년 대비 13포인트 증가한 수치입니다. Sprinklr에 따르면, 로레알(L'Oreal)의 옹호자 프로그램은 900명 이상의 앰배서더를 기용하여 18개월 동안 3,300만 회 이상의 유기적 노출을 창출했으며, 투자 수익률(ROI)은 4배에 달했다고 합니다. 합성 컨텐츠나 대규모 커뮤니티에는 보다 전문적인 모니터링이 필요하기 때문에 ‘모더레이션 및 신뢰성 확보 서비스’의 중요성이 높아지고 있습니다. 또한 ‘커뮤니티 이벤트 및 체험 서비스’도 연례 총회에 그치지 않고, 이벤트 기획, 플랫폼 관리, 물류에 이르는 지속적인 노력을 뒷받침하고 있습니다. 이러한 서비스 전반에 걸쳐, 커뮤니티 성장 서비스 산업은 커뮤니티 성장 서비스 시장에서 보다 장기적인 계약과 더 높은 서비스 가치를 뒷받침할 수 있는 지속적 관리형 서비스(Managed Delivery)로 전환되고 있습니다.
지역별 분석
2025년, 북미는 커뮤니티 성장 서비스 시장 점유율의 48.04%를 차지했습니다. 이 지역에는 SaaS 기업, 엔터프라이즈 구매자, 커뮤니티 플랫폼 벤더가 집중되어 있습니다. 이러한 근접성으로 인해 전문적인 실무 기법, 도구, 조달 접근 방식의 공유가 촉진되고 있습니다. 미국은 여전히 주요 기여국으로, Gainsight, Higher Logic, Bevy, Khoros, Influitive와 같은 기업들이 성장 단계의 SaaS 기업부터 포춘 500대 기업에 이르는 구매자들에게 서비스를 제공합니다. 한편, 캐나다는 핀테크 및 SaaS 부문을 통해 수요를 확대되고 있습니다.
유럽은 두 번째로 큰 지역 시장이며, 영국, 독일, 프랑스, 북유럽 국가들이 주도적인 역할을 하고 있습니다. ‘디지털 서비스법(Digital Services Act)’은 유럽 전역의 커뮤니티 거버넌스, 컨텐츠 관리, 데이터 처리 요건에 영향을 미치고 있습니다. 독일과 북유럽 국가에서는 지식 교환 및 동종 업계 전문가에 의한 검증을 지원하는 전문 단체나 B2B 프로그램에 대한 수요가 나타나고 있습니다. 프랑스의 소프트웨어 생태계에서는 조직들이 커뮤니티 운영을 커뮤니티 성장 서비스 시장 내의 독립적인 사업 기능으로 인식함에 따라 커뮤니티에 대한 투자가 증가하고 있습니다. 남미 수요는 브라질을 중심으로 하며, 그 뒤를 아르헨티나와 콜롬비아가 따릅니다. 이들 국가에서는 디지털 전환에 힘입어 커뮤니티 성장 서비스 시장에서 초기 단계의 기업용 프로그램이 출범하고 있습니다.
아시아태평양은 2026-2031년 연평균 성장률(CAGR) 17.04%로 확대될 것으로 예측되며, 가장 빠르게 성장하는 지역이 될 전망입니다. 인도와 동남아시아에서는 SaaS 도입이 진행되고 있으며, 해당 지역의 커뮤니티 성장 서비스 시장 전반에서 전문 단체 네트워크가 확대되고 있습니다. 이 지역의 SaaS 기업들은 현지 사용자와 전 세계 고객 기반 모두에게 서비스를 제공하는 커뮤니티 프로그램을 구축하고 있습니다. 고객의 기대치와 프로그램 성숙도에 따른 지역적 차이로 인해, 현지 시장 운영 상황에 적응할 수 있는 서비스 모델에 대한 수요가 발생하고 있습니다. 인도에서는 전 세계 고객에게 서비스를 제공하는 SaaS 스타트업과 IT 서비스 기업이 활약하고 있는 반면, 한국과 싱가포르는 엔터프라이즈 플랫폼을 조기에 도입한 국가로 자리매김하고 있습니다. 중동 및 아프리카는 여전히 초기 단계에 있지만, 아랍에미리트, 사우디아라비아, 남아프리카공화국은 각국의 디지털 전환 프로그램 하에서 주요 수요 거점으로 기능하고 있습니다.
기타 혜택
- 엑셀 형식 시장 예측(ME) 시트
- 3개월간의 애널리스트 지원
자주 묻는 질문
목차
제1장 서론
제2장 조사 방법
제3장 주요 요약
제4장 시장 구도
제5장 시장 규모 및 성장 예측
제6장 경쟁 구도
제7장 시장 기회 및 향후 전망
AJYAccording to Mordor Intelligence, the community growth services market size is projected to expand from USD 2.13 billion in 2025 to USD 2.46 billion in 2026, and to USD 5.22 billion by 2031, registering a CAGR of 16.17% between 2026 and 2031.
This report is Segmented by Service Type (Community Acquisition Services, Engagement Program Services, Moderation and Trust Services, and More), End User (Software and Technology, Media and Publishing, Professional Associations and Membership Organizations, Consumer Brands and Retail, Financial Services, and More), and Geography. The Market Forecasts are Provided in Terms of Value (USD).
Global Community Growth Services Market Trends and Insights
Rising Enterprise Focus on Retention-Led Growth
Retention has become a central growth metric for many software and technology companies, creating sustained demand for community specialists who can connect program activity to customer outcomes. A community gives customers a place to learn from peers, resolve issues, and build closer ties to a vendor's products without relying solely on formal support channels. Gainsight reported that highly active members who contributed peer-to-peer solutions were less likely to churn than customers who did not participate. This pattern can make a community harder to replace because customer relationships, practical knowledge, and user confidence accumulate over time within a vendor-led environment. Zoom and Cognite used Gainsight Customer Communities and Skilljar to link peer access with structured learning, which strengthened the use of education and support during renewal decisions. The community growth services market, therefore, rewards providers that build retention measures into program design, align them with customer success teams, establish a common account of what member activity means, and report results before annual contract reviews, making the community program easier to position as part of the customer relationship instead of a separate communications activity.
Growing Preference for Peer Support and Case Deflection
Peer support can protect community budgets by reducing the volume of cases sent to formal support teams and making the resulting savings easier to discuss with finance leaders. Salesforce stated that peer-to-peer forums can deflect 20%-28% of support tickets when they operate at scale. Higher Logic's method measures direct savings through accepted answers and average ticket cost, while also considering the value of content page views that may prevent future cases. This approach gives finance teams a clearer way to assess a program that creates value across support, customer success, and product teams, rather than within a single department. FeverBee reported that a structured moderation and friction program increased the retrieval of community content by organizational AI systems by 55%. The community growth services market has room for providers that combine support savings with well-governed knowledge, clearer content structures, and evidence that can improve internal AI outputs, because the value depends on maintaining accurate answers, making useful content easy to find, and applying moderation practices that limit low-quality material before it affects the knowledge base as it develops through member participation and formal content review.
Proving Community ROI Under Flat Marketing Budgets
Community programs compete for funding with channels that offer direct and familiar performance measures, particularly when marketing budgets are flat. Their value can appear across support deflection, retention, advocacy, product feedback, and search visibility, which makes a single attribution model difficult for many organizations to establish. Higher Logic explains that direct ticket savings can be measured by accepted answers and the average ticket cost, while indirect savings require program-specific activity assumptions. Community networks often produce their strongest results after members and content reach sufficient scale, which can conflict with short budget cycles and quarterly planning expectations. Providers can reduce this issue by defining metrics, baselines, ownership, and attribution logic before inviting members into a program. The community growth services market remains exposed when providers present measurement as a later reporting task instead of a core service component that guides operational decisions, since without an agreed starting point and regular reporting process, teams can struggle to explain whether changes in participation, support activity, or retention are linked to the service program and whether reported results can be used in future budget decisions.
Other drivers and restraints analyzed in the detailed report include:
- AI-Enabled Personalization and Community Operations
- Expansion of Hybrid Events and Always-On Member Experiences
- Data Privacy, Compliance, and Brand Safety Burdens
For complete list of drivers and restraints, kindly check the Table Of Contents.
Segment Analysis
Community Acquisition Services accounted for 38.27% of revenue in 2025 within the community growth services market. The leading position reflects the need to establish a member base before engagement, moderation, and advocacy services can deliver results. Acquisition programs cover onboarding journeys, member value propositions, and early activation triggers. Enterprises often seek external specialists because these activities require dedicated community planning that general marketing agencies may not provide.
Employee Advocacy Programs are projected to expand at a 17.28% CAGR within Engagement Program Services between 2026 and 2031. DSMN8 reported that 68% of advocates shared 3 or more times each week in 2026, an increase of 13 percentage points from the prior year. Sprinklr stated that L'Oreal's advocacy program generated more than 33 million organic impressions and a 4x return on investment across 18 months with more than 900 ambassadors. Moderation and Trust Services are gaining relevance as synthetic content and larger communities require more specialized oversight. Community Events and Experience Services are also extending beyond annual meetings, which supports ongoing work across event design, platform administration, and logistics. Across these services, the community growth services industry is moving toward continuous managed delivery that can support longer contracts and higher service value in the community growth services market.
Complete Report Scope:
- By Service Type
- Community Acquisition Services
- Engagement Program Services
- Moderation and Trust Services
- Community Events and Experience Services
- By End User
- Software and Technology
- Media and Publishing
- Professional Associations and Membership Organizations
- Consumer Brands and Retail
- Financial Services
- Healthcare and Life Sciences
- Education
- Other End Users
- By Geography
- North America
- United States
- Canada
- Mexico
- South America
- Brazil
- Argentina
- Colombia
- Chile
- Rest of South America
- Europe
- Germany
- United Kingdom
- France
- Italy
- Spain
- Russia
- Netherlands
- Nordics
- Rest of Europe
- Asia-Pacific
- China
- Japan
- India
- South Korea
- Australia
- Singapore
- Indonesia
- Rest of Asia-Pacific
- Middle East
- Saudi Arabia
- United Arab Emirates
- Turkey
- Israel
- Rest of Middle East
- Africa
- South Africa
- Nigeria
- Kenya
- Egypt
- Rest of Africa
- North America
Geography Analysis
North America held 48.04% of the community growth services market share in 2025. The region has a large concentration of SaaS businesses, enterprise buyers, and community platform vendors. Their proximity has supported shared professional practices, tools, and procurement approaches. The United States remains the main contributor, with Gainsight, Higher Logic, Bevy, Khoros, and Influitive serving buyers from growth-stage SaaS companies to Fortune 500 enterprises, while Canada is adding demand through its financial technology and SaaS sectors.
Europe is the second-largest regional market, led by the United Kingdom, Germany, France, and the Nordic countries. The Digital Services Act has affected community governance, moderation, and data handling requirements across Europe. Germany and the Nordic countries show demand for professional associations and B2B programs that support knowledge exchange and peer validation. France's software ecosystem is increasing community investment as organizations recognize community operations as a distinct business function within the community growth services market. South American demand is centered on Brazil, followed by Argentina and Colombia, where digital transformation is creating early enterprise programs in the community growth services market.
Asia-Pacific is projected to expand at a CAGR of 17.04% between 2026 and 2031, making it the fastest-growing region. India and Southeast Asia are increasing SaaS adoption, while professional association networks are expanding across the community growth services market in the region. SaaS companies in the region are building community programs that serve both local users and global customer bases. Regional differences in customer expectations and program maturity create demand for service models that can adapt to local market operating conditions. India benefits from SaaS startups and IT services firms serving global customers, while South Korea and Singapore are early adopters of enterprise platforms. The Middle East and Africa remain at earlier stages, with the UAE, Saudi Arabia, and South Africa acting as key demand centers under national digital transformation programs.
- FeverBee Limited
- Bevy Labs, Inc.
- CMX Media, Inc.
- Commsor, Inc.
- Orbit Marketing Inc.
- Common Room, Inc.
- Higher Logic, LLC
- Khoros, LLC
- Hivebrite SAS
- Gainsight, Inc.
- Discourse Hosting, Inc.
- Bettermode Inc.
- Mighty Networks, Inc.
- Mobilize Networks, Inc.
- Influitive Corporation
- Zapnito Ltd.
- Disciple Media Ltd.
- Standing On Giants Ltd
- The Community Roundtable LLC
- Clocktower Advisors LLC
Additional Benefits:
- The market estimate (ME) sheet in Excel format
- 3 months of analyst support
TABLE OF CONTENTS
1 INTRODUCTION
- 1.1 Study Assumptions and Market Definition
- 1.2 Scope of the Study
2 RESEARCH METHODOLOGY
3 EXECUTIVE SUMMARY
4 MARKET LANDSCAPE
- 4.1 Market Overview
- 4.2 Market Drivers
- 4.2.1 Rising Enterprise Focus on Retention-Led Growth
- 4.2.2 Growing Preference for Peer Support and Case Deflection
- 4.2.3 AI-Enabled Personalization and Community Operations
- 4.2.4 Expansion of Hybrid Community Events and Always-On Member Experiences
- 4.2.5 Owned Communities Becoming a Hedge Against Zero-Click Discovery and Algorithm Volatility
- 4.2.6 First-Party Interaction Data Becoming Strategic Training Fuel for AI-Led Go-to-Market Systems
- 4.3 Market Restraints
- 4.3.1 Proving Community ROI Under Flat Marketing Budgets
- 4.3.2 Data Privacy, Compliance, and Brand Safety Burdens
- 4.3.3 Higher Moderation Cost from Online Safety Rules and Synthetic Abuse Risk
- 4.3.4 Fragmented Tool Stacks and Attribution Blind Spots Across Community, CRM, and Event Data
- 4.4 Industry Value Chain Analysis
- 4.5 Impact of Macroeconomic Factors on the Market
- 4.6 Regulatory Landscape
- 4.7 Technological Outlook
- 4.8 Porter's Five Forces Analysis
- 4.8.1 Threat of New Entrants
- 4.8.2 Bargaining Power of Buyers
- 4.8.3 Bargaining Power of Suppliers
- 4.8.4 Threat of Substitutes
- 4.8.5 Intensity of Competitive Rivalry
5 MARKET SIZE AND GROWTH FORECASTS (VALUE)
- 5.1 By Service Type
- 5.1.1 Community Acquisition Services
- 5.1.2 Engagement Program Services
- 5.1.3 Moderation and Trust Services
- 5.1.4 Community Events and Experience Services
- 5.2 By End User
- 5.2.1 Software and Technology
- 5.2.2 Media and Publishing
- 5.2.3 Professional Associations and Membership Organizations
- 5.2.4 Consumer Brands and Retail
- 5.2.5 Financial Services
- 5.2.6 Healthcare and Life Sciences
- 5.2.7 Education
- 5.2.8 Other End Users
- 5.3 By Geography
- 5.3.1 North America
- 5.3.1.1 United States
- 5.3.1.2 Canada
- 5.3.1.3 Mexico
- 5.3.2 South America
- 5.3.2.1 Brazil
- 5.3.2.2 Argentina
- 5.3.2.3 Colombia
- 5.3.2.4 Chile
- 5.3.2.5 Rest of South America
- 5.3.3 Europe
- 5.3.3.1 Germany
- 5.3.3.2 United Kingdom
- 5.3.3.3 France
- 5.3.3.4 Italy
- 5.3.3.5 Spain
- 5.3.3.6 Russia
- 5.3.3.7 Netherlands
- 5.3.3.8 Nordics
- 5.3.3.9 Rest of Europe
- 5.3.4 Asia-Pacific
- 5.3.4.1 China
- 5.3.4.2 Japan
- 5.3.4.3 India
- 5.3.4.4 South Korea
- 5.3.4.5 Australia
- 5.3.4.6 Singapore
- 5.3.4.7 Indonesia
- 5.3.4.8 Rest of Asia-Pacific
- 5.3.5 Middle East
- 5.3.5.1 Saudi Arabia
- 5.3.5.2 United Arab Emirates
- 5.3.5.3 Turkey
- 5.3.5.4 Israel
- 5.3.5.5 Rest of Middle East
- 5.3.6 Africa
- 5.3.6.1 South Africa
- 5.3.6.2 Nigeria
- 5.3.6.3 Kenya
- 5.3.6.4 Egypt
- 5.3.6.5 Rest of Africa
- 5.3.1 North America
6 COMPETITIVE LANDSCAPE
- 6.1 Market Concentration
- 6.2 Strategic Moves
- 6.3 Market Share Analysis
- 6.4 Company Profiles (includes Global Level Overview, Market Level Overview, Core Segments, Financials as available, Strategic Information, Market Rank/Share, Products and Services, Recent Developments)
- 6.4.1 FeverBee Limited
- 6.4.2 Bevy Labs, Inc.
- 6.4.3 CMX Media, Inc.
- 6.4.4 Commsor, Inc.
- 6.4.5 Orbit Marketing Inc.
- 6.4.6 Common Room, Inc.
- 6.4.7 Higher Logic, LLC
- 6.4.8 Khoros, LLC
- 6.4.9 Hivebrite SAS
- 6.4.10 Gainsight, Inc.
- 6.4.11 Discourse Hosting, Inc.
- 6.4.12 Bettermode Inc.
- 6.4.13 Mighty Networks, Inc.
- 6.4.14 Mobilize Networks, Inc.
- 6.4.15 Influitive Corporation
- 6.4.16 Zapnito Ltd.
- 6.4.17 Disciple Media Ltd.
- 6.4.18 Standing On Giants Ltd
- 6.4.19 The Community Roundtable LLC
- 6.4.20 Clocktower Advisors LLC
7 MARKET OPPORTUNITIES AND FUTURE OUTLOOK
- 7.1 White-Space and Unmet-Need Assessment