

|
시장보고서
상품코드
2119275
물리적 AI 생태계 : 시장 점유율 분석, 업계 동향 및 통계, 성장 예측(2026-2031년)Physical AI Ecosystem - Market Share Analysis, Industry Trends & Statistics, Growth Forecasts (2026 - 2031) |
||||||
 Mordor Intelligence
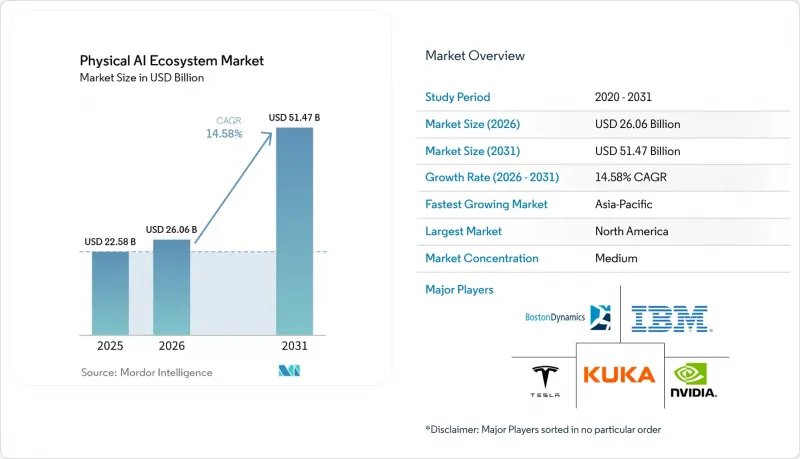
Mordor Intelligence에 의하면, 물리적 AI 생태계 시장 규모는 2025년 225억 8,000만 달러로 평가되었습니다. 2026년 260억 6,000만 달러에서 2031년까지 514억 7,000만 달러로 확대되며 2026년부터 2031년까지 연평균 성장률(CAGR)은 14.58%를 나타낼 전망입니다.
본 보고서는 구성 요소(하드웨어, 소프트웨어, 서비스), 로봇의 유형 및 형태(산업용 로봇, 업무용 서비스 로봇, 개인·가정용 서비스 로봇 등), 도입 형태(온디바이스, 클라우드 기반, 하이브리드), 최종 사용자 업종(물류·공급망, 제조, 의료 등), 그리고 지역별로 분류되어 있습니다. 시장 전망은 금액(달러) 기준으로 제시되어 있습니다.
세계의 물리적 AI 생태계 시장 동향 및 인사이트
실시간 자율 작동을 위한 저지연 엣지 추론
물리적 AI 생태계 시장에서는 로봇이 사람이나 설비, 혹은 이동 중인 자재 근처에서 작동할 때 신속한 로컬 의사 결정이 요구됩니다. 원격 클라우드 연결에서는 지연이 발생할 가능성이 있어, 자동차 생산 라인, 병원 복도, 혹은 혼잡한 창고 내의 이동 기계 등에는 적합하지 않습니다. NVIDIA는 2025년 8월, Blackwell을 탑재한 ‘Jetson Thor’의 일반 공급을 시작했습니다. 이 제품은 130와트의 전력 소비 범위 내에서 최대 2,070 FP4 테라플롭스의 AI 연산 성능을 구현하며, 개발자 키트 가격은 3,499달러입니다. 회사에 따르면, 이전 세대 모델에 비해 AI 연산 성능은 7.5배, 에너지 효율은 3.5배 향상되었습니다. 이러한 사양 덕분에, 엄격한 작동 시간 제한 내에서 응답이 요구되는 기기에서 엣지 추론이 설계상의 핵심적인 선택지가 되고 있습니다. 따라서 로봇에 특화된 추론 스택을 보유하지 않은 공급업체는 물리적 AI 도입 분야에서 입지를 유지할 기회가 줄어들 가능성이 있습니다.
비정형 물리적 작업에서의 인력 부족
많은 어려운 작업은 기존의 자동화로는 제대로 대응하기 어려운 환경에서 이루어지기 때문에 인력 제약이 물리적 AI 생태계 시장 수요를 뒷받침하고 있습니다. 여전히 남아 있는 과제로는 불규칙한 형태의 화물 피킹, 다품종 혼재 라인에서의 변동 대응, 그리고 습기 찬·폐쇄적·예측 불가능한 공간에서의 작업 등이 있습니다. 이러한 작업들은 상업적 시급성과 물리적 AI 모델을 개선하는 데 필요한 운영 데이터를 모두 갖추고 있습니다. 이러한 인력 부족은 공장 업무에 그치지 않고, 물류, 의료 지원, 건설, 현장 작업에서도 다양한 물리적 작업을 수행하기 위해 노동자에 의존하고 있습니다. 이러한 환경에서는 레이아웃이나 대상물의 변화에 대응할 수 있는 시스템이 고정식 자동화보다 유용할 가능성이 있습니다. 충족되지 않은 노동 수요와 기술적 진보 사이의 이러한 일치는 현장 수준에서 안전하게 운영할 수 있는 실용적인 도입의 가치를 높이고 있습니다.
높은 도입 비용과 긴 가동 개시까지의 기간
물리적 AI 생태계 시장은 도입 비용이 로봇 구매비에만 그치지 않기 때문에 단기적인 제약에 직면해 있습니다. 통합 서비스, 소프트웨어 맞춤화, 안전 점검, 운영자 교육, 워크플로우 변경 등이 초기 예산에 상당한 추가 비용 요인이 될 수 있습니다. 복잡한 제조 프로젝트의 경우, 시뮬레이션에 반영되지 않은 가동 조건에 맞추어 시스템을 조정해야 할 때, 당초 일정을 12-18개월 초과할 수 있습니다. 중소기업은 통합 경험이나 프로젝트 예산 초과를 감당할 재무 능력이 부족할 가능성이 있으므로, 특히 이러한 위험에 노출되어 있습니다. 또한 시운전 기간이 길어지면, 공급업체가 로봇의 동작을 최적화하는 데 필요한 운영 데이터 확보도 지연됩니다. 따라서 설정을 간소화하거나, 서비스 범위를 확대하거나, 현장 특유의 엔지니어링 작업을 줄이는 상용 모델은 큰 우위를 점한다고 할 수 있습니다.
부문별 분석
2025년 물리적 AI 생태계 시장에서 하드웨어가 시장 점유율의 71.08%를 차지했습니다. 이는 모든 구현된 시스템에 센서, 액추에이터, 매니퓰레이터, 프로세서 및 전원 장치가 필요하기 때문입니다. 산업용 로봇과 이동 플랫폼은 여전히 자본 집약적이기 때문에 프로젝트 지출의 대부분을 하드웨어 BOM(부품 명세서)이 차지하고 있습니다. 신뢰성, 적재 중량, 동작 정밀도, 가동 시간 및 환경 적합성은 여전히 하드웨어 중심의 고려 사항입니다. 이러한 요구 사항으로 인해 플랫폼 선정은 도입 결정의 핵심이 되며, OEM, 통합업체, 최종 사용자 간의 관계를 유지하고 있습니다. 물리적 AI 생태계 시장은 운영 기간 동안 유지보수, 지원, 적응이 가능한 장비에 의해 뒷받침되고 있습니다.
소프트웨어 시장은 2031년까지 연평균 성장률(CAGR) 16.32%를 나타낼 것으로 예측되며, 이는 구성 요소 중 가장 높은 성장률입니다. 범용 기반 모델, 플릿 오케스트레이션 도구, 시뮬레이션 환경, 디지털 트윈 플랫폼은 로봇에 내장된 기능이 아닌 독립적인 수익원으로 판매될 수 있습니다. NVIDIA는 GTC 2026에서 GR00T N1.7의 조기 상용화를 발표하며, 모델 소프트웨어를 독립적인 상용 계층으로 자리매김하려는 움직임을 보였습니다. 또한, 여러 OEM이 운영하는 플릿에는 시운전, 훈련, 최적화 및 지속적인 지원이 필요하기 때문에 서비스 역시 여전히 중요합니다. ISO/IEC TR 5469 : 2024의 제정으로 인해 AI의 기능 안전성 평가 및 관련 전문 서비스에 대한 추가적인 수요가 발생하고 있습니다.
2025년 시점에서 산업용 로봇은 물리적 AI 생태계 시장 규모의 44.59%를 차지했습니다. 이러한 우위는 자동차, 전자, 금속 생산과 같은 분야의 실적으로 뒷받침되며, 이들 분야에서는 수년에 걸쳐 신뢰성과 재현성이 높은 작동이 입증되어 왔습니다. 국제로봇연맹(IFR)의 기록에 따르면, 2024년 전 세계 산업용 로봇 도입 대수는 54만 2,000대에 달하고, 10년 전 수준의 2배 이상을 기록했습니다. 신규 도입 대수의 74%를 아시아가 차지했으며, 중국에서는 29만 5,000대가 도입되어 전 세계 가동 대수는 466만 4,000대에 달했습니다. 이러한 도입 실적은 산업용 플랫폼에 AI 기능을 추가하기 위한 실질적인 기반을 제공합니다.
개인용 및 가정용 서비스 로봇은 2031년까지 연평균 성장률(CAGR) 17.04%를 나타낼 것으로 예측됩니다. 소비자 환경에서는 사람, 사물, 공간 배치, 그리고 변화하는 상황과의 다양한 상호작용이 발생하여 모델 개발을 위한 폭넓은 데이터를 제공할 수 있습니다. 업무용 서비스 로봇은 수술, 검사, 물류, 현장 작업 등의 분야에서도 활용되고 있으며, AI 도입을 통해 업무의 유연성이 더욱 높아질 것으로 기대됩니다. 1X Technologies는 캘리포니아주 헤이워드에 위치한 ‘NEO Factory’에서 생산을 시작했으며, 2026년부터는 일반 가정용으로 연간 1만 대의 초기 생산 능력을 계획하고 있습니다. 파낙(FANUC)사는 2025년 12월 제품 출시 이후, 물리적 AI 관련 용도로 1,000대 이상의 로봇을 출하했다고 보고했습니다.
지역별 분석
2025년, 북미는 물리적 AI 생태계 시장 점유율의 35.47%를 차지했습니다. 이 지역에는 AI 네이티브 로봇 기업들이 집중되어 있으며, 기업들의 막대한 투자 능력과 더불어 생산 설비의 유연성에 대한 수요를 높이는 리쇼어링 활동이 맞물려 시장이 형성되고 있습니다. 미국의 로봇 도입 대수는 2년간의 감소세를 거쳐 2025년에 회복되었으며, 식품 생산, 창고, 물류 분야가 이러한 회복을 주도했습니다. 2024년 기준, 북미 제조업 종사자 1만 명당 로봇 도입 대수는 204대였습니다. 이는 서유럽의 267대나 한국의 1,220대보다 낮은 수치로, 자동화 밀도를 더욱 높일 여지가 있습니다.
아시아태평양은 2031년까지 연평균 성장률(CAGR) 18.76%로 확대될 것으로 예측되며, 이는 물리적 AI 생태계 시장에서 지역별 가장 높은 성장률입니다. 중국은 이 지역 산업용 로봇의 중심지로, 2024년 도입 대수는 29만 5,000대에 달하며, 국내 제조업체가 국내 로봇 시장의 57%를 차지했습니다. 일본과 한국은 국내 물리적 AI 프로그램을 통해 이러한 강점을 확대하고 있으며, 한국은 2026년 2월 물리적 AI를 ‘K-문샷’의 주요 미션 중 하나로 지정했습니다. 한국은 자동차, 정밀 제조, 조선 분야를 대상으로 KAIST(한국과학기술원)에 국내 물리적 AI 통합 플랫폼을 도입했습니다. 인도는 이 지역의 산업용 로봇 시장에서 중국을 보완하는 존재로, 2024년에는 9,100대의 도입을 기록하며 생산 장려 프로그램과 연계된 제조 자동화 투자를 유치했습니다.
유럽은 2025년, 확립된 도입 기반, 정평이 나 있는 자동화 공급업체, 그리고 서유럽의 제조업 종사자 1만 명당 267대라는 로봇 밀도에 힘입어 지역별 2위를 차지했습니다. 2024년, 독일은 유럽 연간 로봇 도입 대수의 32%를 차지했으나, 같은 해 자동차 업계의 침체로 인해 유럽 전체 도입 대수는 8% 감소했습니다. 유럽연합(EU)의 ‘기계 규정’ 및 ‘사이버 복원력 법’은 커넥티드 로봇의 조달 요건을 규정하고 있습니다. 중동에서는 건설, 에너지, 물류 분야에서 로봇 기술이 발전하고 있는 반면, 아프리카와 남미는 여전히 광업 및 농업에 중점을 둔 초기 단계의 지역에 머물러 있습니다.
기타 혜택 :
- 엑셀 형식 시장 예측(ME) 시트
- 3개월간의 애널리스트 지원
자주 묻는 질문
목차
제1장 서론
제2장 조사 방법
제3장 개요
제4장 시장 구도
제5장 시장 규모 및 성장 예측
제6장 경쟁 구도
제7장 시장 기회 및 향후 전망
KTH 26.09.02According to Mordor Intelligence, the physical AI ecosystem market size is projected to expand from USD 22.58 billion in 2025 and USD 26.06 billion in 2026 to USD 51.47 billion by 2031, registering a CAGR of 14.58% between 2026 to 2031.
This report is Segmented by Component (Hardware, Software, and Services), Robot Type and Embodiment (Industrial Robots, Professional Service Robots, Personal and Household Service Robots, and More), Deployment (On-Device, Cloud-Based, and Hybrid), End-User Vertical (Logistics and Supply Chain, Manufacturing, Healthcare, and More), and Geography. The Market Forecasts are Provided in Terms of Value (USD).
Global Physical AI Ecosystem Market Trends and Insights
Low-Latency Edge Inference for Real-Time Autonomy
The physical AI ecosystem market requires fast local decisions when robots operate near people, equipment, or moving materials. A remote cloud connection can introduce delays that are unsuitable for an automotive line, a hospital corridor, or a mobile machine in a busy warehouse. NVIDIA made its Blackwell-powered Jetson Thor generally available in August 2025, with up to 2,070 FP4 teraflops of AI compute in a 130-watt power envelope and a USD 3,499 developer kit price. The company reported 7.5 times higher AI compute and 3.5 times greater energy efficiency than its predecessor. These specifications make edge inference a core design choice for equipment that must respond within a tight operational window. Suppliers without robot-focused inference stacks may therefore face a narrower opportunity to remain relevant in physical AI deployments.
Labor Scarcity in Unstructured Physical Work
Labor constraints support demand in the physical AI ecosystem market because many difficult jobs take place in settings that conventional automation does not handle well. The remaining gaps include picking nonuniform parcels, managing variation across mixed-product lines, and working in wet, confined, or unpredictable spaces. These tasks combine commercial urgency with the type of operating data needed to improve physical AI models. The shortage is not limited to factory roles, as logistics, healthcare support, construction, and field operations also depend on workers to perform varied physical tasks. A system that can adjust to changing layouts or objects can be more useful than fixed automation in these settings. This alignment between unmet labor needs and technical progress increases the value of practical deployments that can be operated safely at the site level.
High Integration Cost and Long Commissioning Cycles
The physical AI ecosystem market faces a near-term constraint because deployment costs extend beyond the robot purchase. Integration services, software customization, safety checks, operator training, and workflow changes can add materially to the initial budget. Complex manufacturing projects can require 12 to 18 months beyond original timelines when systems must be tuned to operating conditions not reflected in simulation. Small and midsize enterprises are particularly exposed because they may lack the integration experience and financial capacity to absorb project overruns. Long commissioning cycles also delay the availability of the operating data that vendors need to refine robot behavior. Commercial models that simplify setup, improve service coverage, or reduce site-specific engineering can therefore have a meaningful advantage.
Other drivers and restraints analyzed in the detailed report include:
- Flexible Automation in Logistics and Manufacturing
- Sim-to-Real Digital Twin Pipelines
- Certification, Liability, and Functional Safety Complexity
For complete list of drivers and restraints, kindly check the Table Of Contents.
Segment Analysis
Hardware accounted for 71.08% of the physical AI ecosystem market share in 2025 because every embodied system requires sensors, actuators, manipulators, processors, and power equipment. Industrial robots and mobile platforms remain capital-intensive, so the hardware bill of materials accounts for much of project spending. Reliability, payload, motion precision, operating duration, and environmental fit remain hardware-led considerations. These requirements make platform selection central to deployment decisions and sustain relationships between OEMs, integrators, and end users. The physical AI ecosystem market remains anchored in equipment that can be serviced, supported, and adapted over its operating life.
Software is projected to grow at a 16.32% CAGR through 2031, the highest rate among components. World foundation models, fleet orchestration tools, simulation environments, and digital twin platforms can be sold as separate revenue layers rather than embedded robot features. NVIDIA introduced GR00T N1.7 in early commercial access at GTC 2026, indicating a move toward model software as a distinct commercial layer. Services also remain important because multi-OEM fleets need commissioning, training, optimization, and continuing support. ISO/IEC TR 5469:2024 creates an additional need for AI functional safety evaluation and related specialist services.
Industrial robots accounted for 44.59% of the physical AI ecosystem market size in 2025. Their lead reflects proven use in automotive, electronics, and metals production, where reliability and repeatable motion have been demonstrated over time. The International Federation of Robotics recorded 542,000 global industrial robot installations in 2024, more than twice the level of 10 years earlier. Asia accounted for 74% of new installations, while China installed 295,000 units, and global operational stock reached 4,664,000 units. This installed base gives industrial platforms a practical foundation for adding AI capabilities.
Personal and household service robots are expected to grow at a 17.04% CAGR through 2031. Consumer settings create varied interactions with people, objects, layouts, and changing conditions that can provide broad data for model development. Professional service robots also support surgery, inspection, logistics, and field applications, where AI can extend task flexibility. 1X Technologies began production at its NEO Factory in Hayward, California, with an initial annual capacity of 10,000 units intended for home users from 2026. FANUC reported that it had shipped more than 1,000 robots for physical AI-related applications after its December 2025 product launch.
Complete Report Scope:
- By Component
- Hardware
- Software
- Services
- By Robot Type and Embodiment
- Industrial Robots
- Professional Service Robots
- Personal and Household Service Robots
- Other Robot Type and Embodiments
- By Deployment
- On-Device
- Cloud-Based
- Hybrid
- By End-User Vertical
- Logistics and Supply Chain
- Manufacturing
- Healthcare
- Automotive and Mobility
- Defense and Security
- Construction, Mining, and Energy
- Other End-User Verticals
- By Geography
- North America
- United States
- Canada
- Mexico
- South America
- Brazil
- Argentina
- Rest of South America
- Europe
- Germany
- United Kingdom
- France
- Italy
- Spain
- Russia
- Rest of Europe
- Asia-Pacific
- China
- Japan
- South Korea
- India
- Australia
- Rest of Asia-Pacific
- Middle East
- Saudi Arabia
- United Arab Emirates
- Turkey
- Israel
- Rest of Middle East
- Africa
- South Africa
- Egypt
- Rest of Africa
- North America
Geography Analysis
North America accounted for 35.47% of the physical AI ecosystem market share in 2025. The region combines AI-native robotics firms, substantial corporate investment capacity, and reshoring activity that is increasing the need for flexible production equipment. U.S. robot installations rebounded in 2025 after 2 years of declines, with food production, warehousing, and logistics supporting the recovery. North America had 204 robots per 10,000 manufacturing employees in 2024. This was below Western Europe's 267 and South Korea's 1,220, leaving scope for higher automation density.
Asia-Pacific is projected to expand at an 18.76% CAGR through 2031, the fastest geographic rate in the physical AI ecosystem market. China is the region's central industrial robot base, with 295,000 installations in 2024 and domestic manufacturers holding 57% of its domestic robot market. Japan and South Korea are extending this strength through domestic physical AI programs, and South Korea designated physical AI as a key K-Moonshot mission in February 2026. South Korea deployed a domestic Physical AI Integrated Platform at KAIST for automobiles, precision manufacturing, and shipbuilding. India complements China in the regional industrial robot landscape, recording 9,100 installations in 2024 and drawing manufacturing automation investment linked to production incentive programs.
Europe held the second-largest regional position in 2025, supported by a deep installed base, established automation suppliers, and Western European robot density of 267 per 10,000 manufacturing employees. Germany accounted for 32% of Europe's annual robot installations in 2024, although regional installations declined by 8% that year amid weakening automotive conditions. The European Union's Machinery Regulation and Cyber Resilience Act are shaping procurement requirements for connected robots. The Middle East is advancing robotics in construction, energy, and logistics, while Africa and South America remain early-stage regions focused on mining and agriculture.
- NVIDIA Corporation
- ABB Ltd
- KUKA AG
- Boston Dynamics, Inc.
- Tesla, Inc.
- FANUC Corporation
- YASKAWA Electric Corporation
- Agility Robotics, Inc.
- Figure AI, Inc.
- NEURA Robotics GmbH
- Universal Robots A/S
- Teradyne, Inc.
- OMRON Corporation
- Siemens AG
- Hyundai Motor Company
- SoftBank Robotics Group Corp.
- Physical Intelligence, Inc.
- Covariant, Inc.
- Dexterity, Inc.
- Apptronik, Inc.
- 1X Technologies AS
- Sanctuary Cognitive Systems Corporation
- Skild AI, Inc.
- Google DeepMind
Additional Benefits:
- The market estimate (ME) sheet in Excel format
- 3 months of analyst support
TABLE OF CONTENTS
1 INTRODUCTION
- 1.1 Study Assumptions and Market Definition
- 1.2 Scope of the Study
2 RESEARCH METHODOLOGY
3 EXECUTIVE SUMMARY
4 MARKET LANDSCAPE
- 4.1 Market Overview
- 4.2 Market Drivers
- 4.2.1 Low-Latency Edge Inference for Real-Time Autonomy
- 4.2.2 Labor Scarcity in Unstructured Physical Work
- 4.2.3 Flexible Automation in Logistics and Manufacturing
- 4.2.4 Sim-to-Real Digital Twin Pipelines
- 4.2.5 Proprietary Real-World Action Data Compounding
- 4.2.6 Sovereign and Safety-Critical Autonomy Programs
- 4.3 Market Restraints
- 4.3.1 High Integration Cost and Long Commissioning Cycles
- 4.3.2 Certification, Liability, and Functional Safety Complexity
- 4.3.3 Scarcity of Long-Tail Physical Interaction Data
- 4.3.4 Energy, Thermal, and Battery Constraints in Mobile Embodiments
- 4.4 Industry Value-Chain Analysis
- 4.5 Regulatory Landscape
- 4.6 Technological Outlook
- 4.7 Porter's Five Forces Analysis
- 4.7.1 Bargaining Power of Suppliers
- 4.7.2 Bargaining Power of Buyers
- 4.7.3 Threat of New Entrants
- 4.7.4 Threat of Substitutes
- 4.7.5 Rivalry Among Existing Competitors
5 MARKET SIZE AND GROWTH FORECASTS (VALUE)
- 5.1 By Component
- 5.1.1 Hardware
- 5.1.2 Software
- 5.1.3 Services
- 5.2 By Robot Type and Embodiment
- 5.2.1 Industrial Robots
- 5.2.2 Professional Service Robots
- 5.2.3 Personal and Household Service Robots
- 5.2.4 Other Robot Type and Embodiments
- 5.3 By Deployment
- 5.3.1 On-Device
- 5.3.2 Cloud-Based
- 5.3.3 Hybrid
- 5.4 By End-User Vertical
- 5.4.1 Logistics and Supply Chain
- 5.4.2 Manufacturing
- 5.4.3 Healthcare
- 5.4.4 Automotive and Mobility
- 5.4.5 Defense and Security
- 5.4.6 Construction, Mining, and Energy
- 5.4.7 Other End-User Verticals
- 5.5 By Geography
- 5.5.1 North America
- 5.5.1.1 United States
- 5.5.1.2 Canada
- 5.5.1.3 Mexico
- 5.5.2 South America
- 5.5.2.1 Brazil
- 5.5.2.2 Argentina
- 5.5.2.3 Rest of South America
- 5.5.3 Europe
- 5.5.3.1 Germany
- 5.5.3.2 United Kingdom
- 5.5.3.3 France
- 5.5.3.4 Italy
- 5.5.3.5 Spain
- 5.5.3.6 Russia
- 5.5.3.7 Rest of Europe
- 5.5.4 Asia-Pacific
- 5.5.4.1 China
- 5.5.4.2 Japan
- 5.5.4.3 South Korea
- 5.5.4.4 India
- 5.5.4.5 Australia
- 5.5.4.6 Rest of Asia-Pacific
- 5.5.5 Middle East
- 5.5.5.1 Saudi Arabia
- 5.5.5.2 United Arab Emirates
- 5.5.5.3 Turkey
- 5.5.5.4 Israel
- 5.5.5.5 Rest of Middle East
- 5.5.6 Africa
- 5.5.6.1 South Africa
- 5.5.6.2 Egypt
- 5.5.6.3 Rest of Africa
- 5.5.1 North America
6 COMPETITIVE LANDSCAPE
- 6.1 Market Concentration
- 6.2 Strategic Moves
- 6.3 Market Share Analysis
- 6.4 Company Profiles (includes Global Level Overview, Market Level Overview, Core Segments, Financials as available, Strategic Information, Market Rank/Share, Products and Services, Recent Developments)
- 6.4.1 NVIDIA Corporation
- 6.4.2 ABB Ltd
- 6.4.3 KUKA AG
- 6.4.4 Boston Dynamics, Inc.
- 6.4.5 Tesla, Inc.
- 6.4.6 FANUC Corporation
- 6.4.7 YASKAWA Electric Corporation
- 6.4.8 Agility Robotics, Inc.
- 6.4.9 Figure AI, Inc.
- 6.4.10 NEURA Robotics GmbH
- 6.4.11 Universal Robots A/S
- 6.4.12 Teradyne, Inc.
- 6.4.13 OMRON Corporation
- 6.4.14 Siemens AG
- 6.4.15 Hyundai Motor Company
- 6.4.16 SoftBank Robotics Group Corp.
- 6.4.17 Physical Intelligence, Inc.
- 6.4.18 Covariant, Inc.
- 6.4.19 Dexterity, Inc.
- 6.4.20 Apptronik, Inc.
- 6.4.21 1X Technologies AS
- 6.4.22 Sanctuary Cognitive Systems Corporation
- 6.4.23 Skild AI, Inc.
- 6.4.24 Google DeepMind
7 MARKET OPPORTUNITIES AND FUTURE OUTLOOK
- 7.1 White-Space and Unmet-Need Assessment


