

|
시장보고서
상품코드
2119633
북부 캘리포니아의 데이터센터 : 시장 점유율 분석, 업계 동향과 통계, 성장 예측(2026-2031년)Northern California Data Center - Market Share Analysis, Industry Trends & Statistics, Growth Forecasts (2026 - 2031) |
||||||
 Mordor Intelligence
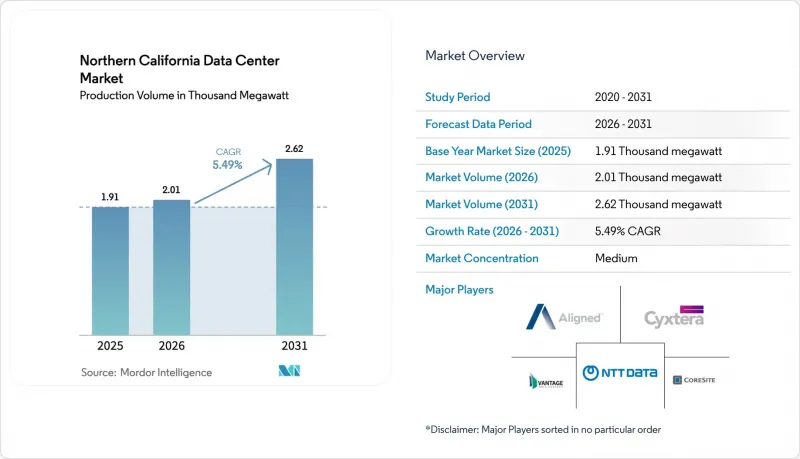
Mordor Intelligence에 따르면 북부 캘리포니아의 데이터센터 시장 규모(생산량 기준)는 2025년에 1,910 메가와트로 평가되며, 2026년 2,010 메가와트에서 예측 기간(2026-2031년) 동안 CAGR 5.49%로 확대되어 2031년까지 2,620 메가와트에 달할 것으로 예측됩니다.
본 보고서는 데이터센터 규모(소규모, 중규모, 대규모, 하이퍼스케일), 티어 유형(Tier 1·2, 기타), 데이터센터 유형(하이퍼스케일/자체 건설, 엔터프라이즈/엣지, 코로케이션), 및 최종사용자(BFSI, IT·ITES, E-Commerce,정부, 제조, 미디어·엔터테인먼트, 통신, 기타)별로 분류되어 있습니다. 시장 전망은 IT 부하 용량(메가와트) 단위로 제시되어 있습니다.
북부 캘리포니아 데이터센터 시장의 동향 및 인사이트
AI 중심의 하이퍼스케일 트랜치 수요
마이크로소프트, 메타 및 기타 하이퍼스케일러들의 설비 투자액은 2025 회계연도에 1,450억 달러를 초과할 전망이며, 그 대부분은 지연 시간에 민감한 추론 클러스터를 호스팅하는 북부 캘리포니아의 신규 데이터센터에 할당되고 있습니다. 사업자들은 요금 안정성을 보장하기 위해 PG&E의 규칙 30에 따라 4년 이상 앞선 시기의 전력 슬롯을 예약하고 있으며, 이로 인해 착공 전부터 전력 회사의 상호연결 대기자 명단이 급증하고 있습니다. 새로운 캠퍼스에는 200-500 MW 규모의 단일 테넌트형 블록이 마련되어 있어, AI 훈련, 모델 튜닝, 벡터 데이터베이스의 워크로드를 한곳에 집약하고 있습니다. 랙 수준의 전력 밀도는 항상 100 kW를 초과하여, 다이렉트 투 칩(Direct-to-Chip) 냉각 및 침지 냉각의 보급을 촉진하고 있습니다. 이러한 설비는 기존의 멀티 테넌트형 홀에서는 수용할 수 없기 때문에 개발업자들은 케이블 배선 거리와 인장 손실을 줄이기 위해 기존 변전소 근처에 위치한 그린필드 부지 확보를 점점 더 적극적으로 추진하고 있습니다.
급증하는 영상 렌더링 및 스트리밍 워크로드
현대 장편 영화의 미편집 영상 데이터는 2페타바이트를 초과하기도 하며, 4K에서 8K 포맷으로의 변환으로 인해 연산 부하가 4배 이상 증가합니다. 그 결과, 클라우드 기반 렌더링 워크로드는 로스앤젤레스에서 북상하여 산타클라라에 위치한 저지연 상호연결 허브를 활용하고 있습니다. 넷플릭스, 애플, 아마존은 전 세계 배포에 앞서 고해상도 마스터 데이터를 미리 배치하기 위해 베이 지역에 엣지 노드를 유지하고 있으며, 이를 통해 스튜디오는 태평양을 가로지르는 네트워크 혼잡의 영향을 받지 않게 되었습니다. 8K 및 볼륨메트릭 동영상에 대한 수요 증가도 북부 캘리포니아의 데이터센터 시장을 뒷받침하고 있습니다. 이는 벤더들이 하이퍼스케일 패브릭 옆에 콘텐츠 전송 네트워크를 공동 배치하고 있기 때문입니다. 할리우드의 재개발은 남부 캘리포니아에 중점을 두고 있지만, 베이 에어리어의 통신 사업자들은 산호세의 캐리어 호텔에서 종단되는 백홀 트래픽의 혜택을 누리고 있습니다.
PG&E 그리드의 230 kV 상호연결 부족
PG&E는 2025년 10월 기준으로 데이터센터의 미확정 부하가 9.6 GW를 기록하고 있지만, 상세 설계 단계로 진행된 것은 고작 1.4GW에 그치고 있습니다. Smart Wires의 FlexNet 장치를 통해 Los Esteros 변전소에서 100 MW의 용량이 확보되었지만, 사업자들은 여전히 새로운 루프 추가와 관련하여 수년에 걸친 지연에 직면해 있습니다. Silicon Valley Power는 더 매력적인 요금 체계를 제공하고 있지만, 서비스 지역이 18제곱마일로 제한되어 있어 공급 능력에 제약이 있습니다. 많은 개발업체들은 현재 초기 비용은 높지만, 일정 지연의 위험을 줄이기 위해 두 전력 회사로부터 분할 공급을 받기로 협상하고 있습니다. 공급 능력 부족이 지속되면서 북부 캘리포니아 데이터센터 시장의 단기적 확장은 제한되고 있으며, 일부 하이퍼스케일러들은 내륙 지역이나 태평양 연안 북서부 지역의 대체 부지를 모색하기 시작했습니다.
부문 분석
하이퍼스케일 시설은 북부 캘리포니아 데이터센터 시장의 확장을 주도하고 있으며, 단일 테넌트형 캠퍼스가 300MW를 넘는 규모로 급속히 확대됨에 따라 2031년까지 연평균 성장률(CAGR)은 6.12%를 기록할 전망입니다. 이러한 형태가 활성화되고 있는 배경에는 네트워크 홉 수를 최소화하고 전력 관리를 일원화함으로써 GPU 트레이닝 클러스터의 효율이 향상된다는 점이 있습니다. 2025년에는 대규모 시설이 북부 캘리포니아 데이터센터 시장 점유율의 42.42%를 차지했습니다. 50MW에서 150MW 규모의 대규모 시설은 여전히 기업의 리프트 앤 시프트(lift-and-shift) 워크로드를 처리하는 멀티테넌트형 클라우드에서 중요한 역할을 계속하고 있습니다. 10-50MW 규모의 중규모 시설은 스트리밍 및 SaaS 게이트웨이를 위한 지역 엣지 거점으로서 점점 더 중요한 역할을 수행하고 있습니다. 10MW 미만의 소규모 시설은 재해 복구, IoT 집계, 그리고 지연 시간이 극히 중요한 금융 거래 분야에서 계속해서 활용되고 있습니다. 북부 캘리포니아의 데이터센터 시장은 제한된 부지에 여러 개의 4MW 홀을 적층하는 수직형 설계로 계속 기울고 있으며, 토지 비용을 최적화하는 동시에 전력 및 냉수 개조를 위한 명확한 경로를 확보하고 있습니다.
산타클라라에 위치한 2세대 하이퍼스케일 캠퍼스에서는 구조적 개조 없이 침지 탱크를 설치할 수 있도록 30피트의 천장 높이와 보강된 바닥 슬래브가 채택되었습니다. 개발사는 계량 요금 할증 요금을 피하기 위해 부지 내에 강압 변전소를 설치했으며, 이중화된 230kV 피더가 방사형 34.5kV 루프로 분기되어 있습니다. 모듈식 블록 공법을 통해 건설 기간이 24개월에서 18개월로 단축되었으며, 고객의 프로젝트 파이프라인이 진행됨에 따라 이는 점점 더 중요한 차별화 요소가 되고 있습니다. 이러한 추세로 인해 하이퍼스케일 용량은 현재 북부 캘리포니아 데이터센터 시장에서 가장 경쟁이 치열한 분야가 되었으며, 인프라 펀드와 클라우드 제공업체가 토지, 자본, 인력을 공동으로 투입하는 합작 사업이 잇따르고 있습니다.
2025년에도 Tier 3는 북부 캘리포니아 데이터센터 시장에서 48.38%의 점유율을 차지하며 여전히 지배적인 위치를 유지하고 있습니다. 이는 짧은 유지보수 기간을 용인해 온 기존의 엔터프라이즈 호스팅 관행에서 기인한 것입니다. 그러나 Tier 4 용량은 연평균 성장률(CAGR) 6.32%로 급속히 확대되고 있습니다. 이는 GPU 추론 워크로드가 밀리초 단위의 중단만 발생해도 다운되기 때문입니다. 금융 시장 규제 당국과 하이퍼스케일러는 모두 99.995%의 가동률을 요구하고 있으며, 신규 건설에서는 2N+1 전력 토폴로지, 동시 유지보수가 가능한 개폐장치, 그리고 듀얼 액티브 칠러의 도입이 추진되고 있습니다. 건설 비용이 약 40% 증가한다는 부담은 서비스 수준 계약(SLA) 위반에 따른 위약금 감소와 예기치 못한 정지에 따른 비용 절감을 통해 상쇄되고 있습니다.
내진 공학 측면에서는 피크 지반 가속도 0.5g를 흡수할 수 있는 면진 구조 또는 모멘트 프레임 구조를 의무화하는 구역 4b의 요건에 따라, 설계는 더욱 Tier 4 수준으로 추진되고 있습니다. 운영 사업자는 3중 중복화된 연료 시스템과, 배치 분석보다 AI 추론 워크로드를 우선시하는 자동 부하 차단 제어를 채택하고 있습니다. Tier IV 인증 기술자는 높은 임금을 요구하기 때문에 인력 부족은 여전히 과제로 남아 있지만, 소유주는 현재 내결함성 환경을 지속적으로 가동할 수 있는 전기 및 기계 전문가의 공급원을 유지하기 위해 견습 프로그램에 자금을 지원하고 있습니다.
기타 혜택:
- 엑셀 형식의 시장 예측(ME) 시트
- 3개월간의 애널리스트 지원
자주 묻는 질문
목차
제1장 소개
제2장 조사 방법
제3장 주요 요약
제4장 시장 구도
제5장 시장 규모와 성장 예측(메가와트)
제6장 경쟁 구도
제7장 시장 기회와 향후 전망
KSM 26.09.03According to Mordor Intelligence, the northern california data center market size in terms of production volume was valued at 1.91 thousand megawatt in 2025 and is estimated to grow from 2.01 thousand megawatt in 2026 to reach 2.62 thousand megawatt by 2031, at a CAGR of 5.49% during the forecast period (2026-2031).
This report is Segmented by Data Center Size (Small, Medium, Large, and Hyperscale), Tier Type (Tier 1 and 2, and More), Data Center Type (Hyperscale/Self-Built, Enterprise/Edge, and Colocation), and End User (BFSI, IT and ITES, E-Commerce, Government, Manufacturing, Media and Entertainment, Telecom, and More). The Market Forecasts are Provided in Terms of IT Load Capacity (Megawatt).
Northern California Data Center Market Trends and Insights
AI-Centric Hyperscale Tranche Demand
Capital expenditure from Microsoft, Meta, and other hyperscalers exceeded USD 145 billion in fiscal 2025, and a significant portion funds new Northern California data centers that host latency-sensitive inference clusters. Operators book power slots four or more years ahead under PG&E Rule 30 to guarantee tariff certainty, which swells utility interconnection queues even before ground breaks. New campuses feature 200-500 MW single-tenant blocks that consolidate AI training, model tuning, and vector database workloads in one location. Rack-level densities regularly top 100 kW, driving widespread adoption of direct-to-chip and immersion cooling. Because such installations cannot be accommodated in legacy multi-tenant halls, developers increasingly pursue greenfield sites near existing substations to shorten cable runs and tensile losses.
Surging Film-Render and Streaming Workloads
Raw footage for modern features can exceed 2 petabytes, and converting 4K to 8K formats multiplies compute intensity more than fourfold. Cloud-based render workloads thus migrate north from Los Angeles to tap lower latency interconnect hubs in Santa Clara. Netflix, Apple, and Amazon maintain Bay Area edge nodes to pre-position high-resolution masters before global distribution, shielding studios from trans-Pacific congestion. Rising demand for 8K and volumetric video also boosts the Northern California data center market as equipment vendors colocate content delivery networks next to hyperscale fabrics. Although Hollywood redevelopment focuses on Southern California, Bay Area carriers benefit from the backhaul traffic that terminates at San Jose carrier hotels.
Scarce 230 kV Interconnects on PG&E Grid
PG&E recorded 9.6 GW of pending data center load as of October 2025, yet only 1.4 GW advanced to detailed engineering. Smart Wires FlexNet devices unlocked 100 MW at Los Esteros substation, but operators still face multi-year delays for new loop additions. Silicon Valley Power offers more attractive tariffs, though its 18-square-mile service territory constrains capacity. Many developers now negotiate split feeds from both utilities to de-risk schedule slippage, albeit at higher upfront cost. Continued scarcity caps near-term expansion of the Northern California data center market, nudging some hyperscalers to scout inland or Pacific Northwest alternatives.
Other drivers and restraints analyzed in the detailed report include:
- West-Coast Subsea-Cable Landings
- 400 MW Southern-CA Solar plus BESS PPAs
- Lengthy Power-Delivery Queue (48-60 Months)
For complete list of drivers and restraints, kindly check the Table Of Contents.
Segment Analysis
Hyperscale sites led the Northern California data center market's expansion, posting a 6.12% CAGR through 2031 as single-tenant campuses balloon beyond 300 MW. This form factor thrives because GPU training clusters become more efficient when network hops are minimized, and power management is centralized. Large facilities accounted for 42.42% of the Northern California data center market share in 2025. Large facilities between 50 MW and 150 MW retain relevance for mixed-tenant clouds that still handle enterprise lift-and-shift workloads. Medium-scale builds of 10-50 MW increasingly serve regional edge on-ramps for streaming and SaaS gateways. Small installations under 10 MW persist for disaster-recovery, IoT aggregation, and latency-critical financial trading. The Northern California data center market continues to tilt toward vertical designs that stack multiple 4 MW halls on scarce parcels, optimizing land costs while maintaining clear paths for power and chilled water retrofits.
Second-generation hyperscale campuses in Santa Clara incorporate 30-foot clear heights and reinforced floor slabs to accommodate immersion tanks without structural upgrades. Developers site step-down substations within property lines to avoid meter-fee markups, and redundant 230 kV feeders branch into radial 34.5 kV loops. Modular block construction shortens build schedules from 24 to 18 months, an increasingly significant differentiator as customer pipelines advance. With such dynamics, hyperscale capacity now represents the most contested slice of the Northern California data center market, drawing joint ventures between infrastructure funds and cloud providers to pool land, capital, and staffing.
Tier 3 remained dominant in 2025 with 48.38% Northern California data center market share, a legacy of enterprise hosting norms that tolerated brief maintenance windows. Tier 4 capacity, however, accelerates at 6.32% CAGR because GPU inference workloads crash when milliseconds of interruption occur. Financial market regulators and hyperscalers alike insist on 99.995% uptime, steering new builds toward 2N+1 electrical topologies, concurrently maintainable switchgear, and dual active chillers. Construction premiums of roughly 40% are offset by lower service-level-agreement penalties and reduced unplanned outage costs.
Seismic engineering further pushes designs to Tier 4 thanks to Zone 4b requirements that mandate base isolation or moment-frame structures capable of absorbing 0.5 g peak ground acceleration. Operators adopt triple redundant fuel systems and automated load-shedding controls that prioritize AI inference workloads over batch analytics. Skills scarcity remains an obstacle because Tier IV-certified technicians command premium wages; nevertheless, owners now fund apprenticeship programs to sustain pipelines of electrical and mechanical specialists who can keep fault-tolerant environments online.
Complete Report Scope:
- By Data Center Size
- Small
- Medium
- Large
- Hyperscale
- By Tier Type
- Tier 1 and 2
- Tier 3
- Tier 4
- By Data Center Type
- Hyperscale / Self-Built
- Enterprise / Edge
- Colocation
- Non-Utilized
- Utilized
- Retail Colocation
- Wholesale Colocation
- By End User
- BFSI
- IT and ITES
- E-Commerce
- Government
- Manufacturing
- Media and Entertainment
- Telecom
- Other End Users
List of Companies Covered in this Report:
- CoreSite Realty Corporation
- Cyxtera Technologies, Inc.
- Aligned Data Centers, LLC
- Vantage Data Centers, LLC
- Iron Mountain Data Centers
- STACK Infrastructure, Inc.
- Switch, Inc.
- NTT Global Data Centers Americas, Inc.
- Evoque Data Center Solutions, LLC
- DataBank, Ltd.
- QTS Realty Trust, LLC
- EdgeCore Digital Infrastructure, LLC
- EdgeConneX, Inc.
- Flexential Corp.
- H5 Data Centers, LLC
- Lumen Technologies, Inc.
- Stream Data Centers, LLC
- T5 Data Centers, LLC
- Digital Realty
- Nautilus Data Technologies, Inc.
- CyrusOne LLC
- Element Critical, Inc.
Additional Benefits:
- The market estimate (ME) sheet in Excel format
- 3 months of analyst support
TABLE OF CONTENTS
1 INTRODUCTION
- 1.1 Study Assumptions and Market Definition
- 1.2 Scope of the Study
2 RESEARCH METHODOLOGY
3 EXECUTIVE SUMMARY
4 MARKET LANDSCAPE
- 4.1 Market Overview
- 4.2 Market Drivers
- 4.2.1 AI-centric Hyperscale Tranche Demand
- 4.2.2 Surging Film-Render and Streaming Workloads
- 4.2.3 West-Coast Subsea-Cable Landings (Hawaiki Nui, CAP-1)
- 4.2.4 400 MW Southern-CA Solar + BESS PPAs
- 4.2.5 Revitalisation of Hollywood Sound Stages into Edge DCs
- 4.2.6 LA "Clean Grid 2045" Incentives for On-site Micro-SMRs
- 4.3 Market Restraints
- 4.3.1 Scarce 230 kV Interconnects on PG&E Grid
- 4.3.2 Lengthy Power-Delivery Queue (48-60 Months)
- 4.3.3 Rising Seismic-Design CAPEX Premiums (Zone 4b)
- 4.3.4 Shortage of Tier IV-Certified Technicians and Electricians
- 4.4 Market Outlook
- 4.4.1 IT Load Capacity
- 4.4.2 Raised Floor Space
- 4.4.3 Colocation Revenue
- 4.4.4 Installed Racks
- 4.4.5 Rack Space Utilisation
- 4.4.6 Submarine Cable
- 4.5 Key Industry Trends
- 4.5.1 Smartphone Users
- 4.5.2 Data Traffic per Smartphone
- 4.5.3 Mobile Data Speed
- 4.5.4 Broadband Data Speed
- 4.5.5 Fiber Connectivity Network
- 4.5.6 Regulatory Framework
- 4.6 Value Chain and Distribution Channel Analysis
- 4.7 Porter's Five Forces Analysis
- 4.7.1 Threat of New Entrants
- 4.7.2 Bargaining Power of Suppliers
- 4.7.3 Bargaining Power of Buyers
- 4.7.4 Threat of Substitutes
- 4.7.5 Competitive Rivalry
- 4.8 Impact of Macroeconomic Factors on the Market
5 MARKET SIZE AND GROWTH FORECASTS (MEGAWATT)
- 5.1 By Data Center Size
- 5.1.1 Small
- 5.1.2 Medium
- 5.1.3 Large
- 5.1.4 Hyperscale
- 5.2 By Tier Type
- 5.2.1 Tier 1 and 2
- 5.2.2 Tier 3
- 5.2.3 Tier 4
- 5.3 By Data Center Type
- 5.3.1 Hyperscale / Self-Built
- 5.3.2 Enterprise / Edge
- 5.3.3 Colocation
- 5.3.3.1 Non-Utilized
- 5.3.3.2 Utilized
- 5.3.3.2.1 Retail Colocation
- 5.3.3.2.2 Wholesale Colocation
- 5.4 By End User
- 5.4.1 BFSI
- 5.4.2 IT and ITES
- 5.4.3 E-Commerce
- 5.4.4 Government
- 5.4.5 Manufacturing
- 5.4.6 Media and Entertainment
- 5.4.7 Telecom
- 5.4.8 Other End Users
6 COMPETITIVE LANDSCAPE
- 6.1 Market Share Analysis
- 6.2 Company Landscape
- 6.3 Company Profiles (Includes Global Level Overview, Market Level Overview, Core Segments, Financials as Available, Strategic Information, Market Rank/Share, Products and Services, and Recent Developments)
- 6.3.1 CoreSite Realty Corporation
- 6.3.2 Cyxtera Technologies, Inc.
- 6.3.3 Aligned Data Centers, LLC
- 6.3.4 Vantage Data Centers, LLC
- 6.3.5 Iron Mountain Data Centers
- 6.3.6 STACK Infrastructure, Inc.
- 6.3.7 Switch, Inc.
- 6.3.8 NTT Global Data Centers Americas, Inc.
- 6.3.9 Evoque Data Center Solutions, LLC
- 6.3.10 DataBank, Ltd.
- 6.3.11 QTS Realty Trust, LLC
- 6.3.12 EdgeCore Digital Infrastructure, LLC
- 6.3.13 EdgeConneX, Inc.
- 6.3.14 Flexential Corp.
- 6.3.15 H5 Data Centers, LLC
- 6.3.16 Lumen Technologies, Inc.
- 6.3.17 Stream Data Centers, LLC
- 6.3.18 T5 Data Centers, LLC
- 6.3.19 Digital Realty
- 6.3.20 Nautilus Data Technologies, Inc.
- 6.3.21 CyrusOne LLC
- 6.3.22 Element Critical, Inc.
7 MARKET OPPORTUNITIES AND FUTURE OUTLOOK
- 7.1 White-Space and Unmet-Need Assessment


