

|
시장보고서
상품코드
2119651
DevOps : 시장 점유율 분석, 업계 동향과 통계, 성장 예측(2026-2031년)DevOps - Market Share Analysis, Industry Trends & Statistics, Growth Forecasts (2026 - 2031) |
||||||
 Mordor Intelligence
Mordor Intelligence에 따르면 DevOps 시장 규모는 2025년 161억 3,000만 달러에서 2026년에는 195억 7,000만 달러로 확대되고, 2026년부터 2031년까지 CAGR 21.33%를 기록하며 2031년에는 514억 3,000만 달러에 달할 것으로 예측됩니다.
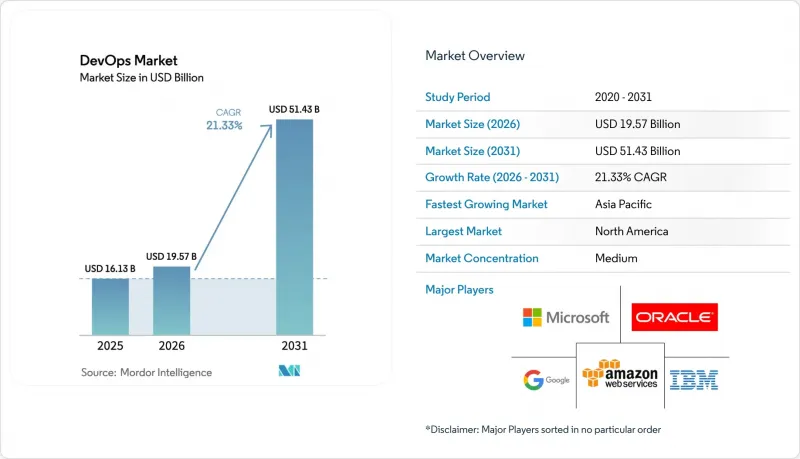
본 보고서는 구성요소(솔루션, 서비스), 도입 모델(퍼블릭 클라우드, 프라이빗 클라우드 등), 조직 규모(중소기업(SME), 대기업), 최종사용자 산업(BFSI, 소매·E-Commerce, 정부·공공 부문, 제조업, IT·통신 등), 및 지역(북미, 유럽 등)별로 분류되어 있습니다. 시장 전망은 금액(달러) 기준으로 제시되어 있습니다.
세계 DevOps 시장의 동향 및 인사이트
소프트웨어 개발 라이프사이클 단축 필요
성숙한 DevOps 관행을 도입한 조직에서는 배포 빈도가 200% 증가했고, 시장 출시 기간이 50% 단축된 것으로 보고되었습니다. 의료 등 규제 대상 산업에서는 규정 준수에 기반한 릴리스 일정을 준수하기 위해 개발자의 83%가 DevOps를 도입하고 있습니다. 지속적인 테스트를 통한 조기 결함 탐지로 품질 관련 비용을 60% 절감할 수 있습니다. 사일로화된 구조 대신 부서 간 협업 팀이 도입되어 보다 신속한 반복 개발이 유지되고 있으며, 거버넌스를 간소화하는 플랫폼 도구에 대한 수요가 증가하고 있습니다.
기업 내 자동화 및 CI/CD 도입 확대
기업의 70%가 2025년 말까지 Infrastructure-as-Code를 도입할 의향이 있으며, 이를 통해 배포 실패를 40% 줄일 수 있을 것으로 전망됩니다. 제조 기업에서는 공장 가동 중단 시간이 단축되고 혁신 주기가 가속화되고 있는 것으로 보고되고 있습니다. 한편, 금융 기관의 93%는 보안을 내재화한 신속한 서비스 제공을 추진하고 있습니다. 자동화를 통해 코드 품질이 30% 향상되고 평균 복구 시간(MTTR)이 25% 단축되므로, 직원들은 반복적인 업무에서 벗어나 혁신에 집중할 수 있게 됩니다.
레거시 시스템에서 마이크로서비스로의 전환에 수반되는 복잡성
60%의 기업이 DevSecOps 도입이 기술적으로 어렵다고 생각합니다. 금융 기관은 예상치 못한 통합 문제로 인해 30%가 넘는 비용 초과에 직면하고 있습니다. 예산이 제한된 중소기업의 경우 위험이 더욱 커지고 있으며, 벤더들은 원활한 전환을 위해 자동 리팩토링 및 데이터 무결성 보호 조치를 제공하고 있습니다.
부문 분석
이 솔루션은 2025년 매출의 59.65%를 차지하며, 전체 DevOps 시장에서 자동화, 통합, 협업 워크플로우를 뒷받침하고 있습니다. 소스 코드 관리와 CI/CD는 가장 높은 도입률을 보였으며, 릴리스 처리량을 40% 향상시키고 오류 발생률을 25% 감소시켰습니다. 각 벤더는 파이프라인의 장애를 예측하고 리소스 사용을 최적화하는 AI 모듈을 통합하여 운영 탄력성을 향상시키고 있습니다.
서비스 부문은 2031년까지 연평균 성장률(CAGR) 23.1%를 기록할 것으로 예측됩니다. 기업들은 기술 격차를 해소하고 복잡한 툴체인을 다루기 위해 컨설팅, 교육, 관리형 서비스에 의존하고 있습니다. 자문과 실행을 결합한 관리형 DevSecOps 플랫폼에 대한 수요가 급증하고 있습니다. 미국 DevSecOps 엔지니어의 평균 연봉이 14만 달러라는 사실은 인력 부족을 여실히 보여주고 있으며, 그 결과 예산이 외부 공급업체로 전환되고 있습니다.
2025년 매출의 44.70%를 퍼블릭 클라우드가 차지하고 있는데, 이는 네이티브 툴 생태계에 대한 접근이 용이함을 반영합니다. AWS, Microsoft, Google의 성숙한 마켓플레이스를 통해 팀은 통합 부담을 줄이면서 DevOps 파이프라인을 도입할 수 있습니다. 그러나 규제 대상 워크로드는 여전히 프라이빗 인프라에 남아 있는 경우가 많습니다.
하이브리드 클라우드 도입은 2031년까지 연평균 성장률(CAGR) 24.1%를 기록하며, DevOps 시장에 가장 큰 성장 기회를 창출할 것으로 전망됩니다. 금융 서비스 기관들은 2026년까지 하이브리드 활용률이 75%에 달할 것으로 예측하며, 주권과 확장성 간의 균형을 모색하고 있습니다. 조직들은 온프레미스 및 클라우드 자산 전반에 걸쳐 일관된 경험을 유지하기 위해 통합된 정책 엔진과 가시성 계층을 도입하고 있습니다.
지역별 분석
북미는 2025년 매출의 37.85%를 차지했습니다. 하이퍼스케일 클라우드 제공업체, 벤처 캐피털 투자 소프트웨어 벤더, 그리고 초기 도입 기업의 밀집된 존재가 이 지역의 리더십을 뒷받침하고 있습니다. 2024년에는 IT 부문이 해당 지역의 DevOps 시장 매출의 39%를 차지했으며, AI 지원 도구의 출시가 혁신 주기를 유지하고 있습니다.
아시아태평양은 2031년까지 25.4%라는 지역별 최고 연평균 성장률(CAGR)을 기록할 것으로 전망됩니다. 인도, 중국 및 아세안(ASEAN) 국가들은 디지털화 목표를 지원하기 위해 클라우드 지출을 가속화하고 있습니다. 인도에서는 기업의 65%가 중대한 영향을 미치는 서비스 중단을 보고하고 있어, 내결함성이 높은 DevOps 관행의 도입이 시급한 과제가 되고 있습니다. 한국에서는 기업의 92%에서 시간당 서비스 중단 비용이 100만 달러를 초과하여, 도입의 기세가 더욱 강해지고 있습니다.
유럽에서는 규제 강화에 따라 시장이 급속히 확대되고 있습니다. 독일에서는 2031년까지 클라우드 기반 DevOps 도구의 매출이 11억 3,000만 달러에 달할 것으로 예측됩니다. GDPR(일반 데이터 보호 규정)에 따라 데이터 보호 규정 준수를 위한 DevSecOps 도입이 추진되고 있습니다. 업계 재편의 조짐도 보이고 있으며, Eficode의 Solidify 인수는 해당 지역 전체에서 GitHub 서비스 강화로 이어지며, 전문 컨설팅 기업으로의 전환이라는 추세를 반영하고 있습니다.
기타 혜택:
- 엑셀 형식의 시장 예측(ME) 시트
- 3개월간의 애널리스트 지원
자주 묻는 질문
목차
제1장 소개
제2장 조사 방법
제3장 주요 요약
제4장 시장 구도
제5장 시장 규모와 성장 예측
제6장 경쟁 구도
제7장 시장 기회와 향후 전망
KSM 26.09.03According to Mordor Intelligence, the devOps market size is expected to grow from USD 16.13 billion in 2025 to USD 19.57 billion in 2026 and is forecast to reach USD 51.43 billion by 2031 at 21.33% CAGR over 2026-2031.
This report is Segmented by Component (Solutions, Services), Deployment Model (Public Cloud, Private Cloud, and More), Organization Size (Small and Medium Enterprises (SMEs), Large Enterprises), End-User Industry (BFSI, Retail and ECommerce, Government and Public Sector, Manufacturing, IT and Telecommunications, and More), and Geography (North America, Europe, and More). The Market Forecasts are Provided in Terms of Value (USD).
Global DevOps Market Trends and Insights
Need to shorten software development lifecycle
Organizations using mature DevOps practices report a 200% rise in deployment frequency and a 50% fall in time-to-market. Regulated sectors such as healthcare see 83% of developers engaged in DevOps to keep pace with compliance-driven release schedules. Earlier defect detection through continuous testing cuts quality-related costs by 60%. Cross-functional teams replace siloed structures to sustain faster iteration, and demand for platform tooling that simplifies governance is climbing.
Growing enterprise adoption of automation and CI/CD
Seventy percent of enterprises intend to deploy Infrastructure-as-Code by end-2025, cutting deployment failures 40%. Manufacturing firms report lower factory downtime and swifter innovation cycles, while 93% of financial institutions drive rapid service delivery with embedded security. Automation improves code quality 30% and trims mean-time-to-recovery 25%, shifting staff focus from repetitive tasks to innovation.
Legacy-to-micro-services migration complexity
Sixty percent of firms deem DevSecOps adoption technically challenging. Financial institutions face cost overruns exceeding 30% due to unforeseen integration hurdles. SMEs with limited budgets experience amplified risk, prompting vendors to offer automated refactoring and data-integrity safeguards to ease transitions.
Other drivers and restraints analyzed in the detailed report include:
- Cloud-native and micro-services proliferation
- Large-scale digital-transformation and agile uptake
- Multi-cloud security and compliance risks
For complete list of drivers and restraints, kindly check the Table Of Contents.
Segment Analysis
Solutions accounted for 59.65% of 2025 revenue, anchoring automation, integration, and collaboration workflows across the DevOps market. Source-control management and CI/CD attracted the highest deployment rates, delivering 40% higher release throughput and 25% lower error incidence. Vendors are layering AI modules that predict pipeline failures and optimize resource use, improving operational resilience.
The services segment is forecast to record a 23.1% CAGR to 2031. Enterprises rely on consulting, training, and managed offerings to bridge skills gaps and handle complex toolchains. Demand spikes for managed DevSecOps platforms that combine advisory and execution. Average US DevSecOps engineer compensation of USD 140,000 illustrates talent scarcity, channeling budget toward external providers.
Public cloud captured 44.70% of 2025 revenue, reflecting ease of access to native tool ecosystems. Mature marketplaces from AWS, Microsoft, and Google let teams onboard DevOps pipelines with reduced integration overhead. Yet regulated workloads often remain on private infrastructure.
Hybrid-cloud adoption will post a 24.1% CAGR through 2031, creating the largest incremental opportunity for the DevOps market. Financial services institutions anticipate 75% hybrid utilization by 2026, balancing sovereignty with scalability. Organizations deploy unified policy engines and observability layers to preserve a consistent experience across on-premises and cloud assets.
Complete Report Scope:
- By Component
- Solutions
- Services
- By Deployment Model
- Public Cloud
- Private Cloud
- Hybrid Cloud
- On-Premises
- By Organization Size
- Small and Medium Enterprises (SMEs)
- Large Enterprises
- By End-User Industry
- BFSI
- Retail and eCommerce
- Government and Public Sector
- Manufacturing
- IT and Telecommunications
- Healthcare and Life Sciences
- Media and Entertainment
- Other End-user Industries
- By Geography
- North America
- United States
- Canada
- Mexico
- Europe
- Germany
- United Kingdom
- France
- Italy
- Spain
- Russia
- Rest of Europe
- Asia-Pacific
- China
- India
- Japan
- South Korea
- ASEAN
- Australia and New Zealand
- Rest of Asia-Pacific
- South America
- Brazil
- Argentina
- Rest of South America
- Middle East and Africa
- Middle East
- Saudi Arabia
- United Arab Emirates
- Turkey
- Rest of Middle East
- Africa
- South Africa
- Nigeria
- Rest of Africa
- Middle East
- North America
Geography Analysis
North America contributed 37.85% of 2025 revenue. A dense concentration of hyperscale cloud providers, venture-backed software vendors, and early adopter enterprises underpins regional leadership. The IT sector produced 39% of regional DevOps market revenue in 2024, and AI-enabled tool launches maintain the innovation cycle.
Asia-Pacific will post the highest regional CAGR of 25.4% through 2031. India, China, and ASEAN economies accelerate cloud spending to support digital objectives. In India, 65% of organizations report high-impact outages, raising urgency for resilient DevOps practices. South Korea records the highest outage cost bracket, exceeding USD 1 million per hour for 92% of firms, reinforcing adoption impetus.
Europe is scaling rapidly under tightening regulations. Germany is projected to log USD 1.13 billion in cloud-based DevOps tools revenue by 2031. GDPR drives DevSecOps implementation for data-protection alignment. Consolidation is visible; Eficode's acquisition of Solidify strengthens GitHub services across the region, mirroring a trend toward specialist consultancies.
- Amazon Web Services, Inc.
- Microsoft Corporation
- Google LLC
- IBM Corporation
- Oracle Corporation
- Atlassian Corporation Plc
- GitLab Inc.
- GitHub Inc.
- Red Hat, Inc.
- Broadcom Inc.
- Micro Focus Intl plc
- Puppet Inc.
- Chef Software (Progress)
- HashiCorp Inc.
- Docker Inc.
- Circle Internet Svcs Inc. (CircleCI)
- JetBrains s.r.o.
- DigitalOcean Holdings Inc.
- Alibaba Group Holding Ltd.
- Dell Technologies Inc. (VMware Tanzu)
Additional Benefits:
- The market estimate (ME) sheet in Excel format
- 3 months of analyst support
TABLE OF CONTENTS
1 INTRODUCTION
- 1.1 Study Assumptions and Market Definition
- 1.2 Scope of the Study
2 RESEARCH METHODOLOGY
3 EXECUTIVE SUMMARY
4 MARKET LANDSCAPE
- 4.1 Market Overview
- 4.2 Market Drivers
- 4.2.1 Need to shorten software development lifecycle
- 4.2.2 Growing enterprise adoption of automation and CI/CD
- 4.2.3 Cloud-native and micro-services proliferation
- 4.2.4 Large-scale digital-transformation and agile uptake
- 4.2.5 AI/ML-centred predictive DevOps (AIOps)
- 4.2.6 Mandatory shift to DevSecOps for zero-trust compliance
- 4.3 Market Restraints
- 4.3.1 Legacy-to-micro-services migration complexity
- 4.3.2 Multi-cloud security and compliance risks
- 4.3.3 Shortage of skilled DevOps engineers and cultural inertia
- 4.3.4 Toolchain sprawl causing observability blind-spots
- 4.4 Value Chain Analysis
- 4.5 Regulatory Landscape
- 4.6 Technological Outlook
- 4.7 Porter's Five Forces Analysis
- 4.7.1 Bargaining Power of Buyers
- 4.7.2 Bargaining Power of Suppliers
- 4.7.3 Threat of New Entrants
- 4.7.4 Threat of Substitutes
- 4.7.5 Intensity of Competitive Rivalry
- 4.8 Assessment of Macro Economic Trends on the Market
5 MARKET SIZE AND GROWTH FORECASTS (VALUES)
- 5.1 By Component
- 5.1.1 Solutions
- 5.1.2 Services
- 5.2 By Deployment Model
- 5.2.1 Public Cloud
- 5.2.2 Private Cloud
- 5.2.3 Hybrid Cloud
- 5.2.4 On-Premises
- 5.3 By Organization Size
- 5.3.1 Small and Medium Enterprises (SMEs)
- 5.3.2 Large Enterprises
- 5.4 By End-User Industry
- 5.4.1 BFSI
- 5.4.2 Retail and eCommerce
- 5.4.3 Government and Public Sector
- 5.4.4 Manufacturing
- 5.4.5 IT and Telecommunications
- 5.4.6 Healthcare and Life Sciences
- 5.4.7 Media and Entertainment
- 5.4.8 Other End-user Industries
- 5.5 By Geography
- 5.5.1 North America
- 5.5.1.1 United States
- 5.5.1.2 Canada
- 5.5.1.3 Mexico
- 5.5.2 Europe
- 5.5.2.1 Germany
- 5.5.2.2 United Kingdom
- 5.5.2.3 France
- 5.5.2.4 Italy
- 5.5.2.5 Spain
- 5.5.2.6 Russia
- 5.5.2.7 Rest of Europe
- 5.5.3 Asia-Pacific
- 5.5.3.1 China
- 5.5.3.2 India
- 5.5.3.3 Japan
- 5.5.3.4 South Korea
- 5.5.3.5 ASEAN
- 5.5.3.6 Australia and New Zealand
- 5.5.3.7 Rest of Asia-Pacific
- 5.5.4 South America
- 5.5.4.1 Brazil
- 5.5.4.2 Argentina
- 5.5.4.3 Rest of South America
- 5.5.5 Middle East and Africa
- 5.5.5.1 Middle East
- 5.5.5.1.1 Saudi Arabia
- 5.5.5.1.2 United Arab Emirates
- 5.5.5.1.3 Turkey
- 5.5.5.1.4 Rest of Middle East
- 5.5.5.2 Africa
- 5.5.5.2.1 South Africa
- 5.5.5.2.2 Nigeria
- 5.5.5.2.3 Rest of Africa
- 5.5.5.1 Middle East
- 5.5.1 North America
6 COMPETITIVE LANDSCAPE
- 6.1 Market Concentration
- 6.2 Strategic Moves
- 6.3 Market Share Analysis
- 6.4 Company Profiles (includes Global level Overview, Market level overview, Core Segments, Financials as available, Strategic Information, Market Rank/Share for key companies, Products and Services, and Recent Developments)
- 6.4.1 Amazon Web Services, Inc.
- 6.4.2 Microsoft Corporation
- 6.4.3 Google LLC
- 6.4.4 IBM Corporation
- 6.4.5 Oracle Corporation
- 6.4.6 Atlassian Corporation Plc
- 6.4.7 GitLab Inc.
- 6.4.8 GitHub Inc.
- 6.4.9 Red Hat, Inc.
- 6.4.10 Broadcom Inc.
- 6.4.11 Micro Focus Intl plc
- 6.4.12 Puppet Inc.
- 6.4.13 Chef Software (Progress)
- 6.4.14 HashiCorp Inc.
- 6.4.15 Docker Inc.
- 6.4.16 Circle Internet Svcs Inc. (CircleCI)
- 6.4.17 JetBrains s.r.o.
- 6.4.18 DigitalOcean Holdings Inc.
- 6.4.19 Alibaba Group Holding Ltd.
- 6.4.20 Dell Technologies Inc. (VMware Tanzu)
7 MARKET OPPORTUNITIES AND FUTURE OUTLOOK
- 7.1 White-Space and Unmet-Need Assessment
- 7.2 Investment Analysis
- 7.3 Future Outlook


