|
시장보고서
상품코드
2119733
산업용 엣지 컴퓨팅 : 시장 점유율 분석, 업계 동향 및 통계, 성장 예측(2026-2031년)Industrial Edge Computing - Market Share Analysis, Industry Trends & Statistics, Growth Forecasts (2026 - 2031) |
||||||
 Mordor Intelligence
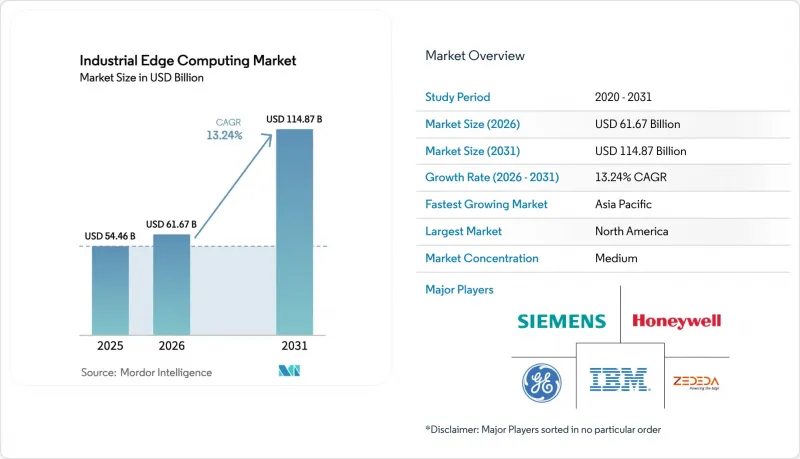
Mordor Intelligence에 의하면, 산업용 엣지 컴퓨팅 시장 규모는 2025년 544억 6,000만 달러로 평가되었습니다. 2026년에는 616억 7,000만 달러로 확대되어 2026년부터 2031년에 걸쳐 CAGR 13.24%로 성장을 지속하여, 2031년에는 1,148억 7,000만 달러에 이를 것으로 예측됩니다.
본 보고서는 구성 요소(하드웨어, 소프트웨어 및 플랫폼, 서비스), 최종 사용자 산업(제조, 석유 및 가스 등), 용도(예지 보전, 품질 검사 및 머신 비전 등), 도입 모델(On-Premise형 엣지 어플라이언스, 네트워크 장비에 통합된 엣지 등), 그리고 지역별로 분류되어 있습니다. 시장 예측은 금액(달러) 단위로 제시되어 있습니다.
세계의 산업용 엣지 컴퓨팅 시장 동향 및 인사이트
IIoT 센서 도입 및 공장 자동화의 급증
기업들은 기계, 컨베이어, 설비에 수백만 개에 달하는 센서를 부착하고 있으며, 이로 인해 생성되는 방대한 텔레메트리 데이터는 원격으로 처리하려고 할 경우 클라우드로의 백홀을 압박하게 됩니다. 엣지 노드는 공장 내에서 실시간 필터링과 분석을 수행함으로써 이러한 병목 현상을 해소합니다. 특히, 이산형 제조업체는 마이크로초 단위의 지연에도 민감하기 때문에 자동차, 전자기기, 포장 라인에서의 도입이 촉진되고 있습니다. 이러한 추세는 자기 강화적인 성격을 띠고 있어, 새로운 센서가 하나 추가될 때마다 데이터 교환량이 증가하고, 로컬 연산 처리에 대한 수요가 가속화되고 있습니다. 최적화를 위한 AI 모델이 컨트롤러 바로 옆에서 실행됨에 따라, 엣지 플랫폼은 단순한 선택적 부가 기능에서 핵심 인프라로 전환되고 있습니다.
스마트 제조에서 저지연 분석의 급속한 확산
스마트 제조 시범 프로젝트에서는 밀리초 단위의 차이가 수백만 달러 규모의 차이로 이어지는 실제 사례가 제시되었습니다. 엑슨모빌의 오픈 프로세스 테스트베드에서는 분석 처리를 엣지로 이전함으로써 15초가 걸리던 루프 시간을 약 40밀리초로 단축했습니다. 피드백 속도가 빨라짐에 따라 화학 및 금속과 같은 연속 생산 산업에서 품질 편차를 방지하고 폐기물을 줄일 수 있습니다. 기업은 대개 우선 중요도가 낮은 자산의 모니터링부터 시작하여, 신뢰성이 높아지면 미션 크리티컬한 루프로 전환해 나갑니다. 카메라를 통한 이미지 획득과 시정 조치 사이에 지연이 발생하면 결함이 생산 라인 전체로 파급되기 때문에 비전 기반 검사는 주요 촉진요인으로 작용하고 있습니다.
엣지 통합에서의 OT와 IT 기술 격차
효과적인 도입을 위해서는 산업용 프로토콜, 사이버 보안, 클라우드 네이티브 스택에 정통한 전문가가 필요하지만, 이 모든 역량을 갖춘 엔지니어는 15% 미만에 그치고 있습니다. 인력 부족으로 인해 프로젝트 기간이 길어지고, 컨설팅 비용이 급등하고 있습니다. 소규모 공장은 이러한 영향을 더욱 심각하게 받고 있으며, 통합 업체가 턴키 솔루션을 제공할 때까지 프로젝트를 연기하는 경우가 많습니다. 인증 프로그램은 증가 추세에 있지만, 인재 양성이 기술 도입 속도를 따라가지 못하고 있어, 이러한 기술 격차가 산업용 엣지 컴퓨팅 시장에 중기적인 걸림돌이 되고 있습니다.
부문별 분석
2025년에는 공장이 게이트웨이, 비전 가속기, 그리고 진동, 분진, 온도 변동에 견딜 수 있는 러기드 서버에 투자한 결과, 하드웨어가 매출의 45.02%를 차지했습니다. 이러한 구매가 현재 산업용 엣지 컴퓨팅 시장의 기반을 형성하며, 생산 라인 인근에서 확실한 성능을 보장하고 있습니다. 한편, 소프트웨어 및 플랫폼 제공은 워크로드를 전용 하드웨어에서 분리할 수 있기 때문에 연평균 성장률(CAGR) 13.95%라는 빠른 속도로 확대되고 있습니다. 기업들은 현재 PLC를 호스팅하는 동일한 노드에 디지털 트윈 마이크로서비스를 설치한 후, 통합 레지스트리를 통해 다른 공장으로 재배포할 수 있게 되었습니다. 또한, 구독형 가격 정책은 운영 예산과 부합하며, 재무 부서에게 예측 가능한 비용 곡선을 제공합니다.
제어 하드웨어에서 컨테이너 런타임을 활용할 수 있게 됨에 따라, 디바이스와 용도의 경계가 모호해지고 있습니다. Softing Industrial사의 2025년 OPC UA 확장(60개 이상의 컴패니언 모델 지원)은 표준화된 정보 모델이 소프트웨어의 가치를 어떻게 높이는지 보여주고 있습니다. 오케스트레이션의 성숙도가 높아짐에 따라 구매자들은 프로세서 수보다 플랫폼의 유연성과 라이프사이클 자동화를 더욱 중요하게 여기게 되었습니다. 서비스는 여전히 가장 작은 점유율을 차지하고 있지만, 통합 파트너가 분산된 자산을 통합된 관리 평면에 연결함으로써 구매 결정에 영향을 미치고 있습니다.
2025년, 제조 산업은 전 세계 지출의 42.10%를 차지했습니다. 이는 인더스트리 4.0을 조기에 도입한 기업들이 로봇 공학 및 공정 제어 분야에서 마이크로초 단위의 의사 결정 루프를 요구했기 때문입니다. 자동차 프레스 라인에서는 가동 중단으로 인한 비용이 분당 2만 5,000달러를 초과하기도 하기 때문에 산업용 엣지 컴퓨팅 시장은 이 분야에서 큰 반향을 일으키고 있습니다. 그러나 운송 및 물류 분야는 차량 텔레매틱스, 터미널 자동화, 그리고 창고 내 연산 처리가 필요한 자율 주행 야드 차량에 힘입어 연평균 성장률(CAGR) 13.96%라는 가장 빠른 성장세를 보이고 있습니다. 석유 및 가스 분야는 위성 통신의 지연이 허용되지 않는 외딴 지역의 현장 자산이 존재하기 때문에 여전히 큰 시장 규모를 유지하고 있습니다.
생명과학 분야의 공장에서도 로트 수준의 추적성을 확보하는 첨단 제조 기술을 FDA 지침이 권장하고 있어 도입이 가속화되고 있습니다. 광업, 금속, 유틸리티 분야에서는 근로자 안전 및 전력망 안정성과 같은 이용 사례에 엣지 분석이 활용되고 있습니다. 식품 및 음료 공장에서는 엄격한 표시 규정 및 알레르기 유발 물질 규정을 준수하기 위해 실시간 시각 검사가 도입되고 있습니다. 각 업계에서 지연 시간 감소, 규정 준수 보고, 에너지 절약과 같은 이점이 비즈니스 사례의 결정적인 요인이 되어 산업용 엣지 컴퓨팅 업계의 잠재 고객 기반을 확대되고 있습니다.
지역별 분석
2025년 북미 시장 점유율이 39.45%를 나타낸 배경에는 프라이빗 5G의 조기 도입, 견고한 사이버 보험 체계, 그리고 On-Premise 분석을 촉진하는 기업의 지속가능성 목표가 복합적으로 작용하고 있습니다. 엑슨모빌과 같은 다국적 기업들은 레거시 DCS와 컨테이너화된 마이크로서비스를 융합한 개방형 아키텍처의 유효성을 입증함으로써 고객의 신뢰를 공고히 하고 있습니다. 수익 성장은 현재 주력 파일럿 프로젝트가 아닌 기존 설비(브라운필드)의 생산 라인을 현대화하는 중규모 공장으로 이동하고 있으며, 산업용 엣지 컴퓨팅 시장은 얼리 어답터의 범위를 넘어 확대되고 있습니다.
아시아태평양은 13.62%라는 가장 높은 연평균 성장률(CAGR)을 기록하고 있으며, 이는 중국의 ‘중국 제조 2025’ 계획과 일본의 ‘사회 5.0’ 비전에 의해 뒷받침되고 있습니다. 그린필드 공장에서는 초기 설계 단계부터 엣지 기능을 통합함으로써 사후 개조에 따른 병목 현상을 피하고 있습니다. 지속가능성 연계형 대출은 대개 20-30베이시스포인트 낮은 금리가 적용되며, 현지 분석을 통해 실현되는 실시간 에너지 최적화를 높이 평가했습니다. 이 지역의 수출 주도형 제조업체들은 지연 없는 품질 관리를 세계 공급망 내 전략적 차별화 요인으로 간주하고 있습니다.
유럽은 IEC 62443의 사이버 보안 요구사항과 On-Premise 처리를 우선시하는 GDPR(EU 개인정보보호규정)에 기반한 데이터 로컬리티 규정 덕분에 여전히 중요한 역할을 수행하고 있습니다. 자동차 및 식품 제조업체가 주도하고 있으며, 시범 도입에 보조금을 지원하는 Horizon 프로그램의 조사가 이를 뒷받침하고 있습니다. 한편, 남미의 광산과 중동의 유전에서는 외딴 지역의 자산에서 발생하는 예기치 못한 가동 중지 시간을 줄이기 위해 견고한 엣지 노드가 도입되고 있으며, 이는 산업용 엣지 컴퓨팅 시장이 다양한 경제 환경 속에서 어떻게 확대되고 있는지를 보여줍니다.
기타 혜택 :
- 엑셀 형식 시장 예측(ME) 시트
- 3개월간의 애널리스트 지원
자주 묻는 질문
목차
제1장 서론
제2장 조사 방법
제3장 주요 요약
제4장 시장 구도
제5장 시장 규모 및 성장 예측
제6장 경쟁 구도
제7장 시장 기회 및 향후 전망
KTH 26.09.04According to Mordor Intelligence, the industrial edge computing market size is expected to grow from USD 54.46 billion in 2025 to USD 61.67 billion in 2026 and is forecast to reach USD 114.87 billion by 2031 at 13.24% CAGR over 2026-2031.
This report is Segmented by Component (Hardware, Software and Platform, and Services), End-User Industry (Manufacturing, Oil and Gas, and More), Application (Predictive Maintenance, Quality Inspection and Machine Vision, and More), Deployment Model (On-Premises Edge Appliances, Integrated Edge On Network Equipment, and More), and Geography. The Market Forecasts are Provided in Terms of Value (USD).
Global Industrial Edge Computing Market Trends and Insights
Surge in IIoT-sensor deployments and factory automation
Enterprises are attaching millions of sensors to machines, conveyors, and utilities, generating torrents of telemetry that overwhelm cloud backhauls if processed remotely. Edge nodes eliminate that bottleneck by applying real-time filtering and analytics within the factory walls. Discrete manufacturers are particularly sensitive to microsecond delays, driving uptake among automotive, electronics, and packaging lines. The pattern reinforces itself: every new sensor multiplies data interactions, accelerating demand for local compute. As AI models for optimization run directly beside controllers, edge platforms shift from optional add-ons to core infrastructure.
Rapid adoption of low-latency analytics in smart manufacturing
Smart-manufacturing pilots show how milliseconds translate into millions of dollars. ExxonMobil's open-process testbed cut a 15-second loop to roughly 40 milliseconds by relocating analytics to the edge. Faster feedback prevents quality drift and reduces scrap in continuous industries such as chemicals and metals. Firms often start by monitoring noncritical assets, then migrate to mission-critical loops once confidence grows. Vision-based inspection is a prime catalyst because any lag between camera capture and corrective action lets defects propagate down the line.
OT-IT skills gap for edge integration
Effective deployment demands professionals fluent in industrial protocols, cybersecurity, and cloud-native stacks, yet fewer than 15% of engineers possess that mix. Hiring shortages extend project timelines and inflate consulting fees. Smaller plants feel the pinch more acutely, often postponing projects until integrators package turnkey offerings. Although certification programs are growing, workforce development lags technology rollout, keeping the skills gap a mid-term drag on the Industrial Edge Computing market.
Other drivers and restraints analyzed in the detailed report include:
- Roll-out of private-5G industrial networks
- Containerized workloads on existing OT network equipment
- High upfront hardware and retrofit costs
For complete list of drivers and restraints, kindly check the Table Of Contents.
Segment Analysis
Hardware captured 45.02% revenue in 2025 as factories invested in gateways, vision accelerators, and rugged servers able to withstand vibration, dust, and temperature swings. Those purchases anchor the current Industrial Edge Computing market, ensuring deterministic performance near production lines. Software and platform offerings, however, are scaling faster at a 13.95% CAGR because they decouple workloads from proprietary iron. Enterprises can now install a digital-twin microservice on the same node that hosts a PLC, then redeploy it to a different plant through a centralized registry. Subscription pricing also aligns with operating budgets, giving finance teams predictable expense curves.
The growing availability of container runtimes on control hardware blurs the boundary between device and application. Softing Industrial's 2025 OPC UA expansion, supporting more than 60 companion models, illustrates how standardized information models boost software value. As orchestration maturity improves, buyers increasingly weigh platform flexibility and lifecycle automation over processor counts. Services remain the smallest slice but influence purchasing decisions because integration partners tie disparate assets into a unified management plane.
Manufacturing held 42.10% of global spending in 2025 as early Industry 4.0 adopters sought microsecond decision loops for robotics and process control. The Industrial Edge Computing market resonates with this sector because downtime costs can exceed USD 25,000 per minute in automotive stamping lines. Yet transportation and logistics is climbing fastest at a 13.96% CAGR, propelled by fleet telematics, terminal automation, and autonomous yard vehicles requiring compute at depots. Oil and gas remain substantial due to remote field assets where satellite latency is prohibitive.
Life sciences plants are also accelerating deployments as FDA guidance endorses advanced manufacturing technologies that ensure lot-level traceability. Mining, metals, and utilities apply edge analytics to worker safety and grid-stability use cases. Food and beverage plants deploy real-time vision inspection to comply with stringent labeling and allergen regulations. While each vertical value offers latency reduction, compliance reporting, and energy savings that often tip the business case, broadening the Industrial Edge Computing industry's addressable base.
Complete Report Scope:
- By Component
- Hardware
- Software and Platform
- Services
- By End-user Industry
- Manufacturing
- Oil and Gas
- Mining and Metals
- Utilities and Energy
- Transportation and Logistics
- Pharmaceuticals and Life Sciences
- Food and Beverage
- Other End-user Industries
- By Application
- Predictive Maintenance
- Quality Inspection and Machine Vision
- Real-time Process Optimisation
- Remote Asset Monitoring
- Safety and Compliance Analytics
- Edge AI Vision Analytics
- By Deployment Model
- On-premise Edge Appliances
- Integrated Edge on Network Equipment
- Managed Edge Platform-as-a-Service
- Industrial Edge Micro-Data-Centers
- By Geography
- North America
- South America
- Europe
- Asia Pacific
- Middle East and Africa
Geography Analysis
North America's 39.45% 2025 share reflects a confluence of early private-5G adoption, robust cyber-insurance frameworks, and corporate sustainability targets that incentivize on-premise analytics. Multinationals like ExxonMobil validate open architectures that blend legacy DCS with containerized microservices, cementing customer trust. Revenue growth now tilts toward mid-sized plants modernizing brownfield lines rather than flagship pilots, extending the Industrial Edge Computing market beyond early adopters.
Asia Pacific records the fastest 13.62% CAGR, underscored by China's Made-in-China 2025 program and Japan's Society 5.0 vision. Greenfield factories integrate edge capabilities from initial design, bypassing retrofit bottlenecks. Sustainability-linked loans, often priced 20-30 basis points lower, reward real-time energy optimization achieved through local analytics. The region's export-driven manufacturers view latency-free quality control as a strategic differentiator in global supply chains.
Europe remains pivotal thanks to IEC 62443 cyber mandates and GDPR-driven data-locality rules that privilege on-premise processing. Automotive and food producers lead, supported by Horizon-funded research that subsidizes pilot deployments. Meanwhile, South American mines and Middle East oilfields deploy rugged edge nodes to cut unplanned downtime on remote assets, illustrating how the Industrial Edge Computing market scales across disparate economic environments.
- International Business Machines Corporation
- Rockwell Automation, Inc.
- Siemens AG
- General Electric Company
- Honeywell International Inc.
- Huawei Technologies Co., Ltd.
- Microsoft Corporation
- SAP SE
- Intel Corporation
- Cisco Systems, Inc.
- Hewlett Packard Enterprise Company
- Dell Technologies Inc.
- Amazon Web Services, Inc.
- Schneider Electric SE
- Nokia Corporation
- Advantech Co., Ltd.
- ABB Ltd.
- Emerson Electric Co.
- Mitsubishi Electric Corporation
- Bosch Rexroth AG
- Foghorn Systems, Inc.
- ZEDEDA
- PTC Inc.
- ClearBlade, Inc.
Additional Benefits:
- The market estimate (ME) sheet in Excel format
- 3 months of analyst support
TABLE OF CONTENTS
1 INTRODUCTION
- 1.1 Study Assumptions and Market Definition
- 1.2 Scope of the Study
2 RESEARCH METHODOLOGY
3 EXECUTIVE SUMMARY
4 MARKET LANDSCAPE
- 4.1 Market Overview
- 4.2 Market Drivers
- 4.2.1 Surge in IIoT-sensor deployments and factory automation
- 4.2.2 Rapid adoption of low-latency analytics in smart manufacturing
- 4.2.3 Roll-out of private-5G industrial networks
- 4.2.4 Containerized workloads on existing OT network equipment
- 4.2.5 Cyber-insurance discounts for on-premise edge analytics
- 4.2.6 Sustainability-linked financing favouring local energy optimisation
- 4.3 Market Restraints
- 4.3.1 OT-IT skills gap for edge integration
- 4.3.2 High upfront hardware and retro-fit costs
- 4.3.3 Fragmented middleware standards hindering portability
- 4.3.4 Long-term security-patch obligations raising TCO
- 4.4 Industry Value Chain Analysis
- 4.5 Regulatory Landscape
- 4.6 Technological Outlook
- 4.7 Porter's Five Forces Analysis
- 4.7.1 Bargaining Power of Buyers
- 4.7.2 Bargaining Power of Suppliers
- 4.7.3 Threat of New Entrants
- 4.7.4 Threat of Substitutes
- 4.7.5 Intensity of Competitive Rivalry
5 MARKET SIZE AND GROWTH FORECASTS (VALUE)
- 5.1 By Component
- 5.1.1 Hardware
- 5.1.2 Software and Platform
- 5.1.3 Services
- 5.2 By End-user Industry
- 5.2.1 Manufacturing
- 5.2.2 Oil and Gas
- 5.2.3 Mining and Metals
- 5.2.4 Utilities and Energy
- 5.2.5 Transportation and Logistics
- 5.2.6 Pharmaceuticals and Life Sciences
- 5.2.7 Food and Beverage
- 5.2.8 Other End-user Industries
- 5.3 By Application
- 5.3.1 Predictive Maintenance
- 5.3.2 Quality Inspection and Machine Vision
- 5.3.3 Real-time Process Optimisation
- 5.3.4 Remote Asset Monitoring
- 5.3.5 Safety and Compliance Analytics
- 5.3.6 Edge AI Vision Analytics
- 5.4 By Deployment Model
- 5.4.1 On-premise Edge Appliances
- 5.4.2 Integrated Edge on Network Equipment
- 5.4.3 Managed Edge Platform-as-a-Service
- 5.4.4 Industrial Edge Micro-Data-Centers
- 5.5 By Geography
- 5.5.1 North America
- 5.5.2 South America
- 5.5.3 Europe
- 5.5.4 Asia Pacific
- 5.5.5 Middle East and Africa
6 COMPETITIVE LANDSCAPE
- 6.1 Market Concentration
- 6.2 Strategic Moves
- 6.3 Market Share Analysis
- 6.4 Company Profiles (includes Global-level Overview, Market-level Overview, Core Segments, Financials as available, Strategic Information, Market Rank/Share, Products and Services, Recent Developments)
- 6.4.1 International Business Machines Corporation
- 6.4.2 Rockwell Automation, Inc.
- 6.4.3 Siemens AG
- 6.4.4 General Electric Company
- 6.4.5 Honeywell International Inc.
- 6.4.6 Huawei Technologies Co., Ltd.
- 6.4.7 Microsoft Corporation
- 6.4.8 SAP SE
- 6.4.9 Intel Corporation
- 6.4.10 Cisco Systems, Inc.
- 6.4.11 Hewlett Packard Enterprise Company
- 6.4.12 Dell Technologies Inc.
- 6.4.13 Amazon Web Services, Inc.
- 6.4.14 Schneider Electric SE
- 6.4.15 Nokia Corporation
- 6.4.16 Advantech Co., Ltd.
- 6.4.17 ABB Ltd.
- 6.4.18 Emerson Electric Co.
- 6.4.19 Mitsubishi Electric Corporation
- 6.4.20 Bosch Rexroth AG
- 6.4.21 Foghorn Systems, Inc.
- 6.4.22 ZEDEDA
- 6.4.23 PTC Inc.
- 6.4.24 ClearBlade, Inc.
7 MARKET OPPORTUNITIES AND FUTURE OUTLOOK
- 7.1 White-space and Unmet-need Assessment