
|
시장보고서
상품코드
2122989
엣지 컴퓨팅 시장 : 점유율 분석, 업계 동향과 통계, 성장 예측(2026-2031년)Edge Computing - Market Share Analysis, Industry Trends & Statistics, Growth Forecasts (2026 - 2031) |
||||||
 Mordor Intelligence
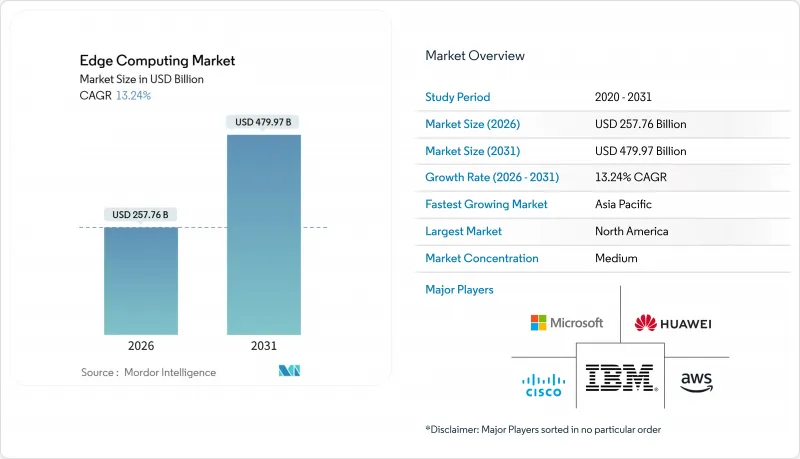
Mordor Intelligence에 의하면, 엣지 컴퓨팅 시장 규모는 2026년에 2,577억 6,000만 달러에 이르고, 2031년까지 연평균 복합 성장률(CAGR) 13.24%로 4,799억 7,000만 달러에 이를 것으로 예측됩니다.
이는 왕복 지연 시간을 최소화하고 새로운 데이터 주권 규제를 준수하는 분산 처리 아키텍처로의 결정적인 전환을 여실히 보여줍니다.
5G 독립형(SA)의 확산, 관할 구역별 데이터 현지화 의무, AI 지원 엔드포인트의 폭발적인 증가로 인해 수요는 네트워크 경계 부위에 집중되고 있습니다. 한편, ASIC 및 시스템 온 칩(SoC) 가격 하락으로 인해 On-Premise 추론 처리의 진입 장벽은 낮아지고 있습니다. 본 보고서는 구성 요소(하드웨어, 소프트웨어, 서비스), 배포 모드(On-Premise, 클라우드), 최종 사용자 산업(에너지·유틸리티, 기타), 용도(영상 분석·모니터링, 자율주행차·드론, 기타), 조직 규모(대기업, 중소기업), 지역별로 분류되어 있습니다. 시장 전망은 금액(달러) 기준으로 제시되어 있습니다.
세계 엣지 컴퓨팅 시장 동향 및 인사이트
5G 구축에 따른 초저지연 이용 사례 촉진
독립형 5G 코어는 현재 트래픽을 기지국의 마이크로 데이터센터로 유도하여 왕복 지연을 10밀리초 이하로 단축하고 있습니다. 아시아의 통신 사업자들은 2025년 중반까지 엣지 지원 5G 기지국 180만 곳을 설치하여 공장 자동화 및 원격 수술 시범 프로젝트를 실현했습니다. 반면, 유럽에서는 많은 통신 사업자가 여전히 4G 코어에 의존하고 있어 무선 커버리지는 높지만, 멀티 액세스 엣지 컴퓨팅(MAEC)의 도입이 제한적이어서 보급 속도가 더딘 실정입니다. 3.5GHz 대역의 주파수 라이선스에는 현재 엣지 호스팅에 관한 조항이 포함되어 있어, 통신 사업자는 무선 장비와 컴퓨팅 리소스를 동일한 장소에 설치하도록 권장받고 있습니다. 벤더들은 오케스트레이션 소프트웨어를 무선 장비에 번들로 제공하며, 기업들은 익숙한 클라우드 API를 통해 컨테이너 워크로드를 배포할 수 있게 되었습니다. 이러한 상황으로 인해 5G는 모빌리티, 게임, 산업 제어에 이르는 초고신뢰성·저지연 엣지 용도를 위한 주요 도입 채널이 되고 있습니다.
IoT 엔드포인트의 급증과 엣지에서의 데이터 중력
2025년에는 기업의 IoT 연결 수가 190억 건을 넘어설 것이며, 엑사바이트 규모의 텔레메트리 데이터가 생성됨에 따라 백홀 회선이 포화 상태에 이르러 데이터 전송 요금이 상승하고 있습니다. 현재 자동차 공장 한 곳만으로도 하루에 테라바이트급 데이터가 스트리밍되고 있지만, 그 데이터 중 장기 보존 가치가 있는 것은 극히 일부에 불과하며, 분석 처리는 온사이트 게이트웨이로 이전되고 있습니다. 엣지 처리를 통해 클라우드 이용료가 절감되고 제어 루프가 강화됨에 따라 설비의 가동률이 두 자릿수 비율로 향상됩니다. 또한, IEC 62443 보안 가이드라인에서는 운영 기술(OT)을 네트워크 장애로부터 보호하기 위해 로컬에서의 이상 감지가 의무화되어 있습니다. AI 모델이 와트급 칩으로 집약됨에 따라, 기업들은 원시 데이터가 아닌 분석 결과를 전송하게 되었고, 엣지 거점으로의 데이터 집약 경향이 더욱 강해지고 있습니다. 이러한 동향에 따라 예산은 중앙 서버에서 내환경성이 뛰어난 노드 및 플릿 관리 소프트웨어로 재분배되고 있습니다.
분산 노드에서의 사이버 공격 표면 확대
엣지 게이트웨이가 하나 늘어날 때마다 침입 경로가 하나씩 증가하며, 이미 ‘Mirai’의 변종은 DDoS 공격을 위해 산업용 컨트롤러의 취약한 인증 정보를 악용하고 있습니다. NIST의 ‘사이버 보안 프레임워크 2.0’에는 현재 엣지에 특화된 통제 조치가 포함되어 있지만, 많은 중소기업에서는 시큐어 부트, 인증서 로테이션, 마이크로 세분화을 수행할 인력이 부족합니다. 펌웨어 업데이트 주기가 5년에서 7년에 달하기 때문에 새로운 취약점이 발견된 후에도 오랫동안 장치가 무방비 상태로 방치됩니다. 공급망 관련 지침에서는 서명된 펌웨어를 요구하고 있지만, 중요 인프라 부문 이외의 분야에서 이행 상황은 여전히 미흡합니다. 보험사들은 침해 발생 가능성을 보험료에 반영한 결과, 2025년에는 엣지 배포용 보험료가 12% 상승했습니다. 자동화된 복구 조치나 더욱 견고한 기준 강화가 없다면, 보안에 대한 우려가 도입 지연을 초래할 우려가 있습니다.
부문 분석
고객이 자본 지출을 운영 예산으로 전환함에 따라 서비스 수익은 어플라이언스 매출을 넘어설 전망입니다. 2025년 시점에서도 하드웨어는 엣지 컴퓨팅 시장의 47.13%를 차지했으나, 구독 가격 체계 하에서 컴퓨팅, 오케스트레이션,보안을 융합한 하이퍼스케일러의 번들 서비스에 힘입어, 매니지드 서비스는 2031년까지 연평균 13.87%의 성장이 예상됩니다. 델은 엣지 인프라 매출이 19% 증가했다고 보고했으나, 고객이 라이프사이클 관리를 요구하는 가운데 이 회사의 서비스 부가율은 68%에 달했습니다. Hewlett Packard Enterprise의 ‘GreenLake’ 계약은 워크로드별로 과금되므로 용량 계획의 위험을 제거하고, AI 검사 시스템을 도입하는 공장의 가치 실현까지 걸리는 시간을 단축합니다. DRAM 및 NAND 비용이 변동하는 가운데, 하드웨어의 상품화는 계속되고 있으며, ODM 간의 경쟁이 서버의 평균 판매 가격(ASP)을 억제하고 있어 벤더들은 소프트웨어를 통한 차별화와 전문 서비스에 주력하고 있습니다.
슬림한 쿠버네티스 배포판과 결과 일관성 데이터베이스를 포함한 엣지 네이티브 소프트웨어는 2031년까지 13.45%의 성장률을 보일 전망입니다. Red Hat OpenShift와 SUSE Rancher는 엔터프라이즈용 컨트롤 플레인의 주도권을 놓고 경쟁하는 한편, 오픈소스인 K3s는 리소스가 제한된 도입 환경에서 점유율을 확대되고 있습니다. Capgemini Engineering과 같은 시스템 통합사업자에서는 2024년에 OT 엣지 관련 프로젝트가 34% 증가했습니다. 이는 현장 프로세스를 마이크로서비스 아키텍처로 전환하기 위한 전문 지식에 대한 수요를 반영합니다. 전반적으로 서비스는 단기 이익률을 다년간의 현금 흐름으로 전환하여, 하드웨어의 한계 이익이 정체된 후에도 벤더가 장기적인 가치를 확보할 수 있는 기반을 마련하고 있습니다.
2025년에는 클라우드 연결형 시스템이 엣지 컴퓨팅 시장의 58.19%를 차지하며, AWS Wavelength, Azure Edge Zones,Google Distributed Cloud가 하이퍼스케일러의 API를 통신 사업자의 시설에 도입함에 따라 2031년까지 연평균 성장률(CAGR) 13.61%로 성장할 전망입니다. 이러한 서비스는 독자적인 엣지 SDK 없이도 10밀리초 이하의 지연을 실현하여 개발자의 부담을 줄여줍니다. 마이크로소프트는 Azure Edge Zones를 47개 대도시권으로 확대하며, 클라우드에서 공장 현장에 이르기까지 단일 제어 평면을 통한 관리를 공개적으로 추진하고 있습니다.
외부로의 데이터 전송이 금지된 규제가 엄격한 산업(제약 배치 기록, PCI-DSS 카드 데이터, 안전성이 극히 중요한 자동화 시스템 등)에서는 여전히 On-Premise 배포가 지속되고 있습니다. 그러나 이러한 부문에서도 툴 체인의 비일관성을 피하기 위해 클라우드 네이티브 오케스트레이션을 채택하는 조직이 늘고 있습니다. 하이브리드 토폴로지에서는 기업 방화벽 뒤에 설치된 게이트웨이 하드웨어와 클라우드 기반 관리를 융합하여, 데이터 위치 요건과 운영의 민첩성 사이에서 균형을 맞추고 있습니다. EU 데이터법의 데이터 마이그레이션성 조항은 이러한 추세를 가속화하고 있습니다. 기업은 전환에 대한 준비 태세를 입증해야 하기 때문에 독점적인 엣지 스택보다 개방형 쿠버네티스(Kubernetes)가 우선시되고 있습니다.
지역별 분석
북미는 하이퍼스케일러의 전개와, Verizon 및 AT&에 의한 조기 스탠드얼론형 5G 서비스 개시로 인해, 2025년의 지출 중 33.91%를 차지했습니다. 미국에서만 108개의 AWS Wavelength 존과 23개의 Azure Edge Zone이 가동 중이며, 전국의 개발자들에게 저지연 엔드포인트를 제공합니다. 캐나다의 Bell과 Telus는 자원 채굴 현장에서 산업용 IoT를 지원하기 위해 멀티 액세스 엣지 컴퓨팅을 도입한 반면, 멕시코의 공장에서는 T-MEC 협정에 따라 도입된 니어쇼어링 우대 조치에 힘입어 엣지 품질 검사를 전개하고 있습니다.
아시아태평양은 차이나 모바일(China Mobile)의 180만 기의 엣지 지원 5G 기지국에 힘입어 2031년까지 연평균 성장률(CAGR) 14.21%로 확대될 것으로 예측됩니다. 인도의 ‘디지털 인디아(Digital India)’ 이니셔티브에서는 엣지 기술을 활용한 지자체 서비스 제공을 위해 100개의 스마트 시티가 선정되었으며, 동남아시아에서는 제조업의 이전이 진행됨에 따라 지역 내 엣지 기술 도입이 가속화되고 있습니다. 일본의 NTT 도코모와 한국의 SK텔레콤은 자율주행차 실증 실험에 엣지 컴퓨팅을 통합하고 있으며, 호주에서는 위성 백홀 용량이 제한된 외딴 지역의 광산에서 엣지 컴퓨팅이 활용되고 있습니다.
유럽은 2025년에 전 세계 지출의 약 24%를 차지하며, 이는 EU 데이터법의 주권 요건과 1,836곳의 등록된 노드에 의해 뒷받침되고 있습니다. 독일, 프랑스, 네덜란드는 자동차, 금융, 의료 분야를 아우르는 이러한 설치 거점의 61%를 보유하고 있습니다. 사우디아라비아의 NEOM이나 아랍에미리트(UAE) 두바이 스마트시티와 같은 스마트시티 메가 프로젝트가 중동 수요를 견인하는 한편, 남미 수요는 브라질의 산업 자동화 및 아르헨티나의 통신 현대화를 중심으로 집중되고 있습니다. 지역별 지출 동향은 정책적 노력을 반영하고 있습니다. 미국의 ‘CHIPS 및 과학법’은 국내 반도체 산업에 520억 달러를 투입하고, EU의 ‘디지털 데케이드’는 2030년까지 1만 노드 설치를 목표로 하고 있어 지속적인 설비 투자 파이프라인을 확보하고 있습니다.
기타 혜택
- 엑셀 형식 시장 예측(ME) 시트
- 3개월간 애널리스트 지원
목차
제1장 서론
제2장 조사 방법
제3장 주요 요약
제4장 시장 구도
제5장 시장 규모와 성장 예측
제6장 경쟁 구도
제7장 시장 기회와 향후 전망
JHSAccording to Mordor Intelligence, the edge computing market size reached USD 257.76 billion in 2026 and is projected to advance to USD 479.97 billion by 2031 at a 13.24% CAGR, underscoring a decisive pivot toward distributed processing architectures that minimize round-trip latency and comply with emerging data-sovereignty rules.
5G standalone roll-outs, jurisdictional data-localization mandates, and an explosion of AI-enabled endpoints concentrate demand at the network perimeter, while declining ASIC and system-on-chip prices lower the entry barrier for on-premise inference. This report is Segmented by Component (Hardware, Software, Services), Deployment Mode (On-Premise, and Cloud), End-User Industry (Energy and Utilities, and More), Application (Video Analytics and Surveillance, Autonomous Vehicles and Drones, and More), Organisation Size (Large Enterprises, and Small and Medium Enterprises), and Geography. The Market Forecasts are Provided in Terms of Value (USD).
Global Edge Computing Market Trends and Insights
5G Roll-Out Catalysing Ultra-Low-Latency Use-Cases
Standalone 5G cores now steer traffic to base-station micro data centers, trimming round-trip latency below 10 milliseconds. Asian operators had installed 1.8 million edge-enabled 5G sites by mid-2025, enabling factory automation and remote-surgery pilots. Europe shows slower uptake because many carriers still depend on 4G cores, limiting multi-access edge compute despite high radio coverage. Spectrum licenses in the 3.5 GHz band now include edge-hosting clauses, pushing telcos to colocate compute with radios. Equipment vendors bundle orchestration software with radios, letting enterprises deploy container workloads through familiar cloud APIs. These conditions make 5G the primary on-ramp for ultra-reliable low-latency edge applications across mobility, gaming, and industrial control.
Proliferation of IoT Endpoints and Data Gravity at the Edge
Enterprise IoT connections exceeded 19 billion in 2025, producing exabyte-scale telemetry that swamps backhaul links and raises egress fees. A single automotive plant now streams terabytes daily, yet only a fraction of that data merits long-term storage, pushing analytics to on-site gateways. Edge processing lowers cloud bills and tightens control loops, boosting equipment uptime by double-digit percentages. IEC 62443 security guidelines further mandate local anomaly detection to shield operational technology from network faults. As AI models compress onto watt-scale chips, companies ship insights rather than raw data, reinforcing the gravity of the pull toward edge locations. This dynamic reallocates budget from central servers to ruggedized nodes and fleet-management software.
Cyber-Attack Surface Expansion at Distributed Nodes
Each edge gateway adds another ingress point, and Mirai variants already exploit weak credentials on industrial controllers for DDoS campaigns. NIST's Cybersecurity Framework 2.0 now includes edge-specific controls, yet many SMEs lack the staff to implement secure boot, certificate rotation, and microsegmentation. Firmware refresh cycles stretch five to seven years, leaving devices exposed long after new vulnerabilities appear. Supply-chain directives require signed firmware, but enforcement outside critical infrastructure sectors remains patchy. Insurance premiums for edge deployments climbed 12% in 2025 as carriers priced in the likelihood of breaches. Without automated remediation and stronger baseline hardening, security fears could deter late adopters.
Other drivers and restraints analyzed in the detailed report include:
- Regulatory Data-Sovereignty Mandates (EU Data Act)
- Declining ASIC/SoC Costs for Edge Inference Accelerators
- Skills Gap in Deploying and Managing Heterogeneous Edge Stacks
For complete list of drivers and restraints, kindly check the Table Of Contents.
Segment Analysis
Services revenue is on track to eclipse appliance sales as customers shift capital outlays into operational budgets. In 2025, hardware still accounted for 47.13% of the edge computing market, yet managed services are forecast to grow at 13.87% annually through 2031, supported by hyperscaler bundles that fuse compute, orchestration, and security under subscription pricing. Dell noted a 19% jump in edge-infrastructure revenue, but its services attach rate hit 68% as clients demanded lifecycle management. Hewlett Packard Enterprise's GreenLake contracts, billed per workload, eliminate capacity-planning risk and improve time-to-value for factories retrofitting AI inspection. Hardware commoditization persists as DRAM and NAND costs fluctuate; ODM rivalry tempers server ASPs, prompting vendors to focus on software differentiation and professional services.
Edge-native software, including slim Kubernetes distributions and eventually consistent databases, grows at 13.45% through 2031. Red Hat OpenShift and SUSE Rancher square off for enterprise control-plane dominance, while open-source K3s captures resource-constrained deployments. System integrators such as Capgemini Engineering saw OT-edge engagements rise 34% in 2024, reflecting demand for domain expertise to translate shop-floor processes into microservice architectures. Overall, services convert one-time margin into multiyear cash flows, positioning vendors to capture long-run value once hardware marginal gains plateau.
Cloud-connected installations commanded 58.19% of the edge computing market share in 2025 and will expand at a 13.61% CAGR through 2031 as AWS Wavelength, Azure Edge Zones, and Google Distributed Cloud push hyperscaler APIs into carrier facilities. These offerings deliver sub-10-millisecond latency without demanding proprietary edge SDKs, lowering developer friction. Microsoft expanded Azure Edge Zones to 47 metro areas and publicly promotes single-control-plane management from the cloud to the factory floor.
On-premise deployments persist in regulated verticals that bar external data transit - pharma batch records, PCI-DSS card data, and safety-critical automation. Even there, organizations increasingly adopt cloud-native orchestration to avoid divergent toolchains. Hybrid topologies blend gateway hardware installed behind corporate firewalls with cloud-managed configuration, striking a balance between data residency and operational agility. EU Data Act portability clauses accelerate this pattern because enterprises must demonstrate switching readiness, favoring open Kubernetes over proprietary edge stacks.
Complete Report Scope:
- By Component
- Hardware
- Software
- Services
- By Deployment Mode
- On-Premise
- Cloud
- By End-User Industry
- Manufacturing and Industrial
- Energy and Utilities
- Healthcare and Life Sciences
- Retail and E-Commerce
- Banking, Financial Services, and Insurance (BFSI)
- Telecommunications and IT
- Other End-User Industries
- By Application
- Industrial IoT and Predictive Maintenance
- Video Analytics and Surveillance
- Autonomous Vehicles and Drones
- Other Applications
- By Organisation Size
- Large Enterprises
- Small and Medium Enterprises
- By Geography
- North America
- United States
- Canada
- Mexico
- Europe
- Germany
- United Kingdom
- France
- Russia
- Rest of Europe
- Asia-Pacific
- China
- Japan
- India
- South Korea
- Australia
- Rest of Asia-Pacific
- Middle East and Africa
- Middle East
- Saudi Arabia
- United Arab Emirates
- Rest of Middle East
- Africa
- South Africa
- Egypt
- Rest of Africa
- Middle East
- South America
- Brazil
- Argentina
- Rest of South America
- North America
Geography Analysis
North America commanded 33.91% of 2025 spending, anchored by hyperscaler footprints and early standalone 5G launches from Verizon and AT&T. The United States alone hosts 108 AWS Wavelength zones and 23 Azure Edge Zones, giving developers nationwide low-latency endpoints. Canada's Bell and Telus added multi-access edge compute to support industrial IoT across resource-extraction sites, while Mexican factories deploy edge quality inspection under nearshoring incentives introduced by the T-MEC accord.
Asia-Pacific is forecast to expand at a 14.21% CAGR through 2031, driven by China Mobile's 1.8 million edge-enabled 5G base stations. India's Digital India initiative earmarked 100 smart cities for edge-powered municipal services, while Southeast Asia's manufacturing migration is accelerating local edge adoption. Japan's NTT Docomo and South Korea's SK Telecom integrate edge into autonomous vehicle pilots, while Australia exploits edge compute in remote mining where satellite backhaul is constrained.
Europe held roughly 24% of global spend in 2025, buoyed by the EU Data Act's sovereignty requirements and 1,836 documented nodes. Germany, France, and the Netherlands host 61% of these installations, covering automotive, finance, and healthcare. Smart-city mega-projects in Saudi Arabia's NEOM and the UAE's Dubai Smart City spearhead Middle East demand, whereas South America clusters center on Brazilian industrial automation and Argentine telecom modernization. Regional spending profiles mirror policy commitments: the U.S. CHIPS and Science Act injects USD 52 billion into domestic semiconductors, and the EU Digital Decade targets 10,000 nodes by 2030, ensuring sustained capex pipelines.
- Amazon Web Services, Inc.
- Microsoft Corporation
- Cisco Systems Inc.
- Huawei Technologies Co. Ltd.
- IBM Corporation
- Hewlett Packard Enterprise (HPE)
- Dell Technologies Inc.
- Google LLC (Alphabet Inc.)
- Intel Corporation
- NVIDIA Corporation
- Juniper Networks Inc.
- Advantech Co. Ltd.
- ADLINK Technology Inc.
- Schneider Electric SE
- Siemens AG
- Capgemini Engineering
- MachineShop Inc.
- Vapor IO Inc.
- Litmus Automation
- FogHorn Systems
- Lumen Technologies Inc.
Additional Benefits:
- The market estimate (ME) sheet in Excel format
- 3 months of analyst support
TABLE OF CONTENTS
1 INTRODUCTION
- 1.1 Study Assumptions and Market Definition
- 1.2 Scope of the Study
2 RESEARCH METHODOLOGY
3 EXECUTIVE SUMMARY
4 MARKET LANDSCAPE
- 4.1 Market Overview
- 4.2 Market Drivers
- 4.2.1 5G Roll-Out Catalysing Ultra-Low-Latency Use-Cases
- 4.2.2 Proliferation of IoT Endpoints and Data Gravity at the Edge
- 4.2.3 Regulatory Data-Sovereignty Mandates (e.g., EU Data Act)
- 4.2.4 Declining ASIC/SoC Costs for Edge Inference Accelerators
- 4.2.5 Energy-Efficiency Targets Driving Micro-Data-Centres (ESG)
- 4.2.6 Rise of RISC-V and Chiplet Architectures Enabling Custom Edge Silicon
- 4.3 Market Restraints
- 4.3.1 Cyber-Attack Surface Expansion at Distributed Nodes
- 4.3.2 Skills Gap in Deploying and Managing Heterogeneous Edge Stacks
- 4.3.3 Inter-Operability and Standards Fragmentation (MEC, Open-RAN, LF Edge)
- 4.3.4 Inefficient ROI for Brown-Field Industrial Retro-Fits
- 4.4 Industry Value Chain Analysis
- 4.5 Regulatory Landscape
- 4.6 Technological Outlook
- 4.7 Porter's Five Forces Analysis
- 4.7.1 Bargaining Power of Suppliers
- 4.7.2 Bargaining Power of Buyers
- 4.7.3 Threat of New Entrants
- 4.7.4 Threat of Substitutes
- 4.7.5 Intensity of Competitive Rivalry
- 4.8 Impact of Macroeconomic Factors on the Market
5 MARKET SIZE AND GROWTH FORECASTS (VALUE)
- 5.1 By Component
- 5.1.1 Hardware
- 5.1.2 Software
- 5.1.3 Services
- 5.2 By Deployment Mode
- 5.2.1 On-Premise
- 5.2.2 Cloud
- 5.3 By End-User Industry
- 5.3.1 Manufacturing and Industrial
- 5.3.2 Energy and Utilities
- 5.3.3 Healthcare and Life Sciences
- 5.3.4 Retail and E-Commerce
- 5.3.5 Banking, Financial Services, and Insurance (BFSI)
- 5.3.6 Telecommunications and IT
- 5.3.7 Other End-User Industries
- 5.4 By Application
- 5.4.1 Industrial IoT and Predictive Maintenance
- 5.4.2 Video Analytics and Surveillance
- 5.4.3 Autonomous Vehicles and Drones
- 5.4.4 Other Applications
- 5.5 By Organisation Size
- 5.5.1 Large Enterprises
- 5.5.2 Small and Medium Enterprises
- 5.6 By Geography
- 5.6.1 North America
- 5.6.1.1 United States
- 5.6.1.2 Canada
- 5.6.1.3 Mexico
- 5.6.2 Europe
- 5.6.2.1 Germany
- 5.6.2.2 United Kingdom
- 5.6.2.3 France
- 5.6.2.4 Russia
- 5.6.2.5 Rest of Europe
- 5.6.3 Asia-Pacific
- 5.6.3.1 China
- 5.6.3.2 Japan
- 5.6.3.3 India
- 5.6.3.4 South Korea
- 5.6.3.5 Australia
- 5.6.3.6 Rest of Asia-Pacific
- 5.6.4 Middle East and Africa
- 5.6.4.1 Middle East
- 5.6.4.1.1 Saudi Arabia
- 5.6.4.1.2 United Arab Emirates
- 5.6.4.1.3 Rest of Middle East
- 5.6.4.2 Africa
- 5.6.4.2.1 South Africa
- 5.6.4.2.2 Egypt
- 5.6.4.2.3 Rest of Africa
- 5.6.4.1 Middle East
- 5.6.5 South America
- 5.6.5.1 Brazil
- 5.6.5.2 Argentina
- 5.6.5.3 Rest of South America
- 5.6.1 North America
6 COMPETITIVE LANDSCAPE
- 6.1 Market Concentration
- 6.2 Strategic Moves
- 6.3 Market Share Analysis
- 6.4 Company Profiles (includes Global Level Overview, Market Level Overview, Core Segments, Financials as Available, Strategic Information, Market Rank/Share for Key Companies, Products and Services, Recent Developments)
- 6.4.1 Amazon Web Services, Inc.
- 6.4.2 Microsoft Corporation
- 6.4.3 Cisco Systems Inc.
- 6.4.4 Huawei Technologies Co. Ltd.
- 6.4.5 IBM Corporation
- 6.4.6 Hewlett Packard Enterprise (HPE)
- 6.4.7 Dell Technologies Inc.
- 6.4.8 Google LLC (Alphabet Inc.)
- 6.4.9 Intel Corporation
- 6.4.10 NVIDIA Corporation
- 6.4.11 Juniper Networks Inc.
- 6.4.12 Advantech Co. Ltd.
- 6.4.13 ADLINK Technology Inc.
- 6.4.14 Schneider Electric SE
- 6.4.15 Siemens AG
- 6.4.16 Capgemini Engineering
- 6.4.17 MachineShop Inc.
- 6.4.18 Vapor IO Inc.
- 6.4.19 Litmus Automation
- 6.4.20 FogHorn Systems
- 6.4.21 Lumen Technologies Inc.
7 MARKET OPPORTUNITIES AND FUTURE OUTLOOK
- 7.1 White-Space and Unmet-Need Assessment