
|
시장보고서
상품코드
2119767
데이터 통합 : 시장 점유율 분석, 업계 동향 및 통계, 성장 예측(2026-2031년)Data Integration - Market Share Analysis, Industry Trends & Statistics, Growth Forecasts (2026 - 2031) |
||||||
 Mordor Intelligence
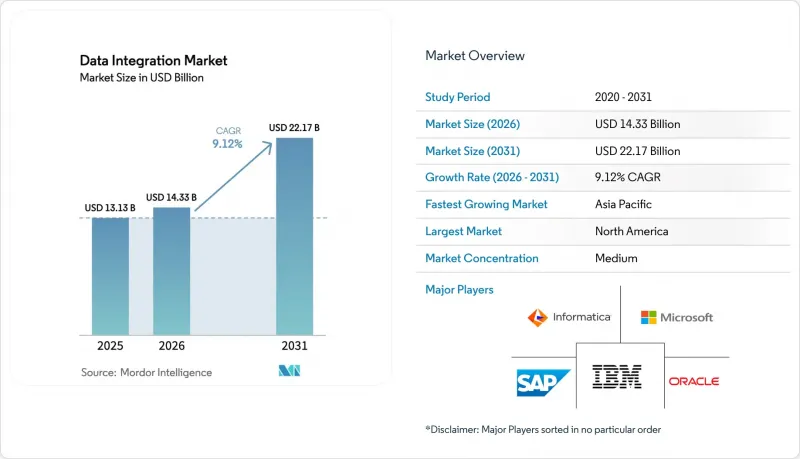
Mordor Intelligence에 의하면, 데이터 통합 시장 규모는 2025년 131억 3,000만 달러로 평가되었습니다. 2026년에는 143억 3,000만 달러로 확대되어 2026년부터 2031년에 걸쳐 CAGR 9.12%로 성장을 지속하여, 2031년에는 221억 7,000만 달러에 이를 것으로 예측됩니다.
본 보고서는 구성 요소(도구, 서비스), 도입 형태(클라우드, On-Premise), 기업 규모(초소기업(1-49명), 중소기업(50-249명), 기타),용도(고객·판매 분석, 업무·공급망 최적화 등), 최종 사용자 업종(IT 및 통신, 은행, 금융서비스 및 보험(BFSI), 헬스케어 및 생명과학 등), 지역별로 분류되어 있습니다. 시장 예측은 금액(달러) 기준으로 제시되어 있습니다.
세계의 데이터 통합 시장 동향 및 인사이트
엔터프라이즈 스택의 ‘클라우드 퍼스트’를 통한 현대화
2025년까지 포춘 100대 기업의 대부분이 통합 워크로드를 구독형 클라우드 서비스로 전환하여 인프라 비용 절감과 업그레이드 간소화를 실현했습니다. 10억 달러가 넘는 클라우드 연구 개발(R&D) 투자를 통해 온디맨드 방식으로 스키마를 읽는 ‘제로 ETL’ 패턴이 촉진되었으며, 팀은 획일적이고 사전 정의된 변환 작업에서 해방되었습니다. HCLTech와 유니레버의 협력 사례 등에서 볼 수 있듯이, 클라우드 네이티브 통합을 도입한 결과 인프라 비용을 30% 절감할 수 있었습니다. 각 벤더들은 데이터 웨어하우스와 데이터 레이크를 통합하는 ‘레이크하우스’ 설계에 주력하고 있으며, Iceberg 및 Delta 형식을 통해 플랫폼 간 개방형 파일 스토리지가 가능해졌습니다. 매니지드 레이크 서비스는 500개 이상의 소스에 대한 테이블 유지 관리 및 형식 변환을 자동화함으로써 도입을 더욱 가속화했습니다.
배치 ETL에서 실시간 스트리밍 및 CDC로의 전환
2024년에 출시된 스트리밍형 리버스 ETL 도구는 데이터 웨어하우스 테이블과 업무 시스템을 몇 초 이내에 동기화하여 실시간 고객 참여를 지원했습니다. 금융 기관은 CDC 파이프라인을 통합하여 부정 감지 소요 시간을 몇 시간에서 몇 초로 단축했습니다. 제조 기업은 IoT 스트림을 활용하여 기계 고장을 예측하고, 예상치 못한 가동 중단 시간을 40% 줄였습니다. ‘제로 ETL’이라는 개념이 등장하여 원시 데이터를 스토어 간에 직접 이동시키고, 쿼리 실행 시 변환을 적용함으로써 지연 시간과 운영 비용을 대폭 절감했습니다. 클라우드 플랫폼은 ‘Dynamic Tables’ 및 ‘Delta Live Tables’와 같은 선언형 스트리밍 서비스를 통해 오케스트레이션을 간소화했습니다.
고도화된 통합 아키텍처 분야의 인력 부족
2025년, 기업의 76%가 AI 및 데이터 엔지니어링 인력이 심각하게 부족하다고 보고했으며, 이는 도입 지연과 컨설팅 비용 증가로 이어졌습니다. 보안, 네트워크, 데이터 관련 기술에 대해서는 각각 35%가 넘는 부족 현상이 나타나, CIO들은 기술 향상 프로그램이나 매니지드 서비스와의 제휴에 자금을 투자할 수밖에 없게 되었습니다. 조사에 따르면, 인력 부족으로 인해 2026년까지 전 세계 생산액에서 5조 5,000억 달러가 손실될 것으로 예측되고 있습니다. 유럽의 제조업체들은 자동화 및 그린 기술 분야의 기술 인력이 특히 부족하다고 지적하고 있으며, 중규모 공장 전반에 걸쳐 프로젝트 지연이 발생하고 있습니다. 이러한 제약으로 인해 명확한 ROI가 예상에도 불구하고, 실시간 스트리밍, 시맨틱 레이어, 엣지 파이프라인의 도입이 둔화되었습니다.
부문별 분석
조직들이 클라우드 전환, 스트리밍 아키텍처, 규정 준수 프레임워크에 대한 전문가의 지도를 요구함에 따라 서비스 매출은 2031년까지 연평균 성장률(CAGR) 14.08%로 성장할 전망입니다. 도구 부문은 2025년에도 데이터 통합 시장의 63.85%를 차지하며, ETL, CDC, 가상화 플랫폼이 확고히 자리 잡았음을 반영했습니다. 전문 서비스는 시맨틱 레이어 도입 및 생성형 AI 통합을 중심으로 급증했습니다. 이러한 분야에서는 맞춤형 거버넌스와 윤리적 설계가 필수적이었습니다. 매니지드 서비스는 연중무휴 24시간 모니터링과 멀티 클라우드 파이프라인의 자동 최적화를 통해 인기를 얻었습니다.
도구 분야에서는 배치 처리 워크로드를 위한 ETL/ELT 제품군이 여전히 주요 투자 대상인 반면, 실시간 분석을 위한 CDC 엔진의 도입이 탄력을 받았습니다. 스트리밍 플랫폼은 IoT 시나리오에서 필수적인 요소가 되었으며, 스토리지와의 액세스를 분리하는 메쉬 아키텍처의 보급에 따라 데이터 가상화도 확대되었습니다. AI 모델이 신뢰할 수 있는 입력을 필요로 하게 되면서, 데이터 품질 및 마스터 데이터 관리 도구의 중요성이 재인식되었습니다. 기술 격차가 확대됨에 따라, 이러한 다양한 제품을 통합된 솔루션으로 구축할 수 있는 서비스 제공업체에 대한 수요가 더욱 높아졌습니다.
하이브리드 구성은 연평균 성장률(CAGR) 16.62%를 기록하며, 데이터 전략 의사결정을 좌우하는 ‘주권’과 ‘유연성’의 상충 관계를 반영하고 있습니다. 하이퍼스케일러가 탄력적인 확장성과 풍부한 네이티브 서비스 생태계를 제공함에 따라 퍼블릭 클라우드는 전체적으로 가장 큰 점유율을 유지했습니다. 반면, 금융 및 의료와 같이 규제가 엄격한 환경에서는 하드웨어 및 네트워크 구성 관리가 여전히 필수적이기 때문에 프라이빗 클라우드가 계속해서 자리 잡았습니다.
On-Premise 환경은 규모가 축소되었지만, 레거시 메인프레임이나 지연 시간에 민감한 워크로드를 지원하는 형태로 존속했습니다. 엣지 노드는 마이크로 통합 지점으로 부상하여, 센서 데이터를 로컬에서 처리한 후 그 요약 정보를 중앙 스토리지에 전송하게 되었습니다. 하이브리드 클라우드 도입에 따른 데이터 통합 시장 규모는 중앙 집중식 거버넌스를 유지하면서 도메인 팀 간의 협력을 도모하는 메쉬형 아키텍처를 채택하는 기업이 늘어남에 따라 꾸준히 확대될 것으로 예측됩니다. 데이터 웨어하우스, 데이터 레이크, 엣지 클러스터를 아우르는 단일 제어 플레인이 플랫폼에 도입됨에 따라 그 채택 속도가 가속화되었습니다.
지역별 분석
북미는 클라우드의 조기 도입, 견조한 벤처 자금 조달, 그리고 시스템 통합사업자에 의한 긴밀한 생태계 덕분에 2025년에는 전 세계 매출의 38.35%를 차지했습니다. 650억 달러 규모의 송전망 현대화 패키지를 포함한 연방 정부의 인프라 프로그램이 실시간 에너지 데이터 통합에 대한 추가 수요를 견인했습니다. 캐나다도 유사한 추세를 보였으며, 국경을 초월한 규정 준수를 추진하는 한편 의료 및 금융 서비스 현대화에 투자했습니다.
아시아태평양은 하이퍼스케일 데이터센터의 구축과 대규모 공공 부문 디지털화 프로젝트에 힘입어 연평균 성장률(CAGR) 17.78%라는 가장 높은 성장률을 기록했습니다. 중국은 스트리밍 데이터 플랫폼이 필요한 스마트 그리드 업그레이드에 4,420억 달러를 투입한 반면, 인도는 분석 기능을 핵심으로 통합한 인프라에 3조 300억 루피(120억 달러)를 배정했습니다. 일본의 1,550억 달러 규모의 디지털 인프라 예산은 데이터 통합 시장의 잠재 고객 기반을 더욱 확대시켰습니다. 그러나 현지 데이터 현지화 법에 따라 데이터를 선택적으로 집계하기 전에 국내에서 처리하는 하이브리드 아키텍처가 촉진되었습니다.
유럽에서는 개인정보 보호 규제에도 불구하고 견조한 성장세가 나타났습니다. 유럽연합 집행위원회는 2030년까지 5,840억 유로(6,698억 7,000만 달러) 규모의 스마트 그리드 투자를 계획하고 있으며, 재생에너지 발전 데이터와 소비자 수요 반응을 결합한 통합 프로젝트를 지원하고 있습니다. 은행 업계에서는 DORA 준수를 위한 지출이 급증한 반면, GDPR(EU 개인정보보호규정)을 준수하는 엣지 솔루션을 통해 기업들은 데이터를 현지에서 분석할 수 있게 되었습니다. 전반적으로, 소버린 클라우드와 개방형 표준이 규제상의 역풍을 완화함에 따라, 해당 지역의 데이터 통합 시장 규모는 꾸준히 확대될 것으로 예측됩니다.
기타 혜택 :
- 엑셀 형식 시장 예측(ME) 시트
- 3개월간의 애널리스트 지원
자주 묻는 질문
목차
제1장 서론
제2장 조사 방법
제3장 주요 요약
제4장 시장 구도
제5장 시장 규모 및 성장 예측
제6장 경쟁 구도
제7장 시장 기회 및 향후 전망
KTH 26.09.04According to Mordor Intelligence, the data integration market size is expected to grow from USD 13.13 billion in 2025 to USD 14.33 billion in 2026 and is forecast to reach USD 22.17 billion by 2031 at 9.12% CAGR over 2026-2031.
This report is Segmented Component (Tools, Services), Deployment (Cloud, On-Premise), Enterprise Size (Micro Enterprises (1-49), Small Enterprises (50-249), and More), Application (Customer and Sales Analytics, Operations and Supply-Chain Optimisation, and More), End-User Vertical (IT and Telecom, BFSI, Healthcare and Life Sciences, and More), and Geography. The Market Forecasts are Provided in Terms of Value (USD).
Global Data Integration Market Trends and Insights
Cloud-first modernisation of enterprise stacks
By 2025, most Fortune 100 firms had shifted integration workloads into subscription cloud services, cutting infrastructure costs and simplifying upgrades. Cloud R&D investments exceeding USD 1 billion spurred zero-ETL patterns that read schemas on demand, freeing teams from rigid pre-defined transformations. Case studies such as HCLTech's engagement with Unilever showed 30% infrastructure savings after embracing cloud-native integration. Vendors converged on lakehouse designs that unite warehouses and data lakes, with Iceberg and Delta formats enabling open file storage across platforms. Managed lake services further accelerated adoption by automating table maintenance and format conversion for more than 500 sources.
Shift from batch ETL to real-time streaming and CDC
Streaming reverse ETL tools launched in 2024 synchronised data warehouse tables to operational systems within seconds, supporting live customer engagement. Financial institutions integrated CDC pipelines that cut fraud detection windows from hours to seconds. Manufacturing firms applied IoT streams to predict machine failure, reducing unplanned downtime by 40%. Zero-ETL concepts emerged, moving raw data directly between stores while applying transformations at query time, slashing latency and operating cost. Cloud platforms simplified orchestration via declarative streaming services such as Dynamic Tables and Delta Live Tables.
Talent shortage in advanced integration architectures
In 2025, 76% of enterprises reported severe shortages in AI and data engineering talent, delaying deployments and inflating consulting spend. Security, networking, and data skills each showed gaps exceeding 35%, forcing CIOs to fund upskilling programs and managed services partnerships. Surveys projected the talent deficit could drain USD 5.5 trillion from global output by 2026. European manufacturers highlighted automation and green-tech skills as especially scarce, leading to project backlogs across mid-sized plants. These constraints slowed the rollout of real-time streaming, semantic layers, and edge pipelines despite clear ROI potential.
Other drivers and restraints analyzed in the detailed report include:
- Regulatory push for data lineage and auditability
- Emergence of generative-AI-ready semantic data layers
- Data-sovereignty restrictions splintering multi-region pipelines
For complete list of drivers and restraints, kindly check the Table Of Contents.
Segment Analysis
Services revenue expanded at a 14.08% CAGR through 2031 as organizations sought expert guidance on cloud migrations, streaming architectures, and compliance frameworks. The tools category still held 63.85% of the data integration market in 2025, reflecting entrenched ETL, CDC, and virtualisation platforms. Professional services surged around semantic layer rollouts and generative-AI integration, where tailored governance and ethical design were vital. Managed services gained popularity for 24/7 monitoring and automated optimisation of multi-cloud pipelines.
Within tools, ETL/ELT suites remained staple investments for batch workloads, while CDC engines gained momentum for instant analytics. Streaming platforms became critical in IoT scenarios, and data virtualisation rose alongside mesh architectures that decouple access from storage. Data quality and master data management tools found renewed relevance as AI models demanded trusted inputs. The widening skills gap further amplified demand for service providers who can orchestrate these diverse products into cohesive solutions.
Hybrid configurations recorded a 16.62% CAGR, reflecting the trade-off between sovereignty and flexibility that dominates data strategy decisions. Public cloud retained the largest overall share because hyperscalers offered elastic scale and a rich ecosystem of native services. Private clouds persisted in highly regulated environments such as finance and healthcare, where control over hardware and network configurations remained essential.
On-premise estates shrank but did not disappear, supporting legacy mainframes and latency-sensitive workloads. Edge nodes emerged as micro-integration points, processing sensor data locally before forwarding summaries to central stores. The data integration market size for hybrid-cloud deployments is forecast to expand steadily as more firms adopt mesh patterns that federate domain teams while sustaining centralized governance. Adoption accelerated as platforms introduced single control planes spanning warehouses, lakes, and edge clusters.
Complete Report Scope:
- By Component
- Tools
- ETL and ELT Platforms
- Data Replication and CDC
- Data Virtualisation
- Streaming Integration
- Data Quality and MDM Tools
- Services
- Professional Services
- Managed Services
- Tools
- By Deployment
- Cloud
- Public Cloud
- Private Cloud
- Hybrid Cloud
- On-Premise
- Cloud
- By Enterprise Size
- Micro Enterprises (1-49)
- Small Enterprises (50-249)
- Medium Enterprises (250-999)
- Large Enterprises (1,000+)
- By Application
- Customer and Sales Analytics
- Operations and Supply-chain Optimisation
- Marketing Analytics
- Finance and Risk Management
- Human Resources Analytics
- Product and RandD Data Integration
- Others
- By End-user Vertical
- IT and Telecom
- BFSI
- Healthcare and Life Sciences
- Manufacturing
- Retail and E-commerce
- Government and Defense
- Energy and Utilities
- Media and Entertainment
- Others
- By Geography
- North America
- United States
- Canada
- Mexico
- South America
- Brazil
- Argentina
- Rest of South America
- Europe
- Germany
- United Kingdom
- France
- Italy
- Spain
- Nordics
- Benelux
- Russia
- Rest of Europe
- Asia-Pacific
- China
- India
- Japan
- South Korea
- ASEAN
- Rest of Asia-Pacific
- Middle East and Africa
- Middle East
- GCC
- Turkey
- Rest of Middle East
- Africa
- South Africa
- Nigeria
- Egypt
- Rest of Africa
- Middle East
- North America
Geography Analysis
North America held 38.35% of global revenue in 2025 thanks to early cloud adoption, robust venture funding, and a dense ecosystem of system integrators. Federal infrastructure programs, including a USD 65 billion grid modernisation package, drove additional demand for real-time energy data integration. Canada mirrored these patterns, investing in healthcare and financial services modernization while navigating cross-border compliance.
Asia-Pacific delivered the fastest growth at an 17.78% CAGR, fuelled by hyperscale data-center rollouts and large public-sector digitalisation projects. China earmarked USD 442 billion for smart-grid upgrades that require streaming data platforms, while India allocated INR 3.03 trillion (USD 0.012 trillion) to infrastructure that embeds analytics at its core. Japan's USD 155 billion in digital infrastructure budgets further expanded the addressable base for the data integration market. Local data-localisation laws, however, encouraged hybrid architectures that process data in-country before selective aggregation.
Europe showed solid momentum despite privacy rules. The European Commission planned EUR 584 billion (USD 669.87 billion) in smart-grid investments by 2030, spurring integration projects that combine renewable generation data with consumer demand response. DORA compliance spending escalated within banking, while GDPR-aligned edge solutions let enterprises analyse data locally. Overall, the data integration market size for the region is projected to climb steadily as sovereign clouds and open standards mitigate regulatory headwinds.
- Informatica Inc.
- IBM Corporation
- Microsoft Corporation
- SAP SE
- Oracle Corporation
- SAS Institute Inc.
- Denodo Technologies
- TIBCO Software Inc.
- QlikTech International AB
- Precisely
- Talend S.A.
- Fivetran Inc.
- Boomi LP
- SnapLogic Inc.
- MuleSoft LLC (Salesforce)
- Matillion Ltd
- Amazon Web Services, Inc.
- Google LLC
- HVR Software BV
- Airbyte Inc.
- Celigo Inc.
- Tray.io Inc.
- Alteryx Inc.
- SyncMatters Ltd.
- Hitachi Vantara LLC
Additional Benefits:
- The market estimate (ME) sheet in Excel format
- 3 months of analyst support
TABLE OF CONTENTS
1 INTRODUCTION
- 1.1 Study Assumptions and Market Definition
- 1.2 Scope of the Study
2 RESEARCH METHODOLOGY
3 EXECUTIVE SUMMARY
4 MARKET LANDSCAPE
- 4.1 Market Overview
- 4.2 Market Drivers
- 4.2.1 Cloud-first modernisation of enterprise stacks
- 4.2.2 Shift from batch ETL to real-time streaming and CDC
- 4.2.3 Self-service, low-code data pipelines for citizen developers
- 4.2.4 Regulatory push for data lineage and auditability (e.g., DORA, HIPAA 21st Cures)
- 4.2.5 Emergence of generative-AI-ready semantic data layers (under-reported)
- 4.2.6 Edge and in-sensor analytics creating micro-integration nodes (under-reported)
- 4.3 Market Restraints
- 4.3.1 Talent shortage in advanced integration architectures
- 4.3.2 Escalating cloud egress and data-movement costs
- 4.3.3 Data-sovereignty restrictions splintering multi-region pipelines (under-reported)
- 4.3.4 Vendor lock-in risk from proprietary iPaaS ecosystems (under-reported)
- 4.4 Value / Supply-Chain Analysis
- 4.5 Regulatory Landscape
- 4.6 Technological Outlook
- 4.7 Porter's Five Forces Analysis
- 4.7.1 Bargaining Power of Buyers
- 4.7.2 Bargaining Power of Suppliers
- 4.7.3 Threat of New Entrants
- 4.7.4 Threat of Substitutes
- 4.7.5 Intensity of Competitive Rivalry
- 4.8 Macro-Economic Factors Impacting the Market
- 4.9 Investment Analysis
5 MARKET SIZE AND GROWTH FORECASTS (VALUE)
- 5.1 By Component
- 5.1.1 Tools
- 5.1.1.1 ETL and ELT Platforms
- 5.1.1.2 Data Replication and CDC
- 5.1.1.3 Data Virtualisation
- 5.1.1.4 Streaming Integration
- 5.1.1.5 Data Quality and MDM Tools
- 5.1.2 Services
- 5.1.2.1 Professional Services
- 5.1.2.2 Managed Services
- 5.1.1 Tools
- 5.2 By Deployment
- 5.2.1 Cloud
- 5.2.1.1 Public Cloud
- 5.2.1.2 Private Cloud
- 5.2.1.3 Hybrid Cloud
- 5.2.2 On-Premise
- 5.2.1 Cloud
- 5.3 By Enterprise Size
- 5.3.1 Micro Enterprises (1-49)
- 5.3.2 Small Enterprises (50-249)
- 5.3.3 Medium Enterprises (250-999)
- 5.3.4 Large Enterprises (1,000+)
- 5.4 By Application
- 5.4.1 Customer and Sales Analytics
- 5.4.2 Operations and Supply-chain Optimisation
- 5.4.3 Marketing Analytics
- 5.4.4 Finance and Risk Management
- 5.4.5 Human Resources Analytics
- 5.4.6 Product and RandD Data Integration
- 5.4.7 Others
- 5.5 By End-user Vertical
- 5.5.1 IT and Telecom
- 5.5.2 BFSI
- 5.5.3 Healthcare and Life Sciences
- 5.5.4 Manufacturing
- 5.5.5 Retail and E-commerce
- 5.5.6 Government and Defense
- 5.5.7 Energy and Utilities
- 5.5.8 Media and Entertainment
- 5.5.9 Others
- 5.6 By Geography
- 5.6.1 North America
- 5.6.1.1 United States
- 5.6.1.2 Canada
- 5.6.1.3 Mexico
- 5.6.2 South America
- 5.6.2.1 Brazil
- 5.6.2.2 Argentina
- 5.6.2.3 Rest of South America
- 5.6.3 Europe
- 5.6.3.1 Germany
- 5.6.3.2 United Kingdom
- 5.6.3.3 France
- 5.6.3.4 Italy
- 5.6.3.5 Spain
- 5.6.3.6 Nordics
- 5.6.3.7 Benelux
- 5.6.3.8 Russia
- 5.6.3.9 Rest of Europe
- 5.6.4 Asia-Pacific
- 5.6.4.1 China
- 5.6.4.2 India
- 5.6.4.3 Japan
- 5.6.4.4 South Korea
- 5.6.4.5 ASEAN
- 5.6.4.6 Rest of Asia-Pacific
- 5.6.5 Middle East and Africa
- 5.6.5.1 Middle East
- 5.6.5.1.1 GCC
- 5.6.5.1.2 Turkey
- 5.6.5.1.3 Rest of Middle East
- 5.6.5.2 Africa
- 5.6.5.2.1 South Africa
- 5.6.5.2.2 Nigeria
- 5.6.5.2.3 Egypt
- 5.6.5.2.4 Rest of Africa
- 5.6.5.1 Middle East
- 5.6.1 North America
6 COMPETITIVE LANDSCAPE
- 6.1 Market Concentration
- 6.2 Strategic Moves
- 6.3 Market Share Analysis
- 6.4 Company Profiles (includes Global level Overview, Market level overview, Core Segments, Financials as available, Strategic Information, Market Rank/Share, Products and Services, Recent Developments)
- 6.4.1 Informatica Inc.
- 6.4.2 IBM Corporation
- 6.4.3 Microsoft Corporation
- 6.4.4 SAP SE
- 6.4.5 Oracle Corporation
- 6.4.6 SAS Institute Inc.
- 6.4.7 Denodo Technologies
- 6.4.8 TIBCO Software Inc.
- 6.4.9 QlikTech International AB
- 6.4.10 Precisely
- 6.4.11 Talend S.A.
- 6.4.12 Fivetran Inc.
- 6.4.13 Boomi LP
- 6.4.14 SnapLogic Inc.
- 6.4.15 MuleSoft LLC (Salesforce)
- 6.4.16 Matillion Ltd
- 6.4.17 Amazon Web Services, Inc.
- 6.4.18 Google LLC
- 6.4.19 HVR Software BV
- 6.4.20 Airbyte Inc.
- 6.4.21 Celigo Inc.
- 6.4.22 Tray.io Inc.
- 6.4.23 Alteryx Inc.
- 6.4.24 SyncMatters Ltd.
- 6.4.25 Hitachi Vantara LLC
7 MARKET OPPORTUNITIES AND FUTURE OUTLOOK
- 7.1 White-space and Unmet-need Assessment