|
시장보고서
상품코드
2120327
발전기 : 시장 점유율 분석, 업계 동향과 통계, 성장 예측(2026-2031년)Generator Sets - Market Share Analysis, Industry Trends & Statistics, Growth Forecasts (2026 - 2031) |
||||||
 Mordor Intelligence
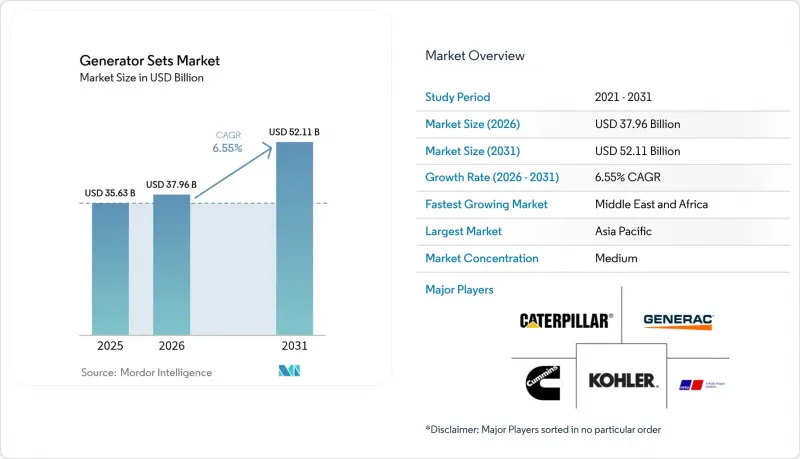
Mordor Intelligence에 따르면 발전기 시장 규모는 2025년에 356억 3,000만 달러로 평가되며, 2026년 379억 6,000만 달러에서 2031년까지 521억 1,000만 달러에 달할 것으로 예측되고 있으며, 예측 기간(2026-2031년)에 CAGR은 6.55%에 달할 전망입니다.
이 보고서는 용량(75 KVA 미만, 75-375 KVA, 375-750KVA, 기타), 연료 유형(디젤, 천연가스, 듀얼 연료 및 하이브리드, 기타),용도(예비 전원, 주 전원/연속 전원, 마이크로그리드 및 하이브리드 지원 등), 최종사용자(주거용, 산업·제조, 데이터센터 등) 및 지역(북미, 아시아태평양, 중동 및 아프리카 등)별로 분류되어 있습니다.
세계 발전기 시장의 동향 및 인사이트
신흥 경제국의 전력망 신뢰성에 대한 우려
개발도상 지역의 잦은 정전으로 인해 기업은 발전기를 주전원 및 예비전원으로 활용하여야 하는 상황에 계속 직면하고 있습니다. 나이지리아의 최대 발전량은 2024년에 6,003 MW에 달했으나, 공급 부족이 만성화되어 있으며, 많은 중규모 공장은 매일 몇 시간씩 75-375 kVA의 디젤 발전기를 가동할 수밖에 없는 상황에 처해 있습니다. 이와 유사한 불안정성은 동남아시아, 라틴아메리카, 사하라 이남 아프리카의 일부 지역으로도 확산되고 있으며, 예기치 못한 가동 중단으로 인한 생산 손실은 연료비나 유지보수비를 상회하고 있습니다. 신뢰성을 중시하는 태도로 인해 발전기 시장은 여전히 디젤에 확고하게 뿌리를 두고 있습니다. 이는 서비스 네트워크, 부품 가용성, 운영자의 숙련도 등의 측면에서 디젤이 가장 뛰어나기 때문입니다. 동시에, 전력 품질에 대한 우려로 인해 기업은 디지털 모니터링 및 예측 유지보수 모듈을 통합하여, 이미 도입된 발전기 군에서 더 높은 가동률을 이끌어내려고 노력하고 있습니다.
전 세계에서 급증하는 데이터센터 건설
하이퍼스케일 플랫폼, 코로케이션 제공업체 및 소버린 클라우드 프로그램은 가동률 100%의 인프라 구축에 적극적으로 투자하고 있습니다. ABB는 전력망 정전이 단 몇 분이라도 변동성이 큰 AI 워크로드에 악영향을 미치기 때문에 백업 발전이 설계상 필수 요건이라고 지적합니다. 이에 대응하여 엔지니어링·조달·건설(EPC) 기업은 원활한 병렬 운전이 가능하고 출력을 신속하게 조정할 수 있는 2,000 kVA를 초과하는 멀티블록 설계 솔루션을 제공하고 있습니다. 펜실베이니아주의 4.5GW 규모 천연가스 프로젝트에서는 미래를 내다본 데이터센터 하이퍼사이트에 맞춰 출력 규모가 구체적으로 설정되었습니다. Generac과 같은 공급업체들은 2025년 초, 이러한 캠퍼스를 위해 특별히 설계된 수소 대응 발전기를 시장에 출시했습니다. 이러한 동향으로 인해 조달 주기가 가속화되고 대용량 유닛의 판매량이 증가하는 한편, 지속가능성 평가 기준을 충족하기 위한 배기가스 후처리 기술에 대한 새로운 투자가 촉진되고 있습니다.
디젤 가격 변동 및 연료 공급 리스크
미국 디젤 연료의 평균 도매 가격은 2024년에 3.30달러에서 4.05달러 사이에서 변동한 후, 2025년에는 갤런당 3.61달러에 달할 것으로 예측됩니다. 산업용 주전원 사용자의 경우, 수명 주기 비용의 최대 70%를 연료비가 차지하므로 가격 및 공급의 불안정성은 운영 비용(OPEX)에 직접적인 압박을 가합니다. 운송 차질이나 정유소 가동 중단으로 인해 수 주간에 걸친 공급 부족이 발생하므로 외딴 지역의 광산이나 도서 지역의 전력망이 가장 큰 영향을 받기 쉬운 상황에 놓여 있습니다. 따라서 최종사용자들은 가스 파이프라인, LPG로의 전환, 혹은 1시간의 방전 시간을 지원하는 고정형 배터리 팩에 대한 타당성 조사를 가속화하고 있습니다. 디젤은 여전히 물류상 이점이 있지만, 조달 패턴에 있어서는 가격 변동을 헤지할 수 있는 선물 연료 계약이나 듀얼 연료 변환 키트를 세트로 제공할 수 있는 공급업체가 점점 더 중요시되고 있습니다.
부문 분석
75-375 kVA 발전기 시장 규모는 2025년에 139억 3,000만 달러에 달하여 전 세계 매출의 39.10%를 차지했습니다. 상업용 사무실, 중소기업, 엣지 데이터 시설에서는 출력과 합리적인 가격의 균형이 잘 잡혀 있으며, 이 범위의 제품이 중시되고 있습니다. 성장은 계속되고 있지만, 중국과 브라질에서는 이미 도입된 설비가 성숙기에 접어들면서 그 속도는 완만해지고 있습니다.
375-750 kVA 기종의 경우, 고밀도 HVAC(공조·환기·냉난방) 및 IoT 제어 부하를 도입하는 중규모 공장이나 고성능 빌딩에 힘입어 2031년까지 연평균 성장률(CAGR)이 8.95%로 더 높은 성장세가 예상됩니다. 각 제조사는 스마트 병렬 운전 키트와 도시 대기질 규제를 충족하는 Tier 4F 준수 제품으로 이에 대응하고 있습니다. 대형화된 발전기는 엘리베이터 군이나 반도체 제조 장비에 적합한 과도 응답 성능을 제공합니다. 더 큰 용량 대역(750-2000 kVA 및 2000 kVA 이상)은 하이퍼스케일 데이터센터, LNG 액화 플랜트 및 전력 회사의 피크 부하 완화용 설비에 활용됩니다. 캐터필러사가 7억 2,500만 달러를 투자한 인디애나주 확장 계획을 통해 대형 엔진의 생산 능력이 향상되었으며, 발전기 시장에서 이 고부가가치 분야의 점유율 확보를 도모하고 있습니다.
2025년, 디젤 엔진은 전 세계 매출의 70.85%를 차지했습니다. 이는 디젤 엔진의 에너지 밀도, 물류, 서비스 네트워크가 여전히 타의 추종을 불허하기 때문입니다. 규제 적용이 면제되는 지방의 광산이나 건설 현장에서는 여전히 Tier 2 또는 Tier 3 엔진이 지정되고 있습니다.
그러나 기업이 신뢰성을 희생하지 않으면서 ESG 목표 달성을 추구하는 가운데, 듀얼 연료 및 하이브리드 시스템은 연평균 성장률(CAGR) 10.2%를 기록하고 있으며, 이는 기준치인 5.29%를 크게 상회하는 수치입니다. 천연가스 발전기는 안정적인 파이프라인 요금을 활용하는 반면, 수소 혼합 키트는 캠퍼스가 탄소 중립 공약을 달성하기 위한 기반을 마련하고 있습니다. 미쓰비시, DEUTZ, Generac은 수소 대응 로드맵을 발표하며, 발전기 시장에서 연료 구성의 전환이 불가피함을 시사하고 있습니다. 바이오디젤 및 재생 가능 합성 연료는 ‘기타’ 범주로 분류되지만, 유럽의 ReFuelEU 프레임워크 하에서 정책적 지원을 받고 있습니다.
지역별 분석
2025년, 아시아태평양은 전 세계 매출의 36.65%를 차지했습니다. 중국의 연안 성에서는 공장 설비 갱신이 가속화되고 있으며, 인도의 ‘생산 연계형 인센티브(PLI)’ 제도에 따라 72시간의 내장애성을 확보하기 위해 250 kVA 디젤 발전기 2대를 표준 장비로 갖춘 클러스터가 형성되고 있습니다. 아세안(ASEAN) 국가들의 건설 붐이 임대 장비 수요를 끌어올리고 있는 반면, 한국과 일본에서는 병원 캠퍼스에서 수소 혼합 연료 시험이 진행되고 있습니다.
중동 및 아프리카는 연평균 성장률(CAGR) 9.35%로 가장 높은 성장률을 보이고 있습니다. GCC 국가들의 알루미늄, 데이터 파크, 그린 수소로의 다각화가 대기용 및 주전원용 발전 설비의 도입을 지원하고 있습니다. 이 지역의 전력 수요는 2020-2030년 사이에 29-37% 급증할 가능성이 있습니다. 나이지리아 전력 부문의 매출은 2024년에 70% 증가했으나, 공급 부족으로 인해 공장에서는 여전히 자가 발전 설비가 사용되고 있습니다.
북미에서는 꾸준한 교체 주기에 더해, 버지니아주와 텍사스주의 데이터센터 집적지에서 피크 시간대 수요 증가가 예상됩니다. 유럽의 스테이지 V 규제 동향에 따라 초점은 가스 및 수소 혼합 연료로 이동하고 있습니다. 한편, 남미에서는 광산용 트럭, 항만 확장, 그리고 가뭄으로 인한 수력 발전 공급 부족이 디젤 발전기 임대 수요를 촉진하고 있습니다. 따라서 발전기 시장은 지역적으로 균형 잡힌 포트폴리오를 보여주며, 경기 변동 위험을 완화하고 있습니다.
기타 혜택:
- 엑셀 형식의 시장 예측(ME) 시트
- 3개월간의 애널리스트 지원
자주 묻는 질문
목차
제1장 서론
제2장 조사 방법
제3장 개요
제4장 시장 구도
제5장 시장 규모와 성장 예측
제6장 경쟁 구도
제7장 시장 기회와 향후 전망
KSA 26.09.02According to Mordor Intelligence, the generator sets market size was valued at USD 35.63 billion in 2025 and estimated to grow from USD 37.96 billion in 2026 to reach USD 52.11 billion by 2031, at a CAGR of 6.55% during the forecast period (2026-2031).
This report is Segmented by Capacity (Below 75 KVA, 75 To 375 KVA, 375 To 750 KVA, and More), Fuel Type (Diesel, Natural Gas, Dual-Fuel and Hybrid, and More), Application (Standby Power, Prime/Continuous Power, Micro-Grid and Hybrid Support, and More), End-User (Residential, Industrial and Manufacturing, Data Centers, and More), and Geography (North America, Asia-Pacific, Middle East and Africa, and More).
Global Generator Sets Market Trends and Insights
Grid-reliability concerns in emerging economies
Frequent outages in developing regions continue to compel businesses to treat generator sets as primary and standby assets. Nigeria's peak generation touched 6,003 MW in 2024, yet persistent supply gaps required most mid-size factories to keep 75-375 kVA diesels running for several hours each day. Similar instability pervades parts of Southeast Asia, Latin America, and Sub-Saharan Africa, where manufacturing losses during unplanned downtime outweigh fuel and maintenance outlays. The reliability driver keeps the generator sets market firmly anchored in diesel because service networks, parts availability, and operator familiarity remain strongest for that fuel class. At the same time, power-quality worries are prompting enterprises to embed digital monitoring and predictive-maintenance modules to squeeze higher uptime from installed fleets.
Surging data-center build-outs worldwide
Hyperscale platforms, colocation providers, and sovereign-cloud programs are spending aggressively on 100% uptime infrastructure. ABB notes that even single-digit-minute utility-grid outages jeopardize turbulent AI workloads, cementing backup generation as a design imperative. Engineering, Procurement & Construction firms have responded with multi-block, above-2000 kVA designs that can parallel seamlessly and ramp quickly. Pennsylvania's 4.5 GW natural-gas project specifically sized its output around future-proof data-center hypersites. Vendors such as Generac introduced purpose-built, hydrogen-capable gensets for these campuses in early 2025. The trend accelerates procurement cycles, lifting high-capacity unit volume and spurring fresh investment in emissions-aftertreatment to satisfy sustainability scorecards.
Volatile diesel prices and fuel supply risks
Average wholesale diesel in the United States is forecast at USD 3.61 per gallon in 2025 after swinging between USD 3.30 and USD 4.05 during 2024. Industrial prime-power users attribute up to 70% of lifecycle cost to fuel, so unreliability in price and delivery exerts direct pressure on OPEX. Remote mines and island grids are most exposed because shipping disruptions or refinery outages create multi-week shortages. End users are therefore accelerating feasibility studies on gas pipelines, LPG swaps, or stationary battery packs sized for one-hour discharge windows. While diesel retains logistical advantages, procurement patterns increasingly favor suppliers able to bundle forward-fuel contracts or dual-fuel conversion kits that hedge volatility.
Other drivers and restraints analyzed in the detailed report include:
- Rapid industrialisation and construction activities
- Electrification gaps in off-grid telecom towers
- Stricter emission norms for stationary engines
For complete list of drivers and restraints, kindly check the Table Of Contents.
Segment Analysis
The generator sets market size for 75-375 kVA reached USD 13.93 billion in 2025, equal to 39.10% of global revenue. Commercial offices, SMEs, and edge-data facilities prize this range for its balance of power and affordability. Growth continues but moderates as installed fleets mature in China and Brazil.
A sharper 8.95% CAGR through 2031 is predicted for 375-750 kVA units, driven by medium-scale factories and high-performance buildings adopting dense HVAC and IoT control loads. Manufacturers respond with smart paralleling kits and Tier 4F compliance to satisfy urban air-quality ordinances. Enlarged alternators offer transient response suitable for elevator banks and semiconductor tools. Larger bands-750-2000 kVA and above-2000 kVA-serve hyperscale data centers, LNG liquefaction, and utility peak-shaving islands. Caterpillar's USD 725 million Indiana expansion boosts large-engine throughput to capture that premium slice of the generator sets market.
Diesel commanded 70.85% of global revenue in 2025 because its energy density, logistics, and service footprint remain unmatched. Rural mining and construction sites continue to specify Tier 2 or Tier 3 engines where regulatory waivers exist.
Yet dual-fuel and hybrid systems log a 10.2% CAGR, far above the 5.29% base-line, as enterprises chase ESG targets without sacrificing reliability. Natural-gas sets exploit stable pipeline tariffs, while hydrogen-blend kits position campuses for net-zero pledges. Mitsubishi, DEUTZ, and Generac have public hydrogen-ready roadmaps, signaling an inevitable mix shift inside the generator sets market. Bio-diesel and renewable synthetic fuels appear under the "Others" banner but gain policy support in Europe's ReFuelEU framework.
Complete Report Scope:
- By Capacity
- Below 75 kVA
- 75 to 375 kVA
- 375 to 750 kVA
- 750 to 2,000 kVA
- Above 2,000 kVA
- By Fuel Type
- Diesel
- Natural Gas
- Dual-Fuel and Hybrid
- Renewable/Bio-fuel
- Others
- By Application
- Standby Power
- Prime/Continuous Power
- Peak-Shaving
- Rental/Temporary Power
- Micro-grid and Hybrid Support
- By End-User
- Residential
- Commercial Buildings
- Industrial and Manufacturing
- Data Centers
- Healthcare Facilities
- Oil and Gas
- Utilities and Power
- Mining and Construction
- By Geography
- North America
- United States
- Canada
- Mexico
- Europe
- Germany
- United Kingdom
- France
- Italy
- NORDIC Countries
- Russia
- Rest of Europe
- Asia-Pacific
- China
- India
- Japan
- South Korea
- ASEAN Countries
- Rest of Asia-Pacific
- South America
- Brazil
- Argentina
- Rest of South America
- Middle East and Africa
- Saudi Arabia
- United Arab Emirates
- South Africa
- Egypt
- Rest of Middle East and Africa
- North America
Geography Analysis
Asia-Pacific commanded 36.65% of global revenue in 2025. Chinese coastal provinces accelerate factory upgrades, and India's Production-Linked Incentives spawn clusters that standardize on twin 250 kVA diesel units for 72-hour resilience. ASEAN construction booms add rental fleet demand, while Korea and Japan test hydrogen blends in hospital campuses.
The Middle East and Africa deliver the fastest 9.35% CAGR. GCC diversification toward aluminum, data parks, and green hydrogen drives standby and prime installations. Regional electricity demand could jump 29-37% between 2020 and 2030. Nigerian power-sector revenue rose 70% in 2024, yet supply gaps keep factories on captive sets.
North America yields steady replacement cycles plus peak growth in data-center corridors of Virginia and Texas. Europe's Stage V landscape shifts focus to gas and H2 blends, while South America benefits from mining trucks, port expansion, and drought-driven hydro shortfalls triggering diesel rentals. The generator sets market therefore shows a balanced geographic portfolio, cushioning cyclical risk.
- Caterpillar Inc.
- Cummins Inc.
- Generac Power Systems
- Kohler Co.
- Rolls-Royce Power Systems (MTU)
- AKSA Power Generation
- Briggs & Stratton Corporation
- Doosan Corporation
- Mitsubishi Heavy Industries Ltd.
- Wartsila Corporation
- Perkins Engines Company Ltd.
- Atlas Copco AB
- FG Wilson (CAT)
- HIMOINSA S.L.
- Yanmar Holdings Co. Ltd.
- Honda India Power Products Ltd.
- Kirloskar Oil Engines Ltd.
- Mahindra Powerol
- JCB Power Products
- Siemens Energy AG
- Aggreko Plc
Additional Benefits:
- The market estimate (ME) sheet in Excel format
- 3 months of analyst support
TABLE OF CONTENTS
1 Introduction
- 1.1 Scope of the Study
- 1.2 Market Definition & Study Assumptions
2 Research Methodology
3 Executive Summary
4 Market Landscape
- 4.1 Market Overview
- 4.2 Market Drivers
- 4.2.1 Grid-reliability concerns in emerging economies
- 4.2.2 Surging data-center build-outs worldwide
- 4.2.3 Rapid industrialisation & construction activities
- 4.2.4 Electrification gaps in off-grid telecom towers
- 4.2.5 Micro-grid & hybrid system integration demand
- 4.2.6 Hydrogen-ready dual-fuel gensets gaining traction
- 4.3 Market Restraints
- 4.3.1 Volatile diesel prices & fuel supply risks
- 4.3.2 Stricter emission norms for stationary engines
- 4.3.3 Rising adoption of battery-storage alternatives
- 4.3.4 Cap-ex hesitation amid decarb-linked investment cycles
- 4.4 Supply-Chain Analysis
- 4.5 Regulatory Landscape
- 4.6 Technological Outlook
- 4.7 Porter's Five Forces Analysis
- 4.7.1 Bargaining Power of Suppliers
- 4.7.1.1 Bargaining Power of Consumers
- 4.7.1.2 Threat of New Entrants
- 4.7.1.3 Threat of Substitute Products & Services
- 4.7.1.4 Intensity of Competitive Rivalry
- 4.7.1 Bargaining Power of Suppliers
5 Market Size & Growth Forecasts
- 5.1 By Capacity
- 5.1.1 Below 75 kVA
- 5.1.2 75 to 375 kVA
- 5.1.3 375 to 750 kVA
- 5.1.4 750 to 2,000 kVA
- 5.1.5 Above 2,000 kVA
- 5.2 By Fuel Type
- 5.2.1 Diesel
- 5.2.2 Natural Gas
- 5.2.3 Dual-Fuel and Hybrid
- 5.2.4 Renewable/Bio-fuel
- 5.2.5 Others
- 5.3 By Application
- 5.3.1 Standby Power
- 5.3.2 Prime/Continuous Power
- 5.3.3 Peak-Shaving
- 5.3.4 Rental/Temporary Power
- 5.3.5 Micro-grid and Hybrid Support
- 5.4 By End-User
- 5.4.1 Residential
- 5.4.2 Commercial Buildings
- 5.4.3 Industrial and Manufacturing
- 5.4.4 Data Centers
- 5.4.5 Healthcare Facilities
- 5.4.6 Oil and Gas
- 5.4.7 Utilities and Power
- 5.4.8 Mining and Construction
- 5.5 By Geography
- 5.5.1 North America
- 5.5.1.1 United States
- 5.5.1.2 Canada
- 5.5.1.3 Mexico
- 5.5.2 Europe
- 5.5.2.1 Germany
- 5.5.2.2 United Kingdom
- 5.5.2.3 France
- 5.5.2.4 Italy
- 5.5.2.5 NORDIC Countries
- 5.5.2.6 Russia
- 5.5.2.7 Rest of Europe
- 5.5.3 Asia-Pacific
- 5.5.3.1 China
- 5.5.3.2 India
- 5.5.3.3 Japan
- 5.5.3.4 South Korea
- 5.5.3.5 ASEAN Countries
- 5.5.3.6 Rest of Asia-Pacific
- 5.5.4 South America
- 5.5.4.1 Brazil
- 5.5.4.2 Argentina
- 5.5.4.3 Rest of South America
- 5.5.5 Middle East and Africa
- 5.5.5.1 Saudi Arabia
- 5.5.5.2 United Arab Emirates
- 5.5.5.3 South Africa
- 5.5.5.4 Egypt
- 5.5.5.5 Rest of Middle East and Africa
- 5.5.1 North America
6 Competitive Landscape
- 6.1 Market Concentration
- 6.2 Strategic Moves (M&A, Partnerships, PPAs)
- 6.3 Market Share Analysis (Market Rank/Share for key companies)
- 6.4 Company Profiles (includes Global level Overview, Market level overview, Core Segments, Financials as available, Strategic Information, Products & Services, and Recent Developments)
- 6.4.1 Caterpillar Inc.
- 6.4.2 Cummins Inc.
- 6.4.3 Generac Power Systems
- 6.4.4 Kohler Co.
- 6.4.5 Rolls-Royce Power Systems (MTU)
- 6.4.6 AKSA Power Generation
- 6.4.7 Briggs & Stratton Corporation
- 6.4.8 Doosan Corporation
- 6.4.9 Mitsubishi Heavy Industries Ltd.
- 6.4.10 Wartsila Corporation
- 6.4.11 Perkins Engines Company Ltd.
- 6.4.12 Atlas Copco AB
- 6.4.13 FG Wilson (CAT)
- 6.4.14 HIMOINSA S.L.
- 6.4.15 Yanmar Holdings Co. Ltd.
- 6.4.16 Honda India Power Products Ltd.
- 6.4.17 Kirloskar Oil Engines Ltd.
- 6.4.18 Mahindra Powerol
- 6.4.19 JCB Power Products
- 6.4.20 Siemens Energy AG
- 6.4.21 Aggreko Plc
7 Market Opportunities & Future Outlook
- 7.1 White-space & Unmet-Need Assessment