

|
시장보고서
상품코드
2120329
염소 : 시장 점유율 분석, 업계 동향과 통계, 성장 예측(2026-2031년)Chlorine - Market Share Analysis, Industry Trends & Statistics, Growth Forecasts (2026 - 2031) |
||||||
 Mordor Intelligence
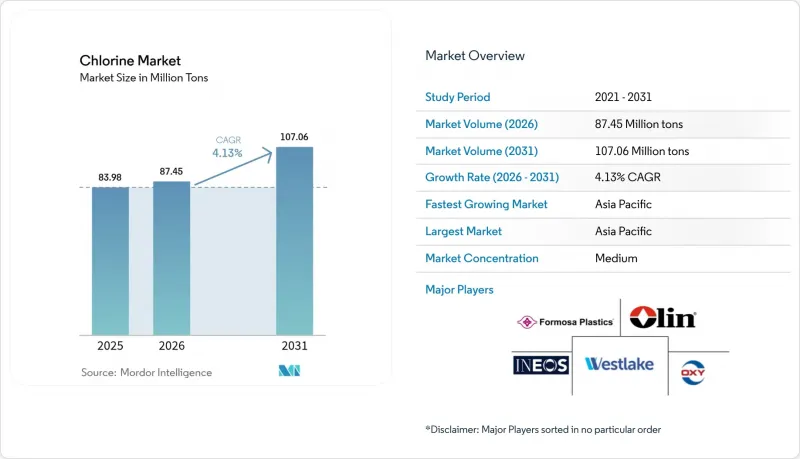
Mordor Intelligence에 따르면 염소 시장 규모는 2025년에 8,398만 톤으로 평가되며, 2026년 8,745만 톤에서 2031년까지 1억 706만 톤에 달할 것으로 예측되고 있으며, 예측 기간(2026-2031년)에 CAGR은 4.13%에 달할 전망입니다.
이 보고서는 용도별(EDC/PVC, 이소시아네이트 및 옥시게네이트, 클로로메탄, 용제 및 에피클로로히드린 등), 최종사용자 산업별(수처리, 제약, 화학,제지·펄프, 플라스틱, 농약 등) 및 지역별(아시아태평양, 북미, 유럽, 남미, 중동 및 아프리카)로 분류되어 있습니다. 시장 예측은 톤 단위로 제시되어 있습니다.
세계 염소 시장의 동향 및 인사이트
건설 및 포장 분야의 PVC 수요 급증
2025년에는 중국의 도시화 추진 및 인도의 10조 인도 루피(1,200억 달러) 규모 인프라 투자로 인해 파이프, 프로파일, 필름의 수요가 높은 수준을 유지함에 따라 PVC 수지 생산이 전 세계 염소 소비량의 33.42%를 차지했습니다. 가동률 격차는 여전히 크며, 유럽은 65-72%에 그치는 반면, 카타르 비닐 컴퍼니(Qatar Vinyl Company)는 2025년에 연간 35만 톤의 PVC 생산 능력을 추가할 예정입니다. 유럽연합(EU)의 재생재 함유율 의무화는 기계적 재활용을 통해 폴리머 사슬이 열화되는 경우, 역설적으로 버진 PVC의 수요를 끌어올리고 있습니다. 염소 시장 내의 통합형 비닐 생산 체인은 자사에서 사용하는 염소를 내부적으로 재분배할 수 있으므로 가격 변동을 완화할 수 있습니다. 이는 염소만을 취급하는 전문 무역회사에는 없는 강점입니다.
지자체 및 산업 폐수 처리에 대한 급속한 투자
2019년, 도시 지역의 소독 용도로 10억 3,900만 kg의 미국산 염소가 소비되었습니다. 또한 ‘자르 지반 미션(Jal Jivan Mission)’을 통해 2025년 1월까지 이미 1억 4,630만 가구의 인도 가정에 수돗물이 공급되고 있으며, 이러한 추세로 인해 해당 지역의 염소 시장 수요는 평균 이상의 속도로 증가할 것으로 예상됩니다. 유럽의 음용수 지침 2020/2184에 따라 상수도 사업자는 2026년까지 염소산염 기준치를 강화해야 할 의무가 있으며, 이로 인해 여전히 염소를 원료로 하는 현장용 차아염소산 발생 장치의 도입이 촉진되고 있습니다. 펄프, 섬유, 석유화학 플랜트의 산업 폐수 처리 분야에서는 전기 염소화가 도입되고 있으며, 이에 따라 염소는 규제 준수를 위한 로드맵에 더욱 깊이 통합되고 있습니다.
가성소다의 공급 과잉이 통합 기업의 이익률을 압박
전 세계적인 생산 확대에 따라 2024년에는 가성소다 가격이 수년 만에 최저 수준으로 하락했으며, 일부 유럽 판매업체들은 염소를 인수해 주도록 하기 위해 구매자에게 실제로 돈을 지불해야 하는 상황에 몰렸습니다. 이는 염소 시장에서 전례 없는 왜곡 현상입니다. 올린(Olin)사의 염소-알칼리 사업 매출은 2023년 3분기 6억 3,280만 달러에서 1년 후 5억 7,280만 달러로 감소하여, 이익률 압박이 입증되고 있습니다. 프랑스와 독일의 공장 폐쇄는 에너지 가격이 1MWh당 150유로를 초과하면 통합형 사업의 수익성이 무너진다는 것을 보여주고 있는 반면, 전력 비용이 1MWh당 20-30달러인 중동의 공장은 여전히 수익성을 유지하고 있습니다.
부문별 분석
2025년에는 EDC와 PVC가 전 세계 염소 수요의 33.42%를 차지하며, 비닐 통합이 제품별 변동에 대응하여 염소 시장의 규모를 안정시키고 있음이 확인되었습니다. 인도네시아 PT 찬드라 아슬리의 연간 110만 톤 규모의 EDC 플랜트와 같은 병행 투자는 동남아시아의 PVC 공급 부족을 보완하기 위한 것입니다. 이소시아네이트 및 옥시게네이트용 염소 시장 점유율은 단열재 및 자동차 경량화용 발포체 수요에 힘입어 가장 빠르게 확대될 전망입니다. 연속 흐름 방식으로 전환된 포스겐 반응기는 안전성을 높이는 동시에 MDI 1톤당 염소 소비량을 줄여주지만, 절대적인 성장 측면에서는 여전히 기초 생산량의 확대가 유리합니다.
2차 용도로는 클로로메탄, 용제, 에피클로로히드린, 무기 시약 등이 있습니다. 키갈리 개정안을 포함한 규제 움직임으로 인해 일부 냉매 경로는 단계적으로 감축되고 있지만, 중국과 인도에서의 이산화티타늄 및 염화철 생산은 다양화를 지속하며 염소 시장을 촉진하고 있습니다. 막식 전해조의 에너지 집약도는 현재 평균 2,000-2,200kWh/t이며, 산소 탈극화 음극에 대한 파일럿 시험에서는 20-30%의 추가 개선이 예상되어, 새로운 브라인 공급 없이도 생산 능력을 확보할 가능성이 있습니다.
지역별 분석
아시아태평양은 염소 시장을 독점하고 있으며, 2025년에는 세계 생산량의 64.17%를 차지하고, 2031년까지 연평균 성장률(CAGR) 4.76%를 기록할 전망입니다. 이는 중국의 4,216만 톤에 달하는 가성소다 생산량과 막식 전해조의 거의 완전한 보급에 힘입은 결과입니다. 인도의 70,163 카롤 인도 루피(84억 달러) 규모의 수자원 프로그램으로 인해 지자체의 수요는 계속 증가하고 있는 반면, 대만과 한국에서 건설 중인 42개의 최첨단 반도체 공장은 염소 수요의 일부를 5N 이상의 순도 범주로 전환시키고 있습니다.
북미에서는 셰일가스에 힘입은 전력 경쟁력으로 인해 가성소다 가격이 침체되어 있음에도 불구하고 걸프 코스트의 통합형 복합 시설은 경쟁력을 유지하고 있습니다. 올린(Olin)과 미쓰이물산(Mitsui & Co.)이 주도하는 ‘블루 워터 얼라이언스(Blue Water Alliance)’는 염소 시장의 공급량과 지역 가성소다 수요의 균형을 맞추는 자산 통합 모델로 자리 잡고 있습니다. 3자리 수에 달하는 전력 비용에 직면한 유럽에서는 합리화가 진행되고 있으며, 다우와 알케마는 2024-2027년에 총 40만 톤 이상의 생산 능력을 감축할 예정입니다. 2026년에 발효될 탄소국경조정메커니즘(CBAM)에 따른 관세는 수입 압력을 완화할 가능성이 있지만, 장기적인 비용 평형에 대해서는 여전히 불투명합니다.
브라질, 사우디아라비아, 남아프리카공화국은 규모는 작지만 전략적으로 중요한 염소 시장을 지탱하고 있습니다. 카타르 비닐 컴퍼니(Qatar Vinyl Company)의 연간 35만 톤 규모의 PVC 플랜트는 MWh당 20-30달러의 가스 화력 발전을 활용하고 있으며, 이를 통해 걸프 연안 국가의 수출업체들은 아프리카 및 남아시아로의 수출에서 운송 비용 면에서 우위를 확보하고 있습니다. 남아프리카에서는 계획 정전으로 인해 국내 전기 요금이 계속 변동하고 있으며, 중동으로부터의 수입에 호재가 되고 있습니다.
기타 혜택:
- 엑셀 형식의 시장 예측(ME) 시트
- 3개월간의 애널리스트 지원
자주 묻는 질문
목차
제1장 서론
제2장 조사 방법
제3장 개요
제4장 시장 구도
제5장 시장 규모와 성장 예측
제6장 경쟁 구도
제7장 시장 기회와 향후 전망
KSA 26.09.02According to Mordor Intelligence, the chlorine market size was valued at 83.98 Million tons in 2025 and is estimated to grow from 87.45 Million tons in 2026 to reach 107.06 Million tons by 2031, at a CAGR of 4.13% during the forecast period (2026-2031).
This report is Segmented by Application (EDC/PVC, Isocyanates and Oxygenates, Chloromethanes, Solvents and Epichlorohydrin, and More), End-User Industry (Water Treatment, Pharmaceutical, Chemicals, Paper and Pulp, Plastic, Pesticides, and More), and Geography (Asia-Pacific, North America, Europe, South America, and the Middle East and Africa). The Market Forecasts are Provided in Terms of Volume (tons).
Global Chlorine Market Trends and Insights
Surging PVC Demand in Construction and Packaging
PVC resin manufacture absorbed 33.42% of global chlorine in 2025 as China's urbanization push and India's infrastructure outlays of INR 10 trillion (USD 120 billion) kept pipe, profile, and film demand elevated. Operating-rate gaps remain wide, with Europe languishing at 65-72% and Qatar Vinyl Company adding 350,000 t pa of PVC in 2025. Recycled-content mandates in the European Union are paradoxically lifting virgin PVC offtake wherever mechanical recycling degrades polymer chains. Integrated vinyl chains inside the chlorine market soften price volatility because captive chlorine can be rebalanced internally, an edge pure-play merchants lack.
Rapid Municipal and Industrial Wastewater Investments
Municipal disinfection consumed 1,039 million kg of US chlorine in 2019, and the Jal Jeevan Mission has already extended tap water to 146.3 million Indian households by January 2025, a trajectory expected to raise regional chlorine market demand at above-average rates. Europe's Drinking Water Directive 2020/2184 forces utilities to tighten chlorate limits by 2026, favoring on-site hypochlorite generators that still require chlorine feedstock. Industrial wastewater treatment for pulp, textile, and petrochemical plants is adopting electro-chlorination, further embedding chlorine into compliance roadmaps.
Caustic-Soda Over-Supply Squeezing Integrated Margins
Worldwide expansions pushed caustic-soda prices to multi-year lows in 2024, forcing some European sellers to actually pay buyers to take chlorine away, an unprecedented distortion in the chlorine market. Olin's chlor-alkali revenue fell from USD 632.8 million in Q3 2023 to USD 572.8 million a year later, confirming margin compression. Plant closures in France and Germany illustrate how energy prices above EUR 150 MWh destroy integrated economics, whereas Middle Eastern units with USD 20-30 MWh power remain profitable.
Other drivers and restraints analyzed in the detailed report include:
- Pharmaceutical Generics Boom (Post-Patent Expiries)
- Battery-Grade Metal Chlorides for Solid-State EV Cells
- On-Site Electro-Chlorination Units Curbing Bulk Cl2 Haulage
For complete list of drivers and restraints, kindly check the Table Of Contents.
Segment Analysis
EDC and PVC absorbed 33.42% of the worldwide chlorine in 2025, confirming that vinyl integration stabilizes the chlorine market size against co-product swings. Parallel investments such as PT Chandra Asri's 1.1 million-t pa EDC unit in Indonesia are aimed at meeting Southeast Asian PVC shortfalls. The chlorine market share for isocyanates and oxygenates is poised to expand fastest, lifted by insulation and auto lightweighting foam needs. Phosgene reactors converted to continuous flow raise safety while shaving chlorine consumption per ton of MDI, yet absolute growth still favors higher basal volumes.
Secondary uses span chloromethanes, solvents, epichlorohydrin, and inorganic reagents. Regulatory moves, including the Kigali Amendment, are phasing down some refrigerant pathways, but titanium dioxide and ferric chloride output in China and India keeps diversified, drawing on the chlorine market. Membrane-cell energy intensity now averages 2,000-2,200 kWh/t, and oxygen-depolarized cathode pilots promise another 20-30% gain, potentially freeing capacity without new brine feeds.
Complete Report Scope:
- By Application
- EDC/PVC
- Isocyanates and Oxygenates
- Chloromethanes
- Solvents and Epichlorohydrin
- Inorganic Chemicals
- Other Applications
- By End-user Industry
- Water Treatment
- Pharmaceutical
- Chemicals
- Paper and Pulp
- Plastic
- Pesticides
- Other End-user Industries
- By Geography
- Asia-Pacific
- China
- India
- Japan
- South Korea
- ASEAN Countries
- Rest of Asia-Pacific
- North America
- United States
- Canada
- Mexico
- Europe
- Germany
- United Kingdom
- Italy
- France
- Spain
- NORDIC Countries
- Turkey
- Russia
- Rest of Europe
- South America
- Brazil
- Argentina
- Rest of South America
- Middle-East and Africa
- Saudi Arabia
- South Africa
- Rest of Middle-East and Africa
- Asia-Pacific
Geography Analysis
Asia-Pacific dominates the chlorine market, holding 64.17% of global volume in 2025 and set for a 4.76% CAGR through 2031, underpinned by China's 42.16 million-ton caustic-soda output and near-complete membrane-cell penetration. India's INR 70,163 crore (USD 8.4 billion) water program keeps municipal demand rising, while 42 leading-edge semiconductor fabs under construction in Taiwan and South Korea are shifting a slice of chlorine toward 5N-plus purity categories.
North America's shale-linked power advantage keeps integrated Gulf Coast complexes competitive even as caustic prices sag. Olin and Mitsui's Blue Water Alliance is a template for asset pooling that balances chlorine market volumes with regional caustic draw. Europe, facing triple-digit electricity costs, continues to rationalize, with Dow and Arkema trimming combined capacity by over 400,000 t between 2024 and 2027. Carbon Border Adjustment Mechanism tariffs, effective in 2026, could moderate import pressure, but long-term cost parity remains uncertain.
Brazil, Saudi Arabia, and South Africa anchor smaller but strategically relevant chlorine markets. Qatar Vinyl Company's 350,000 t pa PVC unit leverages USD 20-30 MWh gas-based power, giving Gulf exporters a freight-parity edge into Africa and South Asia. South Africa's load-shedding keeps domestic rates volatile, opening windows for imports from the Middle East.
- Anwil (Orlen)
- Arkema
- Covestro AG
- DOW
- Ercros S.A
- Formosa Plastics Group
- Hanwha Solutions
- INEOS
- Kem One
- Kuhlmann Europe
- Nobian
- Occidental Petroleum Corporation
- Olin Corporation
- Shivtek Spechemi Industries Ltd
- Spolchemie (KAPRAIN a.s.)
- Tata Chemicals Limited
- Tosoh Corporation
- Vencorex
- Vynova Group (ICIG HOLDING SE)
- Westlake Corporation
Additional Benefits:
- The market estimate (ME) sheet in Excel format
- 3 months of analyst support
TABLE OF CONTENTS
1 Introduction
- 1.1 Study Assumptions and Market Definition
- 1.2 Scope of the Study
2 Research Methodology
3 Executive Summary
4 Market Landscape
- 4.1 Market Overview
- 4.2 Market Drivers
- 4.2.1 Surging PVC demand in construction and packaging
- 4.2.2 Rapid municipal and industrial wastewater investments
- 4.2.3 Pharmaceutical generics boom (post-patent expiries)
- 4.2.4 Battery-grade metal chlorides for solid-state EV cells
- 4.2.5 Semiconductor etchant demand from sub-5 nm fabs
- 4.3 Market Restraints
- 4.3.1 Caustic-soda over-supply squeezing integrated margins
- 4.3.2 Bromine-based biocide substitution in cooling towers
- 4.3.3 On-site electro-chlorination units curbing bulk Cl2 haulage
- 4.4 Value Chain Analysis
- 4.5 Technological Snapshot
- 4.6 Porter's Five Forces
- 4.6.1 Bargaining Power of Suppliers
- 4.6.2 Bargaining Power of Consumers
- 4.6.3 Threat of New Entrants
- 4.6.4 Threat of Substitute Products and Services
- 4.6.5 Degree of Competition
- 4.7 Pricing Analysis
- 4.8 Import and Export Trends
5 Market Size and Growth Forecasts (Volume)
- 5.1 By Application
- 5.1.1 EDC/PVC
- 5.1.2 Isocyanates and Oxygenates
- 5.1.3 Chloromethanes
- 5.1.4 Solvents and Epichlorohydrin
- 5.1.5 Inorganic Chemicals
- 5.1.6 Other Applications
- 5.2 By End-user Industry
- 5.2.1 Water Treatment
- 5.2.2 Pharmaceutical
- 5.2.3 Chemicals
- 5.2.4 Paper and Pulp
- 5.2.5 Plastic
- 5.2.6 Pesticides
- 5.2.7 Other End-user Industries
- 5.3 By Geography
- 5.3.1 Asia-Pacific
- 5.3.1.1 China
- 5.3.1.2 India
- 5.3.1.3 Japan
- 5.3.1.4 South Korea
- 5.3.1.5 ASEAN Countries
- 5.3.1.6 Rest of Asia-Pacific
- 5.3.2 North America
- 5.3.2.1 United States
- 5.3.2.2 Canada
- 5.3.2.3 Mexico
- 5.3.3 Europe
- 5.3.3.1 Germany
- 5.3.3.2 United Kingdom
- 5.3.3.3 Italy
- 5.3.3.4 France
- 5.3.3.5 Spain
- 5.3.3.6 NORDIC Countries
- 5.3.3.7 Turkey
- 5.3.3.8 Russia
- 5.3.3.9 Rest of Europe
- 5.3.4 South America
- 5.3.4.1 Brazil
- 5.3.4.2 Argentina
- 5.3.4.3 Rest of South America
- 5.3.5 Middle-East and Africa
- 5.3.5.1 Saudi Arabia
- 5.3.5.2 South Africa
- 5.3.5.3 Rest of Middle-East and Africa
- 5.3.1 Asia-Pacific
6 Competitive Landscape
- 6.1 Market Concentration
- 6.2 Strategic Moves
- 6.3 Market Share(%)/Ranking Analysis
- 6.4 Company Profiles (includes Global Overview, Market Overview, Core Segments, Financials, Strategic Information, Products and Services, Recent Developments)
- 6.4.1 Anwil (Orlen)
- 6.4.2 Arkema
- 6.4.3 Covestro AG
- 6.4.4 DOW
- 6.4.5 Ercros S.A
- 6.4.6 Formosa Plastics Group
- 6.4.7 Hanwha Solutions
- 6.4.8 INEOS
- 6.4.9 Kem One
- 6.4.10 Kuhlmann Europe
- 6.4.11 Nobian
- 6.4.12 Occidental Petroleum Corporation
- 6.4.13 Olin Corporation
- 6.4.14 Shivtek Spechemi Industries Ltd
- 6.4.15 Spolchemie (KAPRAIN a.s.)
- 6.4.16 Tata Chemicals Limited
- 6.4.17 Tosoh Corporation
- 6.4.18 Vencorex
- 6.4.19 Vynova Group (ICIG HOLDING SE)
- 6.4.20 Westlake Corporation
7 Market Opportunities and Future Outlook
- 7.1 White-space and Unmet-need Assessment


