|
시장보고서
상품코드
2120446
구연산 : 시장 점유율 분석, 업계 동향 및 통계, 성장 예측(2026-2031년)Citric Acid - Market Share Analysis, Industry Trends & Statistics, Growth Forecasts (2026 - 2031) |
||||||
 Mordor Intelligence
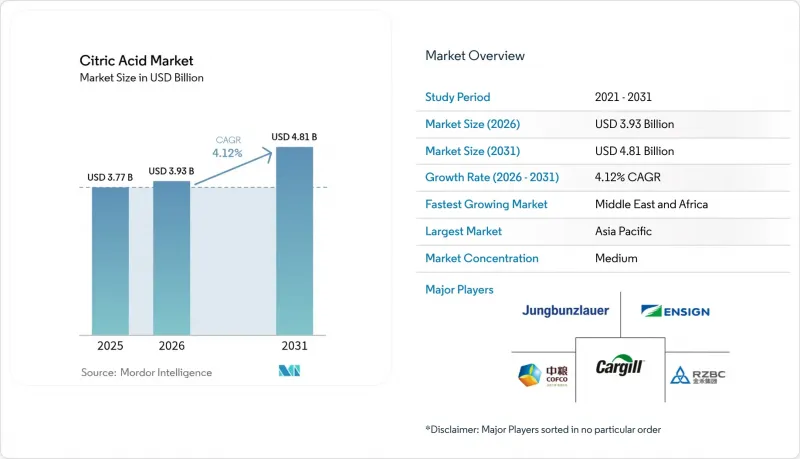
Mordor Intelligence에 의하면, 구연산 시장 규모는 2025년 37억 7,000만 달러로 평가되었습니다. 2026년에는 39억 3,000만 달러로 확대되어 2031년까지 48억 1,000만 달러에 이를 것으로 예상되고 2026-2031년에 걸쳐 CAGR 4.12%로 성장할 전망입니다.
본 보고서는 형태별(무수, 액체), 용도별(식음료(제빵, 과자류, 유제품, 음료, 반찬·스낵, 기타), 의약품, 퍼스널케어 및 화장품, 세제·가정용 세정제, 기타),지역별(북미, 유럽, 아시아태평양, 남미, 중동 및 아프리카)로 분류되어 있습니다. 시장 예측은 금액(미 달러)과 수량(톤)으로 제시되어 있습니다.
세계의 구연산 시장 동향 및 인사이트
가공 식음료 분야의 ‘클린 라벨’ 수요 급증
소비자가 인식하기 쉬운 원료를 선호하는 경향으로 인해, 식품 제조업체는 합성 방부제를 천연 유래 대체품으로 대체할 수밖에 없게 되었으며, 그 결과 구연산은 제빵, 제과, 유제품 부문에서 산미료와 항균제라는 이중 기능을 수행하는 것으로 자리매김하고 있습니다. 21 CFR 582.1033에 따라 FDA가 구연산을 ‘일반적으로 안전하다고 인정되는(GRAS)’ 직접 식품 첨가물로 인정함에 따라 규제상의 장벽이 해소되었고, 제품 개발자들은 소비자의 의구심을 불러일으키지 않고 성분 표기에 구연산을 기재할 수 있게 되었습니다. 음료 제조업체들은 구연산의 산미를 활용하여 저당 배합으로 인한 불쾌한 풍미를 가리고 있으며, 이러한 추세는 라틴아메리카와 동남아시아에서 설탕세가 확산됨에 따라 가속화되고 있습니다. 제빵 부문에서는 pH를 4.6 이하로 낮춤으로써 유통 기한을 연장하고, 소르빈산염이나 벤조산염에서 비롯되는 금속성 뒷맛을 남기지 않으면서 보툴리누스균의 증식을 억제하는 구연산의 특징이 활용되고 있습니다. ‘클린 라벨’에 대한 요구는 소매업체의 규제로 인해 더욱 강화되고 있습니다. 유럽의 대형 식료품 체인들은 현재 공급업체들에게 자사 브랜드 제품에서 E번호 첨가물을 배제할 것을 의무화하고 있으며, 이에 따라 프로피온산 칼슘이나 벤조산 나트륨보다 구연산을 우선적으로 사용하는 재처방 주기가 촉진되고 있습니다.
인산염 사용 금지에 따른 세제 내 구연산염 사용 확대
EU 규정(EC) 648/2004에 명시되어 있으며, 표준 사용량당 인 함량을 0.3그램으로 제한하는 개정안을 통해 강화된 가정용 세제 내 인산염에 대한 규제는 킬레이트제나 빌더로서 구연산 및 그 나트륨염으로의 대체를 촉진하고 있습니다. 구연산은 경수 속의 칼슘 이온과 마그네슘 이온을 포획하여 의류나 세탁기 부품에 스케일이 부착되는 것을 방지합니다. 또한, OECD 301B 프로토콜에 따른 생분해성 덕분에 인산염이 충족할 수 없는 환경 기준을 충족하고 있습니다. 2025년, 유럽의 가정용 세정 제품 소비량은 약 10만 톤에 달했으며, 그 대부분은 독일, 프랑스, 영국에서 소비되었습니다. 북미의 각 관할 구역도 이에 뒤따르고 있으며, 미국의 몇몇 주에서는 식기세척기용 세제에 대한 인산염 사용 금지를 법제화했고, 캐나다의 각 주에서도 유사한 조치가 검토되고 있습니다. 세제 부문의 2031년 연평균 성장률(CAGR) 6.03%는 규제에 의한 뒷받침뿐만 아니라, 구연산이 낮은 pH 값에서도 안정성을 유지함으로써 고농도 액상 유형의 제품화를 가능하게 하고, 포장 중량과 운송 시 배출량을 줄일 수 있다는 배합 개발자들의 인식을 반영하고 있습니다. 이는 브랜드가 지속가능성을 내세우는 가운데 얻을 수 있는 이중의 이점이 됩니다.
옥수수·설탕 가격 변동
구연산의 생산 경제성은 원료 비용에 좌우되며, 발효 공정에서 총 제조 비용의 40-50%를 당밀, 옥수수 침출액, 정제 설탕이 차지하고 있습니다. 2023/24년 산기 설탕 생산량은 전 세계적으로 1억 7,940만 톤에 달했고, 브라질은 3,400만 톤을 수출했으나, 가격은 여전히 이상 기후의 영향을 받기 쉬운 상황입니다. 태국과 인도에서 엘니뇨 현상으로 인한 가뭄이 발생하여 2024년 사탕수수 수확량이 감소했습니다. 이로 인해 당밀 공급이 부족해졌고, 현물 가격은 전년 대비 18-22% 상승했습니다. 미국과 유럽 생산자들에게 매우 중요한 옥수수 가격은 바이오연료 의무화 정책에 따라 변동하고 있습니다. 미국 재생 가능 연료 기준(RFS)이 연간 150억 갤런의 옥수수 에탄올을 의무화하고 있기 때문에 원료가 전용되며, 흉작이 든 해에는 경쟁이 격화됩니다. 비료 비용은 2022년 4월 톤당 815달러에서 2024년 4월에는 327달러로 급락하여 일시적인 완화를 가져왔으나, 컨테이너 운송의 혼란(홍해 우회 항로, 파나마 운하 선저 제한)에 따른 운임 변동으로 인해 2025년에는 당밀과 원당의 수입 비용이 12-15% 상승했습니다. 설탕 정제나 옥수수 습식 제분으로의 수직 통합이 미흡한 생산자는 원료 가격 상승이 비용을 하류로 전가하는 능력을 초과할 경우, 이익률 압박에 직면하게 됩니다. 특히 가격에 민감한 식품용 부문에서는 구매자가 계약 기간 중 가격 조정에 저항하기 때문에 이러한 경향이 두드러집니다.
부문별 분석
2025년에는 무수 구연산이 55.62%의 점유율로 시장을 장악하며, 습기에 민감한 건조 혼합 용도에서 그 입지를 확고히 했습니다. 그 결정 안정성은 분말 음료 믹스, 발포정, 제빵용 개량제에서 매우 중요하며, 중탄산염이나 흡습성 성분과의 조기 반응을 방지합니다. 2031년까지 연평균 성장률(CAGR) 5.80%를 나타낼 것으로 예측되는 액상 구연산은 수성 환경에서 정밀한 pH 조절과 취급의 용이성이 우선시되는 의약품 및 퍼스널케어 제품 부문에서 주목을 받고 있습니다. 제약 산업에서 액상 구강 분해 필름 및 소아용 시럽으로의 전환은 클린룸 내의 분진 및 정전기 문제를 피할 수 있다는 점에서 액상 구연산의 채택을 뒷받침하고 있습니다. 푸드서비스 업계 사업자들도 음료 제공이나 드레싱 제조 시 액상 형태를 선호하는데, 이는 미리 용해된 구연산을 사용함으로써 교반 작업이 필요 없어 인건비를 절감할 수 있기 때문입니다. 무수 구연산은 결정화 및 건조 공정을 통해 제조 비용이 낮다는 장점이 있지만, 액상 구연산 공급업체들은 발효 플랜트와 동일한 부지 내에 거점을 두어 물 운송 비용을 절감함으로써 그 격차를 좁혀가고 있습니다.
두 형태의 구연산 모두 ISO 9001 및 HACCP 기준을 준수합니다. 그러나 유엔 운송 규정에 따라 비위험 고체로 분류되는 무수 구연산은 부식성 물질(UN 1760, 제8류)로 지정되어, 전용 용기 및 취급이 필요한 액상 구연산에 비해 물류가 간소화됩니다. 분무 건조 및 유동층 과립 기술의 혁신으로, 무수 구연산 제조업체는 정제 제조용 거친 입자(40-100 메쉬)나 음료의 탁도를 제거하기 위한 미세 분말(200 메쉬 이상) 등 특정 용도에 맞추어 입자 크기를 맞춤 제작할 수 있게 되었습니다. 이러한 맞춤형 제품은 표준 무수 구연산에 비해 10-15% 높은 가격에 판매되고 있습니다. 이에 반해, 액상 구연산 공급업체들은 안정화된 제제로 대응하고 있습니다. 미량의 킬레이트화된 금속을 ppm 이하 수준으로 제거하여, 미량의 철이나 구리가 혼입되어도 변색이나 산화를 유발할 가능성이 있는 엄격한 화장품 및 주사용 의약품 기준을 충족하고 있습니다.
지역별 분석
2025년에는 아시아태평양이 35.43%의 시장 점유율을 차지했습니다. 이는 주로 중국의 견실한 생산 능력과 식품 가공 및 산업 부문에서의 국내 수요 급증에 기인합니다. 이 지역의 강점으로는 확립된 발효 인프라, 경쟁력 있는 생산 비용, 옥수수 및 사탕수수 유래 원료 등 주요 원료에 대한 용이한 접근성이 꼽힙니다. 그러나 무역 마찰과 반덤핑 조치로 인해 지역 정세는 변화하고 있습니다. 인도, 태국 및 기타 동남아시아 국가들은 내수 및 수출 수요를 모두 충족하기 위해 생산 능력을 확대되고 있습니다. 일본의 첨단 제약 및 식품 가공 부문은 유망한 시장 전망을 보이고 있는 반면, 호주의 급성장하는 음료 산업은 지역 소비를 뒷받침하고 있습니다.
중동 및 아프리카는 2031년까지 연평균 성장률(CAGR)이 6.56%를 나타낼 것으로 예측되어 주목받는 지역입니다. 이러한 성장은 주로 사우디아라비아나 아랍에미리트(UAE) 등 국가들의 급성장하는 식품 가공 부문과 인프라 투자에 기인합니다. 식량 안보 강화와 산업 다각화를 목표로 한 이 지역의 정부 주도적 노력이 구연산의 새로운 수요 기반을 창출하고 있습니다. NEOM이 Liberation Labs와 제휴하여 정밀 발효 시설을 설립한 것은 이 지역이 첨단 바이오 제조 부문에 품고 있는 야망을 여실히 보여줍니다. 한편, 북미와 유럽에서는 식품 및 제약 부문이 이미 자리 잡혀 있어 안정적인 수요가 예상되지만, 시장 포화와 규제 일관성으로 인해 성장률은 완만한 수준에 머물고 있습니다.
유럽은 식품, 음료, 퍼스널케어 부문의 견조한 수요에 더해, 엄격한 품질 기준과 확립된 가공 시설에 힘입어 안정적인 시장으로서의 위상을 유지하고 있습니다. 북미의 성장은 꾸준하며, 즉석 음료, 편의 식품, 의약품의 급증이 성장의 견인차 역할을 하고 있습니다. 이 지역의 소비자들은 클린 라벨 원료를 점점 더 선호하는 경향을 보이며, 구연산을 천연 방부제나 풍미 증진제로 활용하고 있습니다. 남미, 특히 브라질과 아르헨티나 등에서는 식품 가공 부문의 확대와 가공 식품에 대한 수요 증가로 인해 시장이 성장하고 있습니다. 남미의 제조업체들은 구연산 생산을 위한 풍부한 농산물 원료와 수입 의존도 감소라는 두 가지 이점을 누리고 있습니다. 유럽, 북미, 남미 전역에서 천연 첨가물을 우대하는 규제 체계가 구연산 시장의 잠재력을 더욱 높여, 세계 기업과 현지 기업 모두에게 비즈니스 기회를 제공합니다.
기타 혜택
- 엑셀 형식 시장 예측(ME) 시트
- 3개월간의 애널리스트 지원
자주 묻는 질문
목차
제1장 서론
제2장 조사 방법
제3장 주요 요약
제4장 시장 구도
제5장 시장 규모 및 성장 예측
제6장 경쟁 구도
제7장 시장 기회 및 향후 전망
KTH 26.09.04According to Mordor Intelligence, the citric acid market size is expected to grow from USD 3.77 billion in 2025 to USD 3.93 billion in 2026, and reach USD 4.81 billion by 2031, growing at a CAGR of 4.12% from 2026 to 2031.
This report is Segmented by Form (Anhydrous and Liquid), Application (Food and Beverages [Bakery, Confectionery, Dairy, Beverages, Savory and Snacks, and More], Pharmaceuticals, Personal Care and Cosmetics, Detergents and Household Cleaners, and More), and Geography (North America, Europe, Asia-Pacific, South America, Middle East and Africa). Market Forecasts are Provided in Terms of Value (USD) and Volume (Tons).
Global Citric Acid Market Trends and Insights
Clean-label demand surge in processed foods and beverages
Consumer preference for recognizable ingredients has compelled food manufacturers to replace synthetic preservatives with naturally derived alternatives, positioning citric acid as a dual-function acidulant and antimicrobial agent in bakery, confectionery, and dairy applications. FDA recognition under 21 CFR 582.1033 as a direct food substance affirmed as generally recognized as safe (GRAS) eliminates regulatory friction, enabling formulators to declare citric acid on ingredient panels without consumer skepticism. Beverage producers are leveraging citric acid's tartness to mask off-notes in reduced-sugar formulations, a trend accelerating as sugar taxes proliferate across Latin America and Southeast Asia. Bakery applications benefit from citric acid's ability to extend shelf life by lowering pH below 4.6, inhibiting Clostridium botulinum growth without imparting the metallic aftertaste associated with sorbates or benzoates. The clean-label imperative is further amplified by retailer mandates; major European grocery chains now require suppliers to eliminate E-number additives from private-label lines, driving reformulation cycles that favor citric acid over calcium propionate or sodium benzoate.
Phosphate bans boosting citrate use in detergents
Regulatory restrictions on phosphates in household detergents, codified in EU Regulation (EC) 648/2004 and reinforced by amendments limiting phosphorus content to 0.3 grams per standard dose, have catalyzed substitution with citric acid and its sodium salts as builders and chelating agents. Citric acid sequesters calcium and magnesium ions in hard water, preventing scale deposition on fabrics and washing-machine components, while its biodegradability under OECD 301B protocols satisfies environmental criteria that phosphates fail. European consumption of household cleaning products reached approximately 100,000 tonnes in 2025, with Germany, France, and the United Kingdom accounting for the majority of uptake. North American jurisdictions are following suit; several U.S. states have enacted phosphate bans in automatic dishwasher detergents, and Canadian provinces are considering similar measures. The detergent segment's 6.03% CAGR through 2031 reflects not only regulatory push but also formulator recognition that citric acid enables concentrated liquid formats by maintaining stability at lower pH, reducing packaging weight and transport emissions, a dual benefit as brands pursue sustainability claims.
Corn and sugar price volatility
Citric acid production economics hinge on feedstock costs, with molasses, corn-steep liquor, and refined sugar accounting for 40-50% of total manufacturing expenses in fermentation-based processes. Sugar production in the 2023/24 crop year totaled 179.4 million tonnes globally, with Brazil exporting 34 million tonnes, yet prices remain susceptible to weather anomalies. El Nino-induced droughts in Thailand and India curtailed 2024 cane yields, tightening molasses availability and elevating spot prices by 18-22% year-over-year. Corn prices, critical for U.S. and European producers, oscillate with biofuel mandates; the U.S. Renewable Fuel Standard's requirement for 15 billion gallons of corn ethanol annually diverts feedstock, creating competition that spikes during short-crop years. Fertilizer cost collapses, from USD 815 per tonne in April 2022 to USD 327 per tonne in April 2024, providing temporary relief, yet freight-rate volatility linked to container-shipping disruptions (Red Sea diversions, Panama Canal draft restrictions) has inflated import bills for molasses and raw sugar by 12-15% in 2025. Producers lacking vertical integration into sugar refining or corn wet-milling face margin compression when feedstock inflation outpaces their ability to pass costs downstream, particularly in price-sensitive food-grade segments where buyers resist mid-contract adjustments.
Other drivers and restraints analyzed in the detailed report include:
- Expanding pharmaceutical excipient applications
- Growth of bio-based production capacity in Asia
- Margin pressure from Chinese overcapacity and anti-dumping duties
For complete list of drivers and restraints, kindly check the Table Of Contents.
Segment Analysis
In 2025, anhydrous citric acid dominated the market with a 55.62% share, solidifying its role in dry-blend applications sensitive to moisture. Its crystalline stability is crucial for powdered beverage mixes, effervescent tablets, and bakery enhancers, preventing premature reactions with bicarbonates and hygroscopic ingredients. Liquid citric acid, projected to grow at a 5.80% CAGR through 2031, is gaining traction in pharmaceutical and personal-care products, where precise pH control in aqueous systems and ease of handling are prioritized. The pharmaceutical industry's shift to liquid orally disintegrating films and pediatric syrups is driving liquid citric acid adoption, avoiding dust and static-electricity issues in cleanrooms. Food-service operators are also favoring liquid formats for beverage dispensing and dressing preparation, as pre-dissolved citric acid eliminates mixing and reduces labor costs. While anhydrous citric acid benefits from lower production costs due to crystallization and drying, liquid suppliers are closing the gap by co-locating with fermentation plants to reduce water transport costs.
Both forms of citric acid comply with ISO 9001 and HACCP protocols. However, anhydrous citric acid, classified as a non-hazardous solid under UN transport regulations, simplifies logistics compared to liquid citric acid, labeled as corrosive (UN 1760, Class 8), which requires specialized containers and handling. Innovations in spray-drying and fluidized-bed granulation are enabling anhydrous producers to customize particle sizes for specific uses, such as coarse granules (40-100 mesh) for tableting and fine powders (200+ mesh) for beverage clouding. These tailored products command a 10-15% premium over standard anhydrous citric acid. Liquid citric acid suppliers are countering with stabilized formulations, removing chelated trace metals to sub-ppm levels to meet stringent cosmetic and injectable-pharmaceutical standards, where even minor iron or copper contamination can cause discoloration or oxidation.
Complete Report Scope:
- Form
- Anhydrous
- Liquid
- Application
- Food and Beverages
- Bakery
- Confectionery
- Dairy
- Beverages
- Savory and Snacks
- Other Foods and Beverages
- Pharmaceuticals
- Personal Care and Cosmetics
- Detergents and Household Cleaners
- Others
- Food and Beverages
- Geography
- North America
- United States
- Canada
- Mexico
- Rest of North America
- Europe
- United Kingdom
- Germany
- France
- Italy
- Spain
- Sweden
- Belgium
- Poland
- Netherlands
- Rest of Europe
- Asia-Pacific
- China
- Japan
- India
- Thailand
- Singapore
- South Korea
- Australia
- New Zealand
- Rest of Asia Pacific
- South America
- Brazil
- Argentina
- Colombia
- Chile
- Peru
- Rest of South America
- Middle East and Africa
- United Arab Emirates
- Saudi Arabia
- Qatar
- Turkey
- South Africa
- Nigeria
- Egypt
- Morocco
- Rest of Middle East and Africa
- North America
Geography Analysis
In 2025, Asia-Pacific commands a 35.43% market share, largely due to China's robust production capabilities and its surging domestic appetite in food processing and industrial sectors. The region's advantages include a well-established fermentation infrastructure, competitive production costs, and close access to vital raw materials like corn and sugarcane derivatives. Yet, trade tensions and anti-dumping measures are altering the regional landscape. Countries like India, Thailand, and other Southeast Asian nations are ramping up production capacities to cater to both local and export demands. Japan's sophisticated pharmaceutical and food processing sectors present lucrative market prospects, while Australia's burgeoning beverage industry bolsters regional consumption.
The Middle East and Africa are the regions to watch, boasting a 6.56% CAGR through 2031. This growth is largely attributed to the burgeoning food processing sectors and infrastructural investments in nations such as Saudi Arabia and the UAE. Government initiatives in the region, aimed at bolstering food security and diversifying industries, are birthing new demand hubs for citric acid. NEOM's collaboration with Liberation Labs to set up precision fermentation facilities underscores the region's ambition in advanced biomanufacturing. Meanwhile, North America and Europe, with their entrenched food and pharmaceutical sectors, offer stable demand, albeit with tempered growth rates due to market saturation and regulatory consistency.
Europe, with its robust demand from the food, beverage, and personal care sectors, remains a stable player, bolstered by stringent quality standards and established processing facilities. North America's growth is steady, driven by a surge in ready-to-drink beverages, convenience foods, and pharmaceuticals. Consumers here increasingly lean towards clean-label ingredients, using citric acid as a natural preservative and flavor enhancer. South America, particularly in nations like Brazil and Argentina, is on the rise, thanks to its expanding food processing sectors and a growing appetite for packaged foods. South American manufacturers enjoy the dual advantage of abundant agricultural feedstocks for citric acid production and a reduced reliance on imports. Across Europe, North America, and South America, regulatory frameworks that favor natural additives further enhance citric acid's market potential, presenting opportunities for both global giants and local players.
- Archer Daniels Midland Company
- Cargill Incorporated
- Jungbunzlauer Suisse AG
- Weifang Ensign Industry Co. Ltd.
- RZBC Group Co. Ltd.
- Tate & Lyle PLC
- COFCO Biochemical (Anhui) Co. Ltd.
- Gadot Biochemical Industries Ltd.
- Citrique Belge N.V.
- Huangshi Xinghua Biochemical Co. Ltd.
- TTCA Co. Ltd.
- Jiangsu Guoxin Union Energy Co. Ltd.
- Laiwu Taihe Biochemistry Co. Ltd.
- BBCA Group
- Pfizer Inc.
- Kenko Corporation
- Natural Biological Group
- S.A. Citrique Belge N.V.
- Shandong Ensign Industry Co., Ltd.
- Foodchem International Corporation
Additional Benefits:
- The market estimate (ME) sheet in Excel format
- 3 months of analyst support
TABLE OF CONTENTS
1 INTRODUCTION
- 1.1 Study Assumptions and Market Definition
- 1.2 Scope of the Study
2 RESEARCH METHODOLOGY
3 EXECUTIVE SUMMARY
4 MARKET LANDSCAPE
- 4.1 Market Overview
- 4.2 Market Drivers
- 4.2.1 Clean-label demand surge in processed foods and beverages
- 4.2.2 Phosphate bans boosting citrate use in detergents
- 4.2.3 Expanding pharmaceutical excipient applications
- 4.2.4 Growth of bio-based production capacity in Asia
- 4.2.5 Commercialization of Yarrowia lipolytica waste-glycerol routes
- 4.2.6 EU Green Deal incentives for biodegradable chelants
- 4.3 Market Restraints
- 4.3.1 Corn and sugar price volatility
- 4.3.2 Margin pressure from Chinese overcapacity and anti-dumping duties
- 4.3.3 Surge in gypsum-waste disposal compliance costs
- 4.3.4 Substitution threat from emerging multi-acid blends
- 4.4 Supply Chain Analysis
- 4.5 Regulatory Landscape
- 4.6 Technological Outlook
- 4.7 Porter's Five Forces
- 4.7.1 Threat of New Entrants
- 4.7.2 Bargaining Power of Buyers
- 4.7.3 Bargaining Power of Suppliers
- 4.7.4 Threat of Substitutes
- 4.7.5 Intensity of Competitive Rivalry
5 MARKET SIZE AND GROWTH FORECASTS (VALUE AND VOLUME)
- 5.1 Form
- 5.1.1 Anhydrous
- 5.1.2 Liquid
- 5.2 Application
- 5.2.1 Food and Beverages
- 5.2.1.1 Bakery
- 5.2.1.2 Confectionery
- 5.2.1.3 Dairy
- 5.2.1.4 Beverages
- 5.2.1.5 Savory and Snacks
- 5.2.1.6 Other Foods and Beverages
- 5.2.2 Pharmaceuticals
- 5.2.3 Personal Care and Cosmetics
- 5.2.4 Detergents and Household Cleaners
- 5.2.5 Others
- 5.2.1 Food and Beverages
- 5.3 Geography
- 5.3.1 North America
- 5.3.1.1 United States
- 5.3.1.2 Canada
- 5.3.1.3 Mexico
- 5.3.1.4 Rest of North America
- 5.3.2 Europe
- 5.3.2.1 United Kingdom
- 5.3.2.2 Germany
- 5.3.2.3 France
- 5.3.2.4 Italy
- 5.3.2.5 Spain
- 5.3.2.6 Sweden
- 5.3.2.7 Belgium
- 5.3.2.8 Poland
- 5.3.2.9 Netherlands
- 5.3.2.10 Rest of Europe
- 5.3.3 Asia-Pacific
- 5.3.3.1 China
- 5.3.3.2 Japan
- 5.3.3.3 India
- 5.3.3.4 Thailand
- 5.3.3.5 Singapore
- 5.3.3.6 South Korea
- 5.3.3.7 Australia
- 5.3.3.8 New Zealand
- 5.3.3.9 Rest of Asia Pacific
- 5.3.4 South America
- 5.3.4.1 Brazil
- 5.3.4.2 Argentina
- 5.3.4.3 Colombia
- 5.3.4.4 Chile
- 5.3.4.5 Peru
- 5.3.4.6 Rest of South America
- 5.3.5 Middle East and Africa
- 5.3.5.1 United Arab Emirates
- 5.3.5.2 Saudi Arabia
- 5.3.5.3 Qatar
- 5.3.5.4 Turkey
- 5.3.5.5 South Africa
- 5.3.5.6 Nigeria
- 5.3.5.7 Egypt
- 5.3.5.8 Morocco
- 5.3.5.9 Rest of Middle East and Africa
- 5.3.1 North America
6 COMPETITIVE LANDSCAPE
- 6.1 Market Concentration
- 6.2 Strategic Moves
- 6.3 Market Ranking Analysis
- 6.4 Company Profiles
- 6.4.1 Archer Daniels Midland Company
- 6.4.2 Cargill Incorporated
- 6.4.3 Jungbunzlauer Suisse AG
- 6.4.4 Weifang Ensign Industry Co. Ltd.
- 6.4.5 RZBC Group Co. Ltd.
- 6.4.6 Tate & Lyle PLC
- 6.4.7 COFCO Biochemical (Anhui) Co. Ltd.
- 6.4.8 Gadot Biochemical Industries Ltd.
- 6.4.9 Citrique Belge N.V.
- 6.4.10 Huangshi Xinghua Biochemical Co. Ltd.
- 6.4.11 TTCA Co. Ltd.
- 6.4.12 Jiangsu Guoxin Union Energy Co. Ltd.
- 6.4.13 Laiwu Taihe Biochemistry Co. Ltd.
- 6.4.14 BBCA Group
- 6.4.15 Pfizer Inc.
- 6.4.16 Kenko Corporation
- 6.4.17 Natural Biological Group
- 6.4.18 S.A. Citrique Belge N.V.
- 6.4.19 Shandong Ensign Industry Co., Ltd.
- 6.4.20 Foodchem International Corporation