

|
시장보고서
상품코드
2120567
게이미피케이션 : 시장 점유율 분석, 업계 동향 및 통계, 성장 예측(2026-2031년)Gamification - Market Share Analysis, Industry Trends & Statistics, Growth Forecasts (2026 - 2031) |
||||||
 Mordor Intelligence
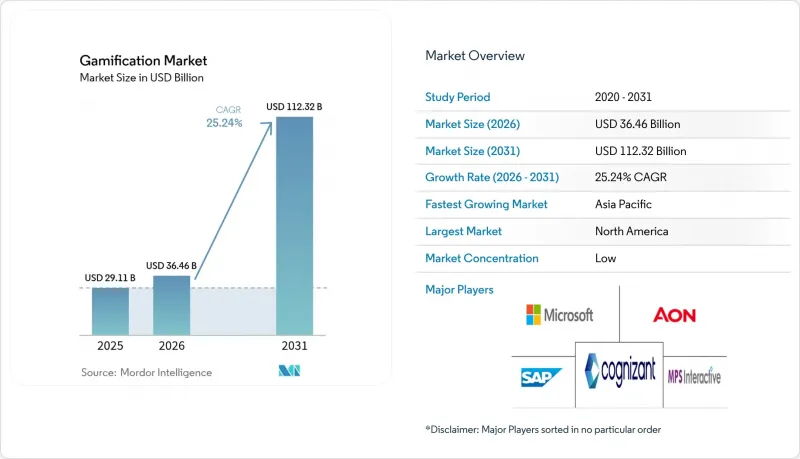
Mordor Intelligence에 의하면, 게이미피케이션 시장 규모는 2025년에 291억 1,000만 달러로 평가되었습니다. 2026년 364억 6,000만 달러에서 2031년까지 1,123억 2,000만 달러에 이를 것으로 예상되며, 예측 기간(2026-2031년) CAGR은 25.24%를 나타낼 전망입니다.
본 보고서는 배포 방식별(On-Premise, 클라우드), 조직 규모별(대기업, 중소기업(SME)), 산업 부문별(소매, 은행, 금융서비스 및 보험(BFSI), 정부, 헬스케어, 기타),용도별(마케팅 및 판매, 인사·교육, 제품 개발·혁신, 고객 지원·고객 경험, 기타), 지역별로 분류되어 있습니다. 시장 예측은 금액(미화)으로 제시되어 있습니다.
세계의 게이미피케이션 시장 동향 및 인사이트
‘클라우드 퍼스트’형 디지털 워크플레이스 도입의 급증
클라우드 전환을 가속화하는 기업들은 하이브리드 팀 전체에서 원활하게 작동하는 참여 유도 도구를 필요로 하고 있습니다. Microsoft Power Apps는 게임 메커니즘을 워크플로에 직접 통합함으로써 도입 기간을 수개월에서 수주일로 단축합니다. 클라우드 호스팅형 플랫폼은 데이터 스트림을 통합하고 모든 기기에 실시간 리더보드를 제공하므로 27.58%의 연평균 성장률(CAGR)이 예상됩니다. 기존 클라우드 인프라에 게이미피케이션를 통합한 조직에서는 원격 근무 환경에서 최대 90%의 생산성 향상이 보고되고 있습니다. 구독형 라이선싱의 비용적 이점이 도입을 더욱 가속화하고 있습니다. IT 부서가 On-Premise 자산을 합리화하는 가운데, 클라우드 네이티브 벤더들은 예측 기간 동안 역전될 가능성이 낮은 구조적 우위를 확보하고 있습니다.
로우코드형 게이미피케이션 플랫폼의 보급
드래그 앤 드롭 방식의 개발을 통해 누구나 참여형 경험을 설계할 수 있게 되었습니다. SAP Build를 활용하면 시민 개발자는 코드를 작성하지 않고도 핵심 비즈니스 프로세스에 과제, 배지, 보상을 통합할 수 있으며, 맞춤형 프로젝트에 비해 개발 비용을 70% 절감할 수 있습니다. 이러한 접근 용이성 덕분에 대상 시장은 대기업에 그치지 않고 기술 자원이 부족했던 중소기업까지 확대되고 있습니다. 각 플랫폼 벤더들은 영업 경진대회나 온보딩 미션에 특화된 템플릿이 급증하고 있다고 보고하고 있으며, 이는 비즈니스 현장에서의 주류화를 시사합니다. 또한, 로우코드 스택은 SaaS 생태계에 직접 연결되므로, 중소기업에게 중요한 조달 장벽인 ‘가치 입증(PoV)’ 주기를 단축하는 것도 가능합니다. 맞춤형 개발의 구조적 감소는 이 부문에서 중소기업용 시장의 연평균 성장률(CAGR) 28.67%와 일치합니다.
부실한 설계로 인한 ROI 저하
표면적인 ‘포인트 획득·배지 부여’형 도입은 직원 이탈이나 예산 낭비를 초래할 위험이 있습니다. Versus Systems의 고객 수는 부진한 도입으로 인해 사용자의 관심을 유지하지 못해 2023년에 16개사에서 5개사로 감소했습니다. 이는 표면적인 도입에 대한 반발을 여실히 보여줍니다. 기업들은 현재 신규 프로젝트를 승인하기 전에 매출 증대나 오류율 감소와 같은 비즈니스 성과 지표를 요구하고 있습니다. 이러한 엄격한 심사로 인해 판매 주기가 장기화되면서, 벤더들은 더욱 강력한 컨설팅 지원을 제공할 수밖에 없는 상황에 처해 있습니다. 또한, 조기 도입 부문에서의 실패 사례는 후발 기업들에게도 경계심을 불러일으켜 단기적인 지출을 억제하고 있습니다. 교육 설계나 행동 과학을 소홀히 하는 벤더는 평판이 실추될 위험이 있으며, 그 영향은 게이미피케이션 시장 전체로 파급될 가능성이 있습니다.
부문별 분석
클라우드 솔루션은 2025년 매출의 67.62%를 차지했으며, 2031년 연평균 성장률(CAGR)이 26.91%라는 점을 고려할 때, 게이미피케이션 시장 규모에서 차지하는 점유율은 더욱 상승할 것으로 예측됩니다. 실시간 텔레메트리, 원활한 업데이트, 탄력적인 스토리지가 이러한 선호의 기반이 되고 있는 반면, 보안 인증의 성숙화는 보수적인 산업 분야에서도 도입을 촉진하고 있습니다. 데이터 주권이 최우선으로 고려되는 상황에서는 On-Premise 패키지에 대한 수요가 여전히 존재하지만, IT 예산 축소와 사이버 보험료 인상으로 인해 비용 대비 효과의 균형은 매니지드 호스팅 쪽으로 기울고 있습니다.
지속적 배포(CD) 파이프라인을 통해 실현되는 신속한 반복 주기로 인해, 클라우드 벤더는 클라이언트 측에 패치를 적용하지 않고도 달성 알고리즘을 미세 조정하거나 내러티브에 대한 A/B 테스트를 수행할 수 있게 됩니다. 고급 분석 기능을 통해 개인화된 과제가 실시간으로 추천될 경우, 기업들은 37%의 생산성 향상을 보고하고 있습니다. 하이브리드 배포는 과도기적인 대안으로 기능하며, 기밀 데이터를 On-Premise에 보관하면서 참여 로직을 클라우드에 배치할 수 있게 해줍니다. 예측 기간 동안 퍼블릭 클라우드 스택으로의 전환을 통해 통합 패턴이 표준화되고, 총 소유 비용(TCO)이 절감되며 벤더 수가 통합될 것으로 예측됩니다.
대기업은 2025년 매출의 57.02%를 차지했으며, 이는 풍부한 예산과 복잡한 통합 요구 사항을 반영합니다. 대조적으로, 중소기업은 게이미피케이션 시장에서 가장 빠르게 성장하는 부문으로, 연평균 성장률(CAGR) 27.65%로 확대되고 있습니다. 프리미엄 가격 정책, 템플릿 라이브러리, ‘성장에 따른 과금’ 아키텍처 덕분에 중소기업의 진입 장벽이 낮아지고 있습니다.
중소기업은 일반적으로 영업팀의 동기 부여 향상이나 계절별 고용 직원의 온보딩 등 특정 과제에 초점을 맞추고 있으며, 이를 통해 몇 주 이내에 ROI를 입증할 수 있습니다. 싱가포르와 같은 시장의 정부 디지털화 보조금은 구독 요금을 보전함으로써 도입을 더욱 촉진하고 있습니다. 클라우드 플랫폼이 대중 시장 수준의 가격대로 엔터프라이즈급 ID 관리를 제공함에 따라, 기능 면에서의 격차는 점차 줄어들고 있습니다. 그 결과, 중견 기업의 구매자들은 SOC 2 준수 및 싱글 사인온(SSO)을 점점 더 강력하게 요구하게 되었으며, 벤더들은 가격 탄력성을 유지하면서도 보안 로드맵을 강화할 수밖에 없게 되었습니다.
지역별 분석
북미는 SaaS의 조기 도입과 탄탄한 벤더 생태계의 혜택을 받아 2025년 매출의 38.74%를 차지했습니다. 기업들은 HRIS 및 CRM 제품군과의 통합을 우선시하고 있으며, 이는 기능의 신속한 배포로 이어져 시장 점유율 확대를 주도하고 있습니다. 연방 정부의 접근성 관련 소송 위험을 배경으로, 각 플랫폼은 WCAG 준수 디자인에 대한 투자를 추진하고 있어 모든 공급업체에 대한 품질 기준이 높아지고 있습니다.
아시아태평양은 모바일 우선 업무 방식과 정부 주도의 디지털 기술 향상 프로그램의 뒷받침을 받아 28.6%라는 지역별 최고 연평균 성장률(CAGR)을 기록하고 있습니다. 싱가포르 공공 서비스 분야의 게이미피케이션(게이미피케이션) 노력은 그 효과를 입증하며 민간 부문에서의 도입을 촉진하고 있습니다. 태국의 디지털 지갑 제도에서는 게이미피케이션를 도입한 중앙은행 디지털 통화(CBDC) 인센티브가 시범적으로 도입되어, 정책 차원의 지지를 시사하고 있습니다. 각 기업은 저지연 5G 네트워크에 최적화된 경량 용도를 제공함으로써 수익을 창출하고, 인도나 인도네시아와 같은 인구 밀집 시장에서 보급을 가속화하고 있습니다.
유럽에서는 엄격한 개인정보 보호 규제가 있음에도 불구하고 수요가 견조하게 유지되고 있습니다. GDPR(EU 개인정보보호규정) 의무로 인해 보상 데이터를 익명화하는 차등 개인정보 보호 분석의 혁신이 촉진되고 있습니다. 사내에 법무 팀을 보유한 벤더는 MiFID-II 적용 대상 금융 기관을 위해 동의 절차를 맞춤화할 때 우위를 점하고 있습니다. 남미, 중동 및 아프리카는 절대 금액 면에서는 뒤처지고 있지만, 스마트폰 보급률 향상이라는 혜택을 누리고 있으며, 클라우드 호스팅 방식의 모바일 네이티브 솔루션이 기본적인 선택지로 자리 잡고 있습니다. 언어적·문화적 측면의 현지화는 이러한 신흥 지역의 전환율에 있어 여전히 결정적인 요인으로 작용하고 있습니다.
기타 혜택
- 엑셀 형식 시장 예측(ME) 시트
- 3개월간의 애널리스트 지원
자주 묻는 질문
목차
제1장 서론
제2장 조사 방법
제3장 주요 요약
제4장 시장 인사이트
제5장 시장 규모 및 성장 예측
제6장 경쟁 구도
제7장 시장 기회 및 향후 전망
KTH 26.09.04According to Mordor Intelligence, the gamification market size was valued at USD 29.11 billion in 2025 and estimated to grow from USD 36.46 billion in 2026 to reach USD 112.32 billion by 2031, at a CAGR of 25.24% during the forecast period (2026-2031).
This report is Segmented by Deployment (On-Premise, and Cloud), Organization Size (Small and Medium Enterprises, and Large Enterprises), Industry Vertical (Retail, BFSI, Government, Healthcare, and More), Application (Marketing and Sales, HR and Training, Product Development and Innovation, Customer Support and Experience, and Others), and Geography. The Market Forecasts are Provided in Terms of Value (USD).
Global Gamification Market Trends and Insights
Surge in Cloud-First Digital-Workplace Roll-Outs
Enterprises accelerating cloud migration need engagement tools that function natively across hybrid teams. Microsoft Power Apps embeds game mechanics directly into workflows, cutting rollout times from months to weeks . Cloud-hosted platforms generate the 27.58% CAGR forecast because they consolidate data streams and push real-time leaderboards to any device. Organizations integrating gamification with existing cloud infrastructure report up to 90% productivity improvement in remote work settings. The cost advantages of subscription licensing further accelerate adoption. As IT departments rationalize on-premise assets, cloud-native vendors gain a structural advantage that is unlikely to reverse over the outlook period.
Proliferation of Low-Code Gamification Platforms
Drag-and-drop development is democratizing the design of engagement experiences. SAP Build allows citizen developers to insert challenges, badges, and rewards into core business processes without writing code, trimming development spend by 70% against bespoke projects. The accessibility expands the total addressable base beyond large enterprises to SMEs that lacked technical resources. Platform vendors report a surge in templates focused on sales contests and onboarding missions, indicating mainstream business adoption. Because low-code stacks connect directly to SaaS ecosystems, they also shorten proof-of-value cycles, a key procurement hurdle for smaller firms. The structural decline in custom development aligns with the segment's 28.67% SME CAGR.
Poorly-Designed Programs Deliver Negative ROI
Superficial point-and-badge deployments risk disengagement and budget waste. Versus Systems' client roster fell from 16 to 5 in 2023 after lackluster implementations failed to sustain user interest, exemplifying backlash against gimmicky rollouts. Enterprises now demand business-outcome metrics, such as sales lift or error-rate reduction, before green-lighting new projects. This scrutiny lengthens sales cycles and forces vendors to provide stronger consultative support. Implementation missteps in early-adopter sectors also create caution among laggards, dampening near-term spend. Vendors that neglect instructional design and behavioral science risk reputational damage that can reverberate across the wider gamification market.
Other drivers and restraints analyzed in the detailed report include:
- Retail Loyalty Wars Escalating Points and Badges Adoption
- Smartphone-Centric Micro-Learning for Frontline Workforces
- Antigaming Clauses in Sector-Specific Compliance (HIPAA, MiFID-II)
For complete list of drivers and restraints, kindly check the Table Of Contents.
Segment Analysis
Cloud solutions accounted for 67.62% of 2025 revenue, and their share of the gamification market size is projected to climb further, given a 26.91% CAGR to 2031. Real-time telemetry, seamless updates, and elastic storage underpin the preference, while maturing security certifications sway even conservative sectors. On-premise packages remain relevant where data sovereignty is paramount, yet shrinking IT budgets and rising cyber-insurance premiums tilt cost-benefit equations toward managed hosting.
Rapid iteration cycles, achieved through continuous delivery pipelines, let cloud vendors fine-tune achievement algorithms and A/B-test narratives without client-side patches. Enterprises report 37% productivity gains when advanced analytics recommend personalized challenges in real time. Hybrid rollouts serve as a transitional choice, allowing sensitive data to stay on site while engagement logic resides in the cloud. Over the forecast, migration to public-cloud stacks is expected to standardize integration patterns, reducing total cost of ownership and consolidating vendor footprints.
Large enterprises contributed 57.02% to 2025 revenue, reflecting deep budgets and complex integration needs. In contrast, SMEs represent the fastest-growing slice of the gamification market, expanding at 27.65% CAGR. Freemium pricing, template libraries, and pay-as-you-grow architectures lower entry barriers for smaller firms.
SMEs typically target narrow pain points-motivating a sales pod or onboarding seasonal staff-allowing them to demonstrate ROI within weeks. Government digitalization grants in markets such as Singapore further stimulate uptake by offsetting subscription fees. Feature parity is narrowing because cloud platforms offer enterprise-grade identity management at mass-market price tiers. As a result, mid-market buyers increasingly insist on SOC 2 compliance and single-sign-on, forcing vendors to harden security roadmaps while keeping price elasticity.
Complete Report Scope:
- By Deployment
- On-Premise
- Cloud
- By Organization Size
- Large Enterprises
- Small and Medium Enterprises (SMEs)
- By Industry Vertical
- Retail
- BFSI
- Government
- Healthcare
- Education and Research
- IT and Telecom
- Others
- By Application
- Marketing and Sales
- HR and Training
- Product Development and Innovation
- Customer Support and Experience
- Others
- By Geography
- North America
- United States
- Canada
- Mexico
- South America
- Brazil
- Argentina
- Colombia
- Rest of South America
- Europe
- Germany
- United Kingdom
- France
- Italy
- Spain
- Russia
- Netherlands
- Rest of Europe
- Asia-Pacific
- China
- Japan
- South Korea
- India
- Australia
- Singapore
- Rest of Asia-Pacific
- Middle East and Africa
- Middle East
- Saudi Arabia
- United Arab Emirates
- Rest of Middle East
- Africa
- South Africa
- Egypt
- Rest of Africa
- Middle East
- North America
Geography Analysis
North America generated 38.74% of 2025 revenue, benefitting from early SaaS adoption and a deep vendor ecosystem. Corporations prioritize integrations with HRIS and CRM suites, leading to rapid feature rollouts that drive wallet share. Federal accessibility litigation risk motivates platforms to invest in WCAG-compliant design, raising quality thresholds for all suppliers.
Asia-Pacific records the highest regional CAGR at 28.6%, powered by mobile-first working patterns and government-sponsored digital-skills programs. Singapore's public-service gamification initiatives validate efficacy and encourage private-sector replication. Thailand's digital-wallet scheme experiments with gamified Central Bank Digital Currency incentives, signaling policy-level endorsement. Companies capitalize by shipping lightweight applications optimized for low-latency 5G networks, accelerating uptake in populous markets such as India and Indonesia.
Europe shows steady demand despite stringent privacy rules. GDPR obligations spur innovation in differential-privacy analytics that anonymize reward data. Vendors with in-house legal teams gain an edge when customizing consent flows for financial institutions subject to MiFID-II. South America and the Middle East and Africa trail in absolute dollars but benefit from growing smartphone penetration, making cloud-hosted, mobile-native solutions the default choice. Localization-both linguistic and cultural-remains a decisive factor in conversion rates across these emerging territories.
- Microsoft Corporation
- SAP SE
- Cognizant Technology Solutions Corp.
- Axonify Inc.
- Aon plc (incl. Aon Assessment)
- Bunchball Inc.
- Salesforce Inc. (incl. Trailhead)
- Cisco Systems Inc.
- LevelEleven LLC
- Badgeville Inc.
- Genesys Cloud Services Inc.
- Callidus Software Inc. (SAP Litmos)
- Ambition Solutions Inc.
- MPS Interactive Systems Ltd.
- IACTIONABLE Inc.
- G-Cube Solutions
- Gamifier Inc.
- BI Worldwide
- Kahoot! ASA
- Classcraft Studios Inc.
Additional Benefits:
- The market estimate (ME) sheet in Excel format
- 3 months of analyst support
TABLE OF CONTENTS
1 INTRODUCTION
- 1.1 Study Assumptions and Market Definition
- 1.2 Scope of the Study
2 RESEARCH METHODOLOGY
3 EXECUTIVE SUMMARY
4 MARKET INSIGHTS
- 4.1 Market Overview
- 4.2 Market Drivers
- 4.2.1 Surge in cloud-first digital-workplace roll-outs
- 4.2.2 Proliferation of low-code gamification platforms
- 4.2.3 Retail loyalty wars escalating points and badges adoption
- 4.2.4 Smartphone-centric micro-learning for frontline workforces
- 4.2.5 Privacy-preserving engagement analytics
- 4.2.6 Gamified CBDC pilots by central banks
- 4.3 Market Restraints
- 4.3.1 Poorly-designed programs deliver negative ROI
- 4.3.2 Inter-platform data-ownership disputes
- 4.3.3 Antigaming clauses in sector-specific compliance (HIPAA, MiFID-II)
- 4.3.4 Accessibility lawsuits on non-inclusive game mechanics
- 4.4 Value Chain Analysis
- 4.5 Regulatory Landscape
- 4.6 Technological Outlook
- 4.7 Porter's Five Forces Analysis
- 4.7.1 Bargaining Power of Suppliers
- 4.7.2 Bargaining Power of Buyers
- 4.7.3 Threat of New Entrants
- 4.7.4 Threat of Substitutes
- 4.7.5 Competitive Rivalry
- 4.8 Industry Ecosystem Analysis
- 4.9 Key Use Cases and Case Studies
- 4.10 Assessment of Macroeconomic Trends
- 4.11 Investment Analysis
5 MARKET SIZE AND GROWTH FORECASTS (VALUE)
- 5.1 By Deployment
- 5.1.1 On-Premise
- 5.1.2 Cloud
- 5.2 By Organization Size
- 5.2.1 Large Enterprises
- 5.2.2 Small and Medium Enterprises (SMEs)
- 5.3 By Industry Vertical
- 5.3.1 Retail
- 5.3.2 BFSI
- 5.3.3 Government
- 5.3.4 Healthcare
- 5.3.5 Education and Research
- 5.3.6 IT and Telecom
- 5.3.7 Others
- 5.4 By Application
- 5.4.1 Marketing and Sales
- 5.4.2 HR and Training
- 5.4.3 Product Development and Innovation
- 5.4.4 Customer Support and Experience
- 5.4.5 Others
- 5.5 By Geography
- 5.5.1 North America
- 5.5.1.1 United States
- 5.5.1.2 Canada
- 5.5.1.3 Mexico
- 5.5.2 South America
- 5.5.2.1 Brazil
- 5.5.2.2 Argentina
- 5.5.2.3 Colombia
- 5.5.2.4 Rest of South America
- 5.5.3 Europe
- 5.5.3.1 Germany
- 5.5.3.2 United Kingdom
- 5.5.3.3 France
- 5.5.3.4 Italy
- 5.5.3.5 Spain
- 5.5.3.6 Russia
- 5.5.3.7 Netherlands
- 5.5.3.8 Rest of Europe
- 5.5.4 Asia-Pacific
- 5.5.4.1 China
- 5.5.4.2 Japan
- 5.5.4.3 South Korea
- 5.5.4.4 India
- 5.5.4.5 Australia
- 5.5.4.6 Singapore
- 5.5.4.7 Rest of Asia-Pacific
- 5.5.5 Middle East and Africa
- 5.5.5.1 Middle East
- 5.5.5.1.1 Saudi Arabia
- 5.5.5.1.2 United Arab Emirates
- 5.5.5.1.3 Rest of Middle East
- 5.5.5.2 Africa
- 5.5.5.2.1 South Africa
- 5.5.5.2.2 Egypt
- 5.5.5.2.3 Rest of Africa
- 5.5.5.1 Middle East
- 5.5.1 North America
6 COMPETITIVE LANDSCAPE
- 6.1 Market Concentration
- 6.2 Strategic Moves
- 6.3 Market Share Analysis
- 6.4 Company Profiles (includes Global level Overview, Market level overview, Core Segments, Financials as available, Strategic Information, Market Rank/Share for key companies, Products and Services, and Recent Developments)
- 6.4.1 Microsoft Corporation
- 6.4.2 SAP SE
- 6.4.3 Cognizant Technology Solutions Corp.
- 6.4.4 Axonify Inc.
- 6.4.5 Aon plc (incl. Aon Assessment)
- 6.4.6 Bunchball Inc.
- 6.4.7 Salesforce Inc. (incl. Trailhead)
- 6.4.8 Cisco Systems Inc.
- 6.4.9 LevelEleven LLC
- 6.4.10 Badgeville Inc.
- 6.4.11 Genesys Cloud Services Inc.
- 6.4.12 Callidus Software Inc. (SAP Litmos)
- 6.4.13 Ambition Solutions Inc.
- 6.4.14 MPS Interactive Systems Ltd.
- 6.4.15 IACTIONABLE Inc.
- 6.4.16 G-Cube Solutions
- 6.4.17 Gamifier Inc.
- 6.4.18 BI Worldwide
- 6.4.19 Kahoot! ASA
- 6.4.20 Classcraft Studios Inc.
7 MARKET OPPORTUNITIES AND FUTURE OUTLOOK
- 7.1 White-space and Unmet-Need Assessment


