

|
시장보고서
상품코드
2120685
안전 계장 시스템 : 시장 점유율 분석, 업계 동향과 통계, 성장 예측(2026-2031년)Safety Instrumented System - Market Share Analysis, Industry Trends & Statistics, Growth Forecasts (2026 - 2031) |
||||||
 Mordor Intelligence
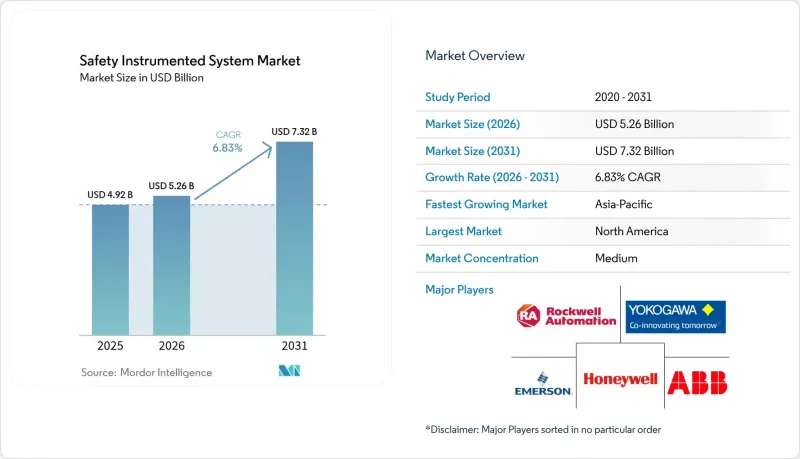
Mordor Intelligence에 의하면, 안전 계장 시스템(SIS) 시장 규모는 2025년에 49억 2,000만 달러로 평가되었고, 2026년 52억 6,000만 달러에서 2031년까지 73억 2,000만 달러에 이를 것으로 예측되며, 예측 기간(2026년-2031년) CAGR은 6.83%를 기록할 전망입니다.
본 보고서는 구성 요소(안전 센서, 로직 솔버/안전 PLC 등), 용도(비상 정지 시스템, 화재·가스 감시 등), 최종 사용자 산업(석유 및 가스, 화학제품 및 석유화학제품 등), 서비스(엔지니어링·컨설팅, 통합·설치 등) 및 지역별로 분류되어 있습니다. 시장 전망은 금액(달러) 기준으로 제시되어 있습니다.
전 세계 안전 계장 시스템(SIS) 시장 동향 및 인사이트
전 세계 기능 안전 규제의 강화가 체계적인 규정 준수를 촉진
IEC 61511 및 OSHA 공정 안전 관리의 전 세계적 시행에 따라, 시설이 정기 감사에서 지속적인 성능 검증으로 전환됨에 따라 안전 계장 시스템 시장은 확대되고 있습니다. 기능 안전 평가는 2024년 이후 40% 증가하여, 이로 인해 엔지니어링 리소스에 대한 부담이 커지고 프로젝트 리드타임이 길어지고 있습니다. 레거시 플랫폼을 운영하는 사업자들은 필수적인 개조를 앞두고 있으며, 자원을 투입하여 18-24개월 이내에 턴키 방식의 업그레이드를 제공할 수 있는 인증된 통합업체에게는 판매자 우위 시장이 형성되고 있습니다. 또한, 수요 증가는 TUV 인증 부품의 높은 가격 책정을 뒷받침하며, 수익 성장의 모멘텀을 더욱 강화하고 있습니다.
노후화된 인프라가 현대 기준에 부합함에 따라 브라운필드 개조가 가속화
오래된 정유시설나 화학 단지가 새로운 플랜트를 건설하는 대신 통합 안전 아키텍처로 개조할 경우, 안전 계장 시스템(SIS) 시장이 그 혜택을 누리게 됩니다. 브라운필드 개조는 이미 전체 프로젝트의 65%를 차지하고 있으며, 보험사가 보상 범위를 현행 기준 준수와 연계하고 있기 때문에 걸프 코스트 지역의 시설들이 이러한 움직임을 주도하고 있습니다. 통합 엔지니어는 레거시 프로토콜과 최신 안전 PLC를 연동하여 사고 위험을 줄이고 가동 중단 시간을 단축함으로써, 개조 투자 회수 기간을 4년 미만으로 단축하는 경우가 많습니다.
높은 자본 비용과 수명 주기 비용이 중견 기업의 도입에 걸림돌이 되고 있습니다.
시설 전체의 도입 비용은 500만 달러에서 1,500만 달러에 달하며, 이는 중규모 사업자에게 큰 장벽이 되고 있습니다. 연간 유지비는 초기 비용의 15-20%를 차지하며, 성능 테스트, 부품 교체, 소프트웨어 패치 적용 등이 포함됩니다. 신흥 시장의 자금 부족은 규정 준수 압박이 높아지고 있음에도 불구하고 업데이트 계획을 저해하고 있습니다. ‘Safety-as-a-Service(SaaS)’형 구독 방식을 통해 자본을 수년에 걸친 운영 예산으로 분산할 수 있게 되었지만, 특히 현지 금융 기관이 높은 리스크 프리미엄을 부과하는 경우 자금 조달 옵션은 여전히 제한적입니다.
부문 분석
소프트웨어 및 서비스 분야는 클라우드 분석, 머신러닝, 가상 시운전 도구가 새로운 가치 창출의 원천이 됨에 따라 7.11%라는 가장 높은 연평균 성장률(CAGR)을 기록했습니다. 안전 계장 시스템(SIS) 시장의 소프트웨어 및 서비스 시장 규모는 2025년 12억 7,000만 달러에서 2031년까지 19억 1,000만 달러로 확대될 것으로 예측됩니다. AI 기반 플랫폼은 실제 공정 이상과 노이즈를 구분하여 오작동을 50% 줄임으로써 생산성을 유지합니다. 센서는 매출액 기준 38.10%의 선두를 유지하고 있지만, 시장은 하드웨어를 실행 가능한 인사이트력으로 보완하는 데이터 중심 솔루션으로 전환되고 있습니다.
로직 솔버와 안전 PLC는 고압·고속 용도에 대한 수요 증가에 힘입어 꾸준한 성장을 이루고 있습니다. 파이널 엘리먼츠는 지속적인 피드백을 제공하는 스마트 액추에이터를 활용하여 검증 테스트의 포괄성을 강화하고 있습니다. 각 벤더는 센서와 구독형 분석 서비스를 번들로 제공함으로써 수익을 지속적 과금 모델로 전환하고, 기존 고객의 유지율을 높이고 있습니다.
2025년에도 비상 차단 시스템은 41.30%의 점유율을 유지할 것으로 보이며, HIPPS는 7.23%라는 가장 높은 연평균 성장률(CAGR)을 기록하고 있습니다. 수소 파이프라인 및 블루 암모니아 수출 터미널에서는 1,000바의 압력 하에서 2초 이내에 차단이 가능한 HIPPS가 요구되고 있습니다. 각국 정부가 사상 최고 수준의 수소 관련 인센티브를 배정하는 가운데, HIPPS와 관련된 안전 계장 시스템(SIS) 시장 규모는 2030년까지 거의 두 배로 증가할 것으로 예측됩니다. 배출 규제가 강화됨에 따라 화재 및 가스 감시가 가속화되고 있으며, 오경보를 줄이는 다중 스펙트럼 감지기가 도입되고 있습니다. 버너 관리 시스템과 터보 기계 제어는 플랜트 전체의 안전 계층과 통합되어 연쇄적인 고장을 방지하기 위한 협력적인 가동 중단을 가능하게 하고 있습니다.
지역별 분석
북미는 OSHA(미국 직업안전보건청)의 공정 안전 관리 강화 및 멕시코만 연안 지역의 브라운필드 프로그램을 배경으로, 2025년 매출의 39.24%를 차지했습니다. 미국에서만 매년 3,000명 이상의 신규 인증 기능 안전 엔지니어가 배출되고 있어, 견실한 프로젝트 파이프라인을 유지하고 있습니다. 사업자들은 분석 기능 업그레이드에 주력하고 있으며, 경영진을 위해 안전 지표를 시각화하는 클라우드 대시보드를 통합하고 있습니다. 캐나다의 업스트림 LNG 터미널에서는 고압 파이프라인을 보호하기 위해 SIL 3 준수 HIPPS에 대한 투자가 진행되고 있습니다.
유럽은 SEVESO III 및 기능 안전에 사이버 보안을 통합하는 ‘디지털 주권’ 추진을 통해 큰 비중을 차지하고 있습니다. 독일과 네덜란드의 정유업체들은 턴어라운드를 최적화하기 위해 예측형 내압 시험을 도입하고 있습니다. 북해의 해양 플랫폼에서는 육상 제어 센터에서 모니터링되는 공통 자산 안전 시스템을 사후 도입하여 현장의 작업 인력 요건을 줄이고 있습니다.
아시아태평양은 연평균 성장률(CAGR) 8.13%로 가장 빠르게 성장하고 있는 지역입니다. 중국과 인도에서는 기존의 장벽을 극복하고, 가동 첫날부터 통합된 안전 대책을 갖춘 대규모 화학 산업 단지가 가동을 시작하고 있습니다. 정부의 수소 로드맵에 따라 HIPPS에 대한 투자가 가속화되는 한편, 동남아시아의 석유화학 허브에서는 초기 투자를 억제하기 위해 모듈식 ‘Safety-as-a-Service’가 채택되고 있습니다. 호주의 광업 부문에서는 AI 기반 진단 시스템을 도입하여 극한의 가동 시간 요구와 근로자 안전 확보 요건 간의 균형을 맞추고 있습니다.
중동 및 아프리카에서는 석유 수입을 첨단 사양의 정유시설 건설에 투자하고 있으며, 많은 경우 엔지니어링 패키지의 일부로 인증된 안전 대책을 포함하는 국제적인 라이선스 제공업체와 제휴하고 있습니다. 남미에서는 사업자들이 더욱 엄격해진 환경 기준과 보험사의 기대에 부응하기 위해 노력하는 가운데, 광업 및 바이오연료 분야의 활동이 활발해지고 있습니다.
기타 혜택:
- 엑셀 형식 시장 예측(ME) 시트
- 3개월간의 애널리스트 지원
자주 묻는 질문
목차
제1장 서론
제2장 조사 방법
제3장 주요 요약
제4장 시장 구도
제5장 시장 규모와 성장 예측
제6장 경쟁 구도
제7장 시장 기회와 향후 전망
LSH 26.09.08According to Mordor Intelligence, the safety instrumented system market size was valued at USD 4.92 billion in 2025 and estimated to grow from USD 5.26 billion in 2026 to reach USD 7.32 billion by 2031, at a CAGR of 6.83% during the forecast period (2026-2031).
This report is Segmented by Component (Safety Sensors, Logic Solvers/Safety PLCs, and More), Application (Emergency Shutdown Systems, Fire and Gas Monitoring, and More), End-User Industry (Oil and Gas, Chemicals and Petrochemicals, and More), Service (Engineering and Consulting, Integration and Installation, and More), and Geography. The Market Forecasts are Provided in Terms of Value (USD).
Global Safety Instrumented System Market Trends and Insights
Stricter Global Functional-Safety Regulations Drive Systematic Compliance
Global enforcement of IEC 61511 and OSHA Process Safety Management elevates the Safety Instrumented System market as facilities migrate from periodic audits to continuous performance verification. Functional-safety assessments grew 40% since 2024, stretching engineering resources and elongating project lead times. Operators with legacy platforms face mandatory overhauls, creating a seller's market for certified integrators able to commit resources and deliver turnkey upgrades within eighteen to twenty-four months. High demand also supports premium pricing for TUV-certified components, reinforcing revenue growth momentum.
Brownfield Upgrades Accelerate as Aging Infrastructure Meets Modern Standards
The Safety Instrumented System market benefits when older refineries and chemical complexes retrofit integrated safety architectures instead of constructing new plants. Brownfield retrofits already represent 65% of projects; Gulf Coast facilities spearhead activity as insurance underwriters tie coverage to conformance with current standards. Integration engineers bridge legacy protocols with contemporary Safety PLCs, often shrinking retrofit payback to less than four years by combining incident-risk mitigation with downtime reduction.
High Capital and Lifecycle Costs Challenge Mid-Tier Adoption
Full-facility deployments range from USD 5 million to USD 15 million, a hurdle for mid-size operators. Annual upkeep absorbs 15-20% of initial cost, covering proof-testing, component swaps, and software patches. Capital scarcity in emerging markets hampers replacement planning despite mounting compliance pressure. "Safety-as-a-Service" subscription schemes now spread capital across multi-year operating budgets, yet financing options remain limited, especially where local lenders assign high risk premiums.
Other drivers and restraints analyzed in the detailed report include:
- Digitalized Diagnostics Transform Proof-Testing Economics
- SIL-Certified Cyber-Secure Architectures Address New Threats
- Legacy-System Integration Complexity Extends Timelines and Budgets
For complete list of drivers and restraints, kindly check the Table Of Contents.
Segment Analysis
Software and Services recorded the fastest 7.11% CAGR because cloud analytics, machine learning, and virtual-commissioning tools unlock fresh value streams. The Safety Instrumented System market size for Software and Services is projected to climb from USD 1.27 billion in 2025 to USD 1.91 billion by 2031. AI-enhanced platforms distinguish genuine process excursions from noise, cutting nuisance trips by 50% and conserving production. Sensors retain a 38.10% revenue lead, yet the market pivots toward data-centric offerings that complement hardware with actionable insight.
Logic Solvers and Safety PLCs grow at a steady clip, buoyed by rising demand for high-pressure and high-speed applications. Final Elements leverage smart actuators providing continuous feedback, strengthening proof-test coverage. Vendors bundle sensors with subscription analytics, shifting revenue toward recurring models and reinforcing stickiness among installed-base customers.
Emergency Shutdown retains 41.30% share in 2025, yet HIPPS experiences the highest 7.23% CAGR. Hydrogen pipelines and blue-ammonia export terminals require HIPPS capable of 2 second closure under 1,000 bar pressure. The Safety Instrumented System market size attached to HIPPS is forecast to almost double by 2030 as governments allocate record hydrogen incentives. Fire and Gas monitoring accelerates on stricter emissions controls, introducing multi-spectrum detectors that reduce false alarms. Burner Management Systems and Turbomachinery Control integrate with plant-wide safety layers, enabling coordinated shutdown to avert cascading failures.
Complete Report Scope:
- By Component
- Safety Sensors
- Logic Solvers / Safety PLCs
- Final Elements (Valves, Actuators, Solenoids)
- Software and Services
- By Application
- Emergency Shutdown Systems (ESD)
- Fire and Gas Monitoring and Control (FandG)
- High-Integrity Pressure Protection Systems (HIPPS)
- Burner Management Systems (BMS)
- Turbomachinery Control (TMC)
- By End-User Industry
- Oil and Gas
- Chemicals and Petrochemicals
- Power Generation (incl. Nuclear and Renewables)
- Pharmaceuticals and Life Sciences
- Food and Beverage
- Metals and Mining
- Water and Wastewater
- Other End-User Industries
- By Service
- Engineering and Consulting
- Integration and Installation
- Testing, Certification and Audit
- Maintenance and Training
- By Geography
- North America
- South America
- Europe
- Asia-Pacific
- Middle East and Africa
Geography Analysis
North America generated 39.24% of 2025 revenue on the back of OSHA Process Safety Management rigor and Gulf Coast brownfield programs. The United States alone houses more than 3,000 newly certified functional-safety engineers every year, sustaining a robust project pipeline. Operators focus on analytics upgrades, integrating cloud dashboards that visualize safety metrics for executive leadership. Canada's upstream LNG terminals invest in SIL 3 HIPPS to safeguard high-pressure pipelines.
Europe follows with sizeable share under SEVESO III and the push for digital sovereignty that embeds cybersecurity into functional safety. Refiners in Germany and the Netherlands add predictive proof-testing to optimize turnarounds. Offshore North Sea platforms retrofit common-asset safety suites monitored from onshore control centers, shrinking field labor requirements.
Asia-Pacific is the fastest-growing territory at 8.13% CAGR. China and India commission large chemical parks with integrated safety from day one, bypassing legacy barriers. Government hydrogen roadmaps fast-track HIPPS spending, while Southeast Asian petrochemical hubs adopt modular Safety-as-a-Service to cap upfront capital. Australia's mining sector deploys AI-based diagnostics to balance extreme uptime demands with worker-safety mandates.
The Middle East and Africa channel petro-revenues into high-spec refineries, often engaging international licensors that include certified safety as part of engineering packages. South America shows rising activity within mining and biofuels as operators align with stricter environmental standards and insurer expectations.
- ABB Ltd.
- Baker Hughes Co.
- Emerson Electric Co.
- General Electric Co.
- HIMA Paul Hildebrandt GmbH and Co KG
- Honeywell International Inc.
- Johnson Controls International plc (Tyco Fire and Security)
- Mangan Inc.
- Mitsubishi Electric Corp.
- Moore Industries-International, Inc.
- Omron Corp.
- Pepperl+Fuchs SE
- Pilz GmbH and Co. KG
- Proserv Controls LLC
- Rockwell Automation Inc.
- Rotork plc
- Schneider Electric SE
- Schlumberger NV
- Siemens AG
- SIS-TECH Solutions LP
- Valmet Oyj
- Yokogawa Electric Corp.
Additional Benefits:
- The market estimate (ME) sheet in Excel format
- 3 months of analyst support
TABLE OF CONTENTS
1 INTRODUCTION
- 1.1 Study Assumptions and Market Definition
- 1.2 Scope of the Study
2 RESEARCH METHODOLOGY
3 EXECUTIVE SUMMARY
4 MARKET LANDSCAPE
- 4.1 Market Overview
- 4.2 Market Drivers
- 4.2.1 Stricter global functional-safety regulations (IEC 61511, OSHA PSM)
- 4.2.2 Accelerating brown-field upgrades in oil and gas and chemicals
- 4.2.3 Digitalized diagnostics and IIoT cut downtime and proof-test cost
- 4.2.4 SIL-certified cyber-secure architectures drive replacement demand
- 4.2.5 Modular "Safety as-a-Service" platforms for mid-tier plants
- 4.2.6 Decarbonization (blue-H2, CCUS) projects require new HIPPS
- 4.3 Market Restraints
- 4.3.1 High capex and lifecycle maintenance cost
- 4.3.2 Legacy-system integration complexity
- 4.3.3 Shortage of TUV/CFSE-certified safety engineers
- 4.3.4 SIL-grade component supply-chain constraints
- 4.4 Industry Value Chain Analysis
- 4.5 Regulatory Landscape
- 4.6 Technological Outlook
- 4.7 Porter's Five Forces Analysis
- 4.7.1 Threat of New Entrants
- 4.7.2 Bargaining Power of Buyers
- 4.7.3 Bargaining Power of Suppliers
- 4.7.4 Threat of Substitutes
- 4.7.5 Intensity of Competitive Rivalry
5 MARKET SIZE AND GROWTH FORECASTS (VALUE)
- 5.1 By Component
- 5.1.1 Safety Sensors
- 5.1.2 Logic Solvers / Safety PLCs
- 5.1.3 Final Elements (Valves, Actuators, Solenoids)
- 5.1.4 Software and Services
- 5.2 By Application
- 5.2.1 Emergency Shutdown Systems (ESD)
- 5.2.2 Fire and Gas Monitoring and Control (FandG)
- 5.2.3 High-Integrity Pressure Protection Systems (HIPPS)
- 5.2.4 Burner Management Systems (BMS)
- 5.2.5 Turbomachinery Control (TMC)
- 5.3 By End-User Industry
- 5.3.1 Oil and Gas
- 5.3.2 Chemicals and Petrochemicals
- 5.3.3 Power Generation (incl. Nuclear and Renewables)
- 5.3.4 Pharmaceuticals and Life Sciences
- 5.3.5 Food and Beverage
- 5.3.6 Metals and Mining
- 5.3.7 Water and Wastewater
- 5.3.8 Other End-User Industries
- 5.4 By Service
- 5.4.1 Engineering and Consulting
- 5.4.2 Integration and Installation
- 5.4.3 Testing, Certification and Audit
- 5.4.4 Maintenance and Training
- 5.5 By Geography
- 5.5.1 North America
- 5.5.2 South America
- 5.5.3 Europe
- 5.5.4 Asia-Pacific
- 5.5.5 Middle East and Africa
6 COMPETITIVE LANDSCAPE
- 6.1 Market Concentration
- 6.2 Strategic Moves
- 6.3 Market Share Analysis
- 6.4 Company Profiles (includes Global-level Overview, Market-level Overview, Core Segments, Financials as available, Strategic Information, Market Rank/Share, Products and Services, Recent Developments)
- 6.4.1 ABB Ltd.
- 6.4.2 Baker Hughes Co.
- 6.4.3 Emerson Electric Co.
- 6.4.4 General Electric Co.
- 6.4.5 HIMA Paul Hildebrandt GmbH and Co KG
- 6.4.6 Honeywell International Inc.
- 6.4.7 Johnson Controls International plc (Tyco Fire and Security)
- 6.4.8 Mangan Inc.
- 6.4.9 Mitsubishi Electric Corp.
- 6.4.10 Moore Industries-International, Inc.
- 6.4.11 Omron Corp.
- 6.4.12 Pepperl+Fuchs SE
- 6.4.13 Pilz GmbH and Co. KG
- 6.4.14 Proserv Controls LLC
- 6.4.15 Rockwell Automation Inc.
- 6.4.16 Rotork plc
- 6.4.17 Schneider Electric SE
- 6.4.18 Schlumberger NV
- 6.4.19 Siemens AG
- 6.4.20 SIS-TECH Solutions LP
- 6.4.21 Valmet Oyj
- 6.4.22 Yokogawa Electric Corp.
7 MARKET OPPORTUNITIES AND FUTURE OUTLOOK
- 7.1 White-space and Unmet-need Assessment


