

|
시장보고서
상품코드
2120744
크레인 : 시장 점유율 분석, 업계 동향과 통계, 성장 예측(2026-2031년)Crane - Market Share Analysis, Industry Trends & Statistics, Growth Forecasts (2026 - 2031) |
||||||
 Mordor Intelligence
Mordor Intelligence에 의하면, 크레인 시장 규모는 2025년 344억 1,000만 달러에서 2026년에는 358억 2,000만 달러에 이르고, 2026-2031년 CAGR 4.10%로 성장을 지속하여, 2031년까지 437억 8,000만 달러에 달할 것으로 예측됩니다.
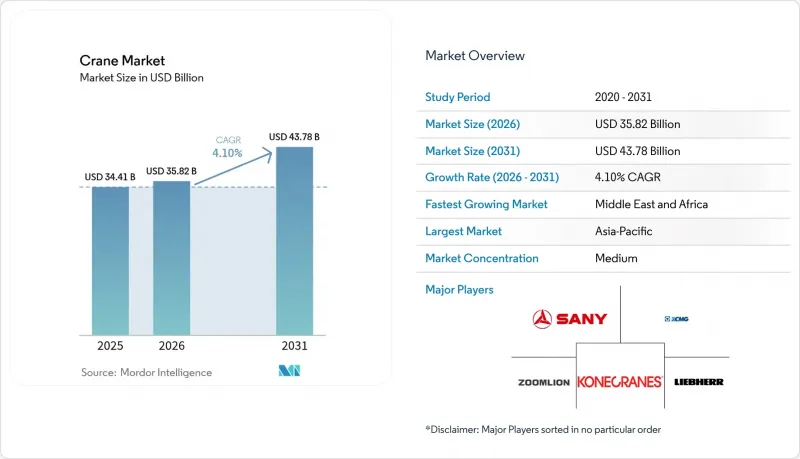
본 보고서는 유형(이동식 크레인, 고정식 크레인, 선박·해상 크레인), 적재량(50톤 이하, 51-150톤, 151-300톤, 300톤 초과), 동력원(디젤, 하이브리드, 완전 전기식), 붐 유형(래티스 붐, 텔레스코픽 붐), 용도(건설, 광업 등) 및 지역별로 분류되어 있습니다. 시장 예측은 금액(미 달러) 및 수량(대)으로 제시되어 있습니다.
세계 크레인 시장 동향과 인사이트
확대되는 인프라 개발
인프라 현대화가 크레인 수요의 주요 원동력으로 부상하고 있으며, ‘인프라 투자 및 고용법’만 해도 교통, 에너지, 디지털 인프라 각 분야에서 계획된 투자액이 1조 2,000억 달러 이상에 달할 전망입니다. 이러한 인프라 구축 규모는 기존의 도로나 교량 프로젝트에 그치지 않고, 특수한 중량물 운반 능력이 필요한 데이터센터, 반도체 제조 공장, 청정 에너지 시설까지 미치고 있습니다. 건설 지출은 연간 2조 1,300억 달러에 달할 것으로 예측되며, 공공 인프라는 전년 대비 약 8%의 성장을 보일 것으로 전망됩니다. 이러한 인프라 재건은 크레인 운전사들에게 수년에 걸친 사업 전망을 제공하며, 프로젝트 수주 잔고는 2027년까지 충분히 확보되어 있습니다. 또한, 인프라 프로젝트에서 모듈식 건설 기술로의 전환에 따라 수백 톤에 달하는 중량의 조립식 부재를 다룰 수 있는 고정밀 리프팅 장비에 대한 수요도 증가하고 있습니다. 연방 정부의 인프라 자금 지원 덕분에 각 주에서는 인재 양성 프로그램에 투자할 수 있게 되었으며, 그렇지 않았다면 시장 성장을 저해할 수도 있었던 공인 크레인 운전사의 심각한 부족 문제를 해결하고 있습니다.
재생에너지 설비 설치 급증
재생에너지로의 전환은 크레인 시장의 역학을 근본적으로 변화시키고 있으며, 해상 풍력 발전소 설치로 인해 2,500톤을 초과하는 터빈 부품을 들어 올릴 수 있는 특수한 해양용 크레인에 대한 수요가 주도되고 있습니다. 풍력 터빈 설치선에는 점점 더 정교한 크레인 시스템이 탑재되고 있으며, 카델러(Kadeller)사의 ‘Wind Peak’호처럼 한 번의 적재로 15MW 터빈 세트 7기를 운송할 수 있는 선박도 있습니다. 재생에너지 도입 규모는 전례 없이 확대되고 있으며, Huisman사와 같은 기업들은 높이 150미터를 넘는 장소에서 부품을 취급하기 위한 전용 해상 풍력 발전 설치용 크레인과 흔들림 보정 플랫폼을 개발하고 있습니다. 태양광 발전 설비 설치는 특히 패널이나 지지대 시스템을 광대한 지역에 걸쳐 정확하게 배치해야 하는 대규모 프로젝트에서 이동식 크레인 수요를 견인하고 있습니다. 재생에너지 분야의 성장은 부유식 해상 풍력 발전 플랫폼에서 특수한 리프팅 솔루션이 필요한 집광형 태양광 발전 설비에 이르기까지 크레인의 새로운 응용 분야를 창출하고 있습니다. 재생에너지 인프라에는 지속적인 유지보수 및 부품 교체가 필요하기 때문에 이러한 에너지 전환으로 인해 기존 건설 주기를 훨씬 뛰어넘는 크레인 수요 증가가 지속될 것으로 예측됩니다.
높은 자본 비용과 운영 비용
크레인 업계는 시장 확대를 제약하는 비용 압박 증가에 직면해 있습니다. 매니토웍(Manitowoc)사의 모델 31000과 같은 신형 중량물용 크레인은 가격이 3,000만 달러에 달하는 한편, 지속적인 유지보수를 위해 막대한 투자가 필요합니다. 자재비 급등으로 인해 주요 시장 전반에서 건축자재 가격이 평균 15% 상승했으며, 이는 크레인 제조 비용과 임대 요금에 직접적인 영향을 미치고 있습니다. 높은 금리 또한 이러한 과제를 더욱 심각하게 만들고 있으며, 설비 자금 조달 비용이 대폭 상승하여 크레인 구매 및 임대 수요에 영향을 주고 있습니다. 소규모 크레인 사업자는 가격 상승을 흡수할 만한 규모를 갖추지 못했기 때문에 이러한 비용 압박에 특히 취약하며, 시장에서 철수할 수밖에 없거나 대형 사업자와의 통합을 강요받을 가능성이 있습니다. 또한, 현대 크레인 시스템의 복잡화도 유지보수 비용을 상승시키고 있으며, 전문 기술자나 고가의 교체 부품이 필요하기 때문에 사업자의 예산을 압박할 우려가 있습니다. 인증된 조작자 교육 비용도 증가하고 있으며, 시뮬레이션을 활용한 프로그램은 교육 기간 단축이나 안전성 향상과 같은 장기적인 이점이 있는 반면, 막대한 초기 투자가 필요합니다.
부문 분석
2025년 시점에서 이동식 크레인은 44.82%라는 최대 시장 점유율을 유지하고 있으며, 이는 건설, 인프라, 산업용도에 걸친 그 범용성을 반영하고 있습니다. 이동식 크레인 부문은 다양한 작업 현장에 대한 적응성과 여러 프로젝트에 신속하게 투입할 수 있는 능력이라는 장점 덕분에, 다양한 작업 부하를 관리하는 도급업체에게 최적의 선택지가 되고 있습니다. 해양 및 오프쇼어 크레인은 2026년부터 2031년까지 연평균 성장률(CAGR) 7.12%라는 가장 강력한 성장 궤도를 그리고 있으며, 이는 오프쇼어 풍력 발전 설비의 유례없는 확대와 선박 탑재형 특수 리프팅 솔루션에 대한 수요에 힘입은 것입니다.
타워 크레인 및 천장 크레인 시스템을 포함한 고정식 크레인은 고층 건물 및 산업 시설에서 중요한 역할을 수행하고 있으며, 특히 중동 및 아시아태평양의 도시권 메가 프로젝트에서 수요가 활발합니다. 선박 및 해양 부문의 급속한 성장은 해상 풍력 터빈 설치의 특수성을 반영합니다. 이 작업에서는 크레인이 가혹한 해양 환경에서 가동되면서 수천 톤에 달하는 중량의 부품을 취급해야 합니다. Cadeler와 같은 기업들은 지속적으로 성장하는 해상 풍력 시장에 대응하기 위해, 2,200톤의 적재 능력을 갖춘 크레인을 탑재한 풍력 터빈 설치선에 막대한 투자를 하고 있습니다. 해상 풍력 터빈의 대형화가 진행됨에 따라, 가혹한 기상 조건에서도 고정밀 인양이 가능한 더욱 고도화된 선박용 크레인 시스템에 대한 수요가 증가하고 있습니다.
51-150톤 부문은 2025년에 33.60%라는 가장 큰 시장 점유율을 차지하고 있으며, 일반 건설 및 산업용도에 가장 적합한 범위입니다. 300톤을 초과하는 부문은 2026년부터 2031년까지 연평균 성장률(CAGR) 7.78%라는 가장 빠른 성장세를 보이고 있으며, 이는 전례 없는 리프팅 능력을 요구하는 메가 프로젝트로 업계가 전환되고 있음을 반영합니다. 이 중용량 부문은 적재 능력과 운영상의 유연성 사이에서 뛰어난 균형을 이루고 있어, 상업용 건물에서 인프라 개발에 이르기까지 다양한 건설 프로젝트에 적합합니다.
중량물 운반 수요는 원자로 부품, 공정 모듈, 수백 톤에 달하는 터빈 어셈블리를 들어 올릴 수 있는 크레인이 필요한 원자력 발전소 건설, 석유화학 시설 및 해상 에너지 프로젝트에 의해 주도되고 있습니다. 마모엣(Mamoet)이 개발한 6,000톤 용량의 SK6000 크레인은 초대형 중량물 운반 능력을 향한 업계의 노력을 상징합니다. 최대 50톤의 부문은 소규모 건설 프로젝트 및 유지보수 작업에 대응하며, 151-300톤 범위는 중규모 산업 및 인프라의 요구를 충족합니다. Zoomlion의 3,600톤급 크롤러 크레인은 단일 리프팅 중량 부문에서 세계 기록을 수립하며, 중량물 리프팅 능력에 있어 기술적 진보를 입증하고 있습니다. 조립식 부재에는 정밀한 인양 및 위치 결정 능력이 요구되므로, 모듈식 건설의 추세가 전체 용량 범위에 걸친 수요를 견인하고 있습니다.
지역별 분석
2025년, 아시아태평양은 크레인 시장 매출의 41.70%를 차지했습니다. 이는 중국에서 유틸리티 지출이 계속해서 높은 수준을 유지하고, 인도에서 공장 건설이 가속화되었기 때문입니다. 중국의 항만 자동화 성공 사례에서는 브리지 크레인 1대당 시간당 평균 60.9개의 컨테이너를 처리하고 있으며, 이는 하역 성능 면에서 이 지역의 선도적 위치를 여실히 보여줍니다. 인도의 2025년도 연방 예산에서는 인프라에 대한 예산 배분이 계속해서 높은 수준을 유지하고 있으며, 선거 연도의 신중한 태도에도 불구하고 크롤러 크레인과 타워 크레인에 대한 지속적인 수요를 뒷받침하고 있습니다. 일본과 한국은 시설 유지 관리 및 현대화를 원동력으로 한 자릿수 초반의 낮은 성장률을 기록하고 있습니다.
중동 및 아프리카은 2026년부터 2031년에 걸쳐 연평균 성장률(CAGR) 6.38%로 가장 높은 성장률을 나타낼 것으로 예측됩니다. 사우디아라비아만 해도 NEOM 및 관련 기가 프로젝트를 위해 약 2만 대의 타워 크레인을 도입할 예정입니다. Wolffkran이나 Zamil Group의 신규 공장 같은 현지 합작 사업을 통해 수입 리드타임이 단축되고, 현지화된 공급망이 구축되고 있습니다. 원유 가격 급등으로 인해, 수익이 중량물 운반용 크롤러 크레인에 의존하는 하류 석유화학 단지로 유입되면서 용도의 다양화가 진행되고 있습니다.
북미에서는 1조 2,000억 달러 규모의 ‘인프라 투자 및 고용법’의 혜택을 받고 있으며, 이 법에 따라 6만 건 이상의 프로젝트에 자금이 공급되어 수년에 걸친 업무량이 유지되고 있습니다. 미국의 건설기계 임대 시장은 2025년에 773억 달러에 달할 것으로 예측되며, 크레인이 그 중 큰 비중을 차지하고 있습니다. 유럽에서는 호불호가 엇갈리는 상황이 나타나고 있습니다. 해상 풍력 발전이 설비 수요를 가속화하는 반면, 금리 상승이 상업용 부동산의 착공을 억제하고 있습니다. 라틴아메리카의 회복세는 원자재 가격에 좌우되지만, 브라질에서 에너지 입찰이 재개됨에 따라 해당 지역에서 중량물 운반용 크레인의 수주가 증가하고 있습니다.
기타 혜택:
- 엑셀 형식 시장 예측(ME) 시트
- 3개월간 애널리스트 지원
자주 묻는 질문
목차
제1장 서론
제2장 조사 방법
제3장 주요 요약
제4장 시장 구도
제5장 시장 규모와 성장 예측
제6장 경쟁 구도
제7장 시장 기회와 향후 전망
LSH 26.09.08According to Mordor Intelligence, the crane market size is expected to grow from USD 34.41 billion in 2025 to USD 35.82 billion in 2026 and is forecast to reach USD 43.78 billion by 2031 at 4.10% CAGR over 2026-2031.
This report is Segmented by Type (Mobile Crane, Fixed Crane, and Marine and Offshore Crane), Capacity (Up To 50 T, 51 To 150 T, 151 To 300 T, and Above 300 T), Power Source (Diesel, Hybrid, and Fully Electric), Boom Type (Lattice Boom and Telescopic Boom), Application (Construction and Mining and More), and Geography. The Market Forecasts are Provided in Terms of Value (USD) and Volume (Units).
Global Crane Market Trends and Insights
Growing Infrastructure Development
Infrastructure modernization has emerged as the primary catalyst for crane demand, with the Infrastructure Investment and Jobs Act alone generating over USD 1.2 trillion in planned investments across transportation, energy, and digital infrastructure. The scale of this infrastructure push extends beyond traditional road and bridge projects to encompass data centers, semiconductor fabs, and clean energy facilities that require specialized heavy-lifting capabilities. Construction spending is projected to reach USD 2.13 trillion annually, with public infrastructure accounting for nearly 8% year-over-year growth. This infrastructure renaissance creates multi-year visibility for crane operators, extending project backlogs well into 2027. The shift toward modular construction techniques in infrastructure projects also drives demand for precision lifting equipment capable of handling prefabricated components weighing hundreds of tons. Federal infrastructure funding has enabled states to invest in workforce development programs, addressing the critical shortage of certified crane operators that could otherwise constrain market growth.
Surge in Renewable Energy Installations
The renewable energy transition fundamentally reshapes crane market dynamics, with offshore wind installations driving demand for specialized marine cranes capable of lifting turbine components exceeding 2,500 tons. Wind turbine installation vessels are being delivered with increasingly sophisticated crane systems, including Cadeler's Wind Peak vessel, capable of transporting seven complete 15 MW turbine sets per load. The scale of renewable energy deployment is unprecedented, with companies like Huisman developing specialized offshore wind installation cranes and motion-compensated platforms to handle components at heights exceeding 150 meters. Solar installations drive demand for mobile cranes, particularly in utility-scale projects where panels and mounting systems require precise positioning across vast areas. The growth of the renewable energy sector is creating new crane application categories, from floating offshore wind platforms to concentrated solar power installations requiring specialized lifting solutions. This energy transition is expected to sustain crane demand growth well beyond traditional construction cycles, as renewable energy infrastructure requires ongoing maintenance and component replacement.
High Capital and Operating Costs
The crane industry faces mounting cost pressures constraining market expansion, with new heavy-lift cranes like Manitowoc's Model 31000 commanding prices of USD 30 million while requiring substantial ongoing maintenance investments. Material cost inflation has increased construction input prices by an average of 15% across major markets, directly impacting crane manufacturing costs and rental rates. High interest rates compound these challenges, with equipment financing costs rising significantly and affecting crane purchases and rental demand. Smaller crane operators are particularly vulnerable to these cost pressures, as they lack the scale to absorb price increases and may be forced to exit the market or consolidate with larger players. The complexity of modern crane systems is also driving up maintenance costs, requiring specialized technicians and expensive replacement parts that can strain operator budgets. Training costs for certified operators are increasing, with simulation-based programs requiring substantial upfront investments despite their long-term benefits in reducing training time and improving safety outcomes.
Other drivers and restraints analyzed in the detailed report include:
- Industrial Growth Across Emerging Economies
- Accelerated Urbanization & Megaproject Pipelines
- Economic Cyclicality of Construction Spending
For complete list of drivers and restraints, kindly check the Table Of Contents.
Segment Analysis
Mobile cranes maintain the largest market share at 44.82% in 2025, reflecting their versatility across construction, infrastructure, and industrial applications. The mobile crane segment benefits from its adaptability to diverse job sites and the ability to be rapidly deployed across multiple projects, making it the preferred choice for contractors managing varied workloads. Marine and offshore cranes are experiencing the strongest growth trajectory at 7.12% CAGR 2026-2031, driven by the unprecedented expansion of offshore wind installations and the need for specialized vessel-mounted lifting solutions.
Fixed cranes, encompassing tower cranes and overhead systems, serve critical roles in high-rise construction and industrial facilities, with the demand particularly strong in urban megaprojects across the Middle East and Asia Pacific. The marine and offshore segment's rapid growth reflects the specialized nature of offshore wind turbine installation, where cranes must operate in challenging maritime environments while handling components weighing thousands of tons. Companies like Cadeler invest heavily in wind turbine installation vessels equipped with 2,200-ton capacity cranes to serve the growing offshore wind market. The evolution toward larger offshore wind turbines drives demand for increasingly sophisticated marine crane systems capable of lifting precision in harsh weather conditions.
The 51-150 ton segment commands the largest market share at 33.60% in 2025, representing the sweet spot for general construction and industrial applications. The above 300-ton capacity segment is experiencing the fastest growth at 7.78% CAGR 2026-2031, reflecting the industry's shift toward megaprojects requiring unprecedented lifting capabilities. This mid-range capacity segment benefits from its balance of lifting capability and operational flexibility, making it suitable for various construction projects from commercial buildings to infrastructure development.
Heavy-lift applications are being driven by nuclear power plant construction, petrochemical facilities, and offshore energy projects that require cranes capable of lifting reactor components, process modules, and turbine assemblies weighing hundreds of tons. Mammoet's 6,000-ton capacity SK6000 crane development exemplifies the industry's push toward ultra-heavy lifting capabilities. The up to 50-ton segment serves smaller construction projects and maintenance applications, while the 151-300 ton range addresses mid-scale industrial and infrastructure needs. Zoomlion's 3,600-ton crawler crane, setting world records for single lifting weight, demonstrates the technological advancement in heavy-lift capabilities. Modular construction trends drive demand across all capacity ranges, as prefabricated components require precise lifting and positioning capabilities.
Complete Report Scope:
- By Type
- Mobile Crane
- All-terrain Crane
- Rough-terrain Crane
- Crawler Crane
- Truck-mounted Crane
- Other Mobile Cranes
- Fixed Crane
- Monorail and Under-hung
- Overhead Track-mounted
- Tower Crane
- Marine and Offshore Crane
- Mobile Harbor Crane
- Fixed Harbor Crane
- Offshore Crane
- Ship Crane
- Mobile Crane
- By Capacity
- Up to 50 T
- 51 to 150 T
- 151 to 300 T
- Above 300 T
- By Power Source
- Diesel
- Hybrid
- Fully Electric
- By Boom Type
- Lattice Boom
- Telescopic Boom
- By Application
- Construction and Mining
- Energy and Utilities
- Shipbuilding and Ports
- Industrial Manufacturing
- Logistics and Warehousing
- By Geography
- North America
- United States
- Canada
- Rest of North America
- South America
- Brazil
- Argentina
- Rest of South America
- Europe
- Germany
- United Kingdom
- France
- Italy
- Spain
- Rest of Europe
- Asia-Pacific
- China
- Japan
- India
- South Korea
- Rest of Asia-Pacific
- Middle East and Africa
- Saudi Arabia
- United Arab Emirates
- South Africa
- Rest of Middle East and Africa
- North America
Geography Analysis
Asia-Pacific accounted for 41.70% of crane market revenue in 2025 as China sustained high public works spending and India accelerated factory construction. Chinese port automation success stories, with single bridge cranes averaging 60.9 container moves an hour, illustrate regional leadership in throughput performance. India's Union Budget 2025 maintained elevated infrastructure allocations, underpinning continued demand for crawlers and tower cranes despite election-year caution. Japan and South Korea post low-single-digit growth, driven by facility maintenance and modernization.
The Middle East and Africa region is projected to post the fastest 6.38% CAGR between 2026-2031. Saudi Arabia alone intends to deploy about 20,000 tower cranes for NEOM and associated giga-projects. Local joint ventures, such as Wolffkran and Zamil Group's new factory, reduce import lead times and create a localized supply chain. High oil prices funnel revenue into downstream petrochemical complexes that rely on heavy-lift crawler cranes, broadening application diversity.
North America benefits from the USD 1.2 trillion Infrastructure Investment and Jobs Act, which funds over 60,000 projects and sustains multi-year workloads. The U.S. equipment rental sector is forecast to reach USD 77.3 billion in 2025, with cranes forming a sizable share. Europe faces mixed signals: offshore wind accelerates equipment demand, yet elevated interest rates suppress commercial real estate starts. Latin America's recovery hinges on commodity pricing, while renewed Brazilian energy auctions boost regional heavy-lift orders.
- Liebherr-International AG
- Tadano Ltd.
- Konecranes Plc
- Manitowoc Co.
- XCMG Group
- Terex Corporation
- SANY Group
- Zoomlion Heavy Industry Sci and Tech
- Kobelco Construction Machinery
- Palfinger AG
- Hitachi Sumitomo Cranes
- Favelle Favco Group
- Cargotec Oyj (Hiab)
- Sarens NV
- Mammoet
- Link-Belt Cranes
- Altec Inc.
- Effer SpA
- Bocker Maschinenwerke
Additional Benefits:
- The market estimate (ME) sheet in Excel format
- 3 months of analyst support
TABLE OF CONTENTS
1 Introduction
- 1.1 Study Assumptions and Market Definition
- 1.2 Scope of the Study
2 Research Methodology
3 Executive Summary
4 Market Landscape
- 4.1 Market Overview
- 4.2 Market Drivers
- 4.2.1 Growing infrastructure development
- 4.2.2 Surge in renewable-energy (wind-farm) installations
- 4.2.3 Industrial growth across emerging economies
- 4.2.4 Accelerated urbanisation and megaproject pipelines
- 4.2.5 Telematics-driven fleet optimisation (under-radar)
- 4.2.6 Adoption of hybrid/e-cranes to meet site-emission rules (under-radar)
- 4.3 Market Restraints
- 4.3.1 High capital and operating costs
- 4.3.2 Economic cyclicality of construction spending
- 4.3.3 Shortage of certified crane operators (under-radar)
- 4.3.4 Carbon-footprint scrutiny and cradle-to-grave reporting (under-radar)
- 4.4 Value / Supply-Chain Analysis
- 4.5 Regulatory Landscape
- 4.6 Technological Outlook
- 4.7 Porter's Five Forces
- 4.7.1 Threat of New Entrants
- 4.7.2 Bargaining Power of Buyers
- 4.7.3 Bargaining Power of Suppliers
- 4.7.4 Threat of Substitute Products
- 4.7.5 Intensity of Competitive Rivalry
5 Market Size and Growth Forecasts
- 5.1 By Type
- 5.1.1 Mobile Crane
- 5.1.1.1 All-terrain Crane
- 5.1.1.2 Rough-terrain Crane
- 5.1.1.3 Crawler Crane
- 5.1.1.4 Truck-mounted Crane
- 5.1.1.5 Other Mobile Cranes
- 5.1.2 Fixed Crane
- 5.1.2.1 Monorail and Under-hung
- 5.1.2.2 Overhead Track-mounted
- 5.1.2.3 Tower Crane
- 5.1.3 Marine and Offshore Crane
- 5.1.3.1 Mobile Harbor Crane
- 5.1.3.2 Fixed Harbor Crane
- 5.1.3.3 Offshore Crane
- 5.1.3.4 Ship Crane
- 5.1.1 Mobile Crane
- 5.2 By Capacity
- 5.2.1 Up to 50 T
- 5.2.2 51 to 150 T
- 5.2.3 151 to 300 T
- 5.2.4 Above 300 T
- 5.3 By Power Source
- 5.3.1 Diesel
- 5.3.2 Hybrid
- 5.3.3 Fully Electric
- 5.4 By Boom Type
- 5.4.1 Lattice Boom
- 5.4.2 Telescopic Boom
- 5.5 By Application
- 5.5.1 Construction and Mining
- 5.5.2 Energy and Utilities
- 5.5.3 Shipbuilding and Ports
- 5.5.4 Industrial Manufacturing
- 5.5.5 Logistics and Warehousing
- 5.6 By Geography
- 5.6.1 North America
- 5.6.1.1 United States
- 5.6.1.2 Canada
- 5.6.1.3 Rest of North America
- 5.6.2 South America
- 5.6.2.1 Brazil
- 5.6.2.2 Argentina
- 5.6.2.3 Rest of South America
- 5.6.3 Europe
- 5.6.3.1 Germany
- 5.6.3.2 United Kingdom
- 5.6.3.3 France
- 5.6.3.4 Italy
- 5.6.3.5 Spain
- 5.6.3.6 Rest of Europe
- 5.6.4 Asia-Pacific
- 5.6.4.1 China
- 5.6.4.2 Japan
- 5.6.4.3 India
- 5.6.4.4 South Korea
- 5.6.4.5 Rest of Asia-Pacific
- 5.6.5 Middle East and Africa
- 5.6.5.1 Saudi Arabia
- 5.6.5.2 United Arab Emirates
- 5.6.5.3 South Africa
- 5.6.5.4 Rest of Middle East and Africa
- 5.6.1 North America
6 Competitive Landscape
- 6.1 Market Concentration
- 6.2 Strategic Moves
- 6.3 Market Share Analysis
- 6.4 Company Profiles (includes Global level Overview, Market level overview, Core Segments, Financials as available, Strategic Information, Market Rank/Share for key companies, Products and Services, and Recent Developments)
- 6.4.1 Liebherr-International AG
- 6.4.2 Tadano Ltd.
- 6.4.3 Konecranes Plc
- 6.4.4 Manitowoc Co.
- 6.4.5 XCMG Group
- 6.4.6 Terex Corporation
- 6.4.7 SANY Group
- 6.4.8 Zoomlion Heavy Industry Sci and Tech
- 6.4.9 Kobelco Construction Machinery
- 6.4.10 Palfinger AG
- 6.4.11 Hitachi Sumitomo Cranes
- 6.4.12 Favelle Favco Group
- 6.4.13 Cargotec Oyj (Hiab)
- 6.4.14 Sarens NV
- 6.4.15 Mammoet
- 6.4.16 Link-Belt Cranes
- 6.4.17 Altec Inc.
- 6.4.18 Effer SpA
- 6.4.19 Bocker Maschinenwerke
7 Market Opportunities and Future Outlook
- 7.1 White-space and Unmet-Need Assessment


