

|
시장보고서
상품코드
2120803
매니지드 모빌리티 서비스 : 시장 점유율 분석, 업계 동향과 통계, 성장 예측(2026-2031년)Managed Mobility Services - Market Share Analysis, Industry Trends & Statistics, Growth Forecasts (2026 - 2031) |
||||||
 Mordor Intelligence
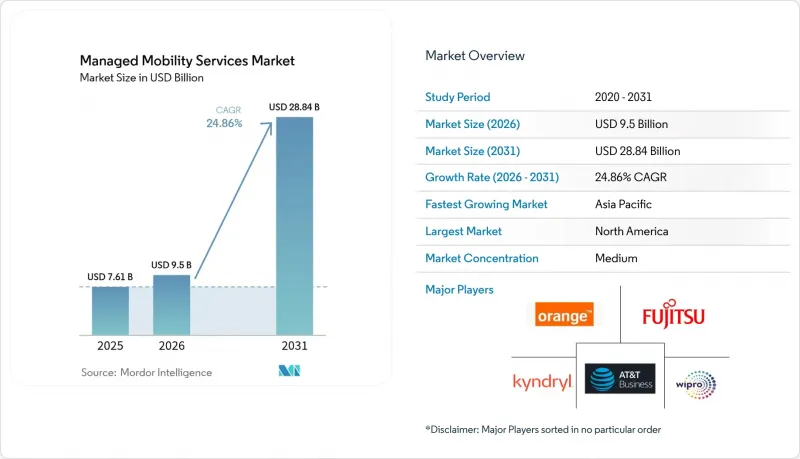
Mordor Intelligence에 따르면 매니지드 모빌리티 서비스 시장 규모는 2025년 76억 1,000만 달러에서 2026년에는 95억 달러로 확대되어, 2026년부터 2031년까지 CAGR 24.86%를 기록하며 2031년에는 288억 4,000만 달러에 달할 것으로 예측됩니다.
본 보고서는 기능별(모바일 기기 관리, 모바일 애플리케이션 관리 등), 도입 모델별(클라우드형 및 온프레미스형), 조직 규모별(대기업 및 중소기업), 최종사용자 산업별(IT·통신, BFSI, 헬스케어 등), 그리고 지역별로 분류되어 있습니다. 시장 예측은 금액(달러)으로 표시되어 있습니다.
세계 매니지드 모빌리티 서비스 시장의 동향 및 인사이트
BYOD의 보급과 하이브리드 근무의 정착
현재 기업 직원의 80%가 개인 소유 기기를 통해 사내 데이터에 접근하고 있기 때문에 기업은 그 어느 때보다 다양한 엔드포인트를 관리해야만 하며, 이러한 상황은 사내 IT 팀의 부담을 실질적인 한계를 넘어 확장시키고 있습니다. 관리되지 않는 스마트폰이나 태블릿에서 기밀 파일이 처리되면 사이버 위험이 높아지기 때문에 기업들은 사용자의 자유를 제한하지 않으면서도 정책을 통일할 수 있는 외부 전문가를 찾고 있습니다. 매니지드 모빌리티 서비스 시장의 벤더들은 전송 중 및 저장 중인 데이터를 보호하는 컨테이너화 및 실시간 위협 탐지 기술을 통해 이러한 요구에 부응하고 있습니다. 생산성 향상이 기기의 다양성으로 인한 영향을 상쇄하는 지식 집약적 산업에서 수요가 가장 빠르게 증가하고 있습니다. 보안, 사용자 경험, 규제 준수를 융합할 수 있는 서비스 제공업체는 하이브리드 근무 방식이 정착됨에 따라 대규모 다년 계약을 확보할 전망입니다.
TCO 절감을 위한 IT 및 모빌리티 라이프사이클 아웃소싱
예산 배분이 자본 지출에서 운영비로 전환됨에 따라, 예측 가능한 구독 모델이 매력적으로 대두되고 있습니다. 비교 조사에 따르면, 라이프사이클 업무를 자동화와 규모의 경제를 활용한 멀티테넌트형 제공업체로 이관함으로써 기기 1대당 지원 비용이 30% 절감되는 것으로 나타났습니다. 아웃소싱을 통해 과도한 업무에 시달리던 IT 팀은 전략적인 디지털 프로그램에 집중할 수 있게 되며, 경영진에게는 사용 현황, 규정 준수, 지출에 관한 통합 대시보드가 제공됩니다. 그 결과, 모빌리티 전문가를 보유하지 않은 중견 기업들 사이에서 매니지드 모빌리티 서비스 시장이 급속히 성장하고 있습니다. 벤더는 측정 가능한 비용 절감, 신속한 도입, 그리고 사내 대응을 능가하는 SLA 기반의 품질 지표를 입증할 수 있을 때 계약을 수주하고 있습니다.
운영 관리 상실 및 비용 가시성 부족에 대한 우려
경영진은 예산 책임 소재나 실시간 성과 데이터가 불투명해 보일 경우, 주요 모빌리티 기능을 제3자에게 맡기는 것을 주저합니다. 계약 협상 과정에서 변동 요금, 맞춤형 보고서 추가 요금, 또는 벤더 락인 조항이 드러나면 우려는 더욱 커집니다. 현재 공급업체 측은 상세한 대시보드, 유연한 해지 옵션, 벤치마크 가격을 제시함으로써 신뢰를 재구축하려 하고 있습니다. 투명성이 높은 거버넌스 체계와 공동 관리 모델을 통해, 리스크 회피 성향이 강한 조직이라도 매니지드 모빌리티 서비스 시장의 성장세를 유지할 수 있게 되었습니다.
부문 분석
2025년, 모바일 기기 관리는 매니지드 모빌리티 서비스 시장 점유율의 61.98%를 차지했습니다. 이는 기업들이 당초 스마트폰, 태블릿 및 내환경형 엔드포인트 전반에 걸친 통일된 정책 적용, 자산 추적 및 원격 삭제 기능을 우선시했기 때문입니다. 펌웨어 업데이트 및 암호화 상태에 대한 종합적인 관리를 통해 기기 계층은 규정 준수 감사 및 사고 대응에 필수적인 기반이 되었습니다. 그러나 조직이 보안 조치를 데이터 계층으로 세분화해 나가면서, 이 부문의 성장률은 보다 민첩한 애플리케이션 중심의 옵션에 뒤처지고 있습니다.
모바일 애플리케이션 관리는 컨테이너화를 통해 BYOD 단말기에서 기업용과 개인용 컨텍스트를 분리하고, 단말기 전체에 대한 간섭을 수반하는 제어가 필요하지 않기 때문에 기능별 카테고리 중 가장 높은 26.64%의 연평균 성장률(CAGR)을 기록할 것으로 예측됩니다. 의료 기관에서는 임상의가 개인 스마트폰을 사용할 수 있도록 하면서도 환자 기록을 보호하기 위해 앱 수준의 관리를 채택하고 있으며, 금융 기관에서는 모바일 뱅킹 어드바이저를 위해 보안 앱 래퍼를 도입하고 있습니다. 이러한 변화에 따라 벤더들은 고객이 여러 계약을 체결할 필요가 없도록 기기,앱, 콘텐츠의 각 모듈을 번들로 제공하도록 권장받고 있습니다. 이러한 융합을 통해 매니지드 모빌리티 서비스 시장은 진화하는 엔드포인트 위협과 직원의 기대에 유연하게 대응해 나갈 수 있습니다.
클라우드 솔루션은 2025년 매니지드 모빌리티 서비스 시장 규모의 68.15%를 차지하고 있으며, 기업들이 탄력적인 용량, 통합된 정책 적용, 신속한 기능 배포를 요구하는 가운데 연평균 성장률(CAGR) 26.92%로 그 성장세를 유지할 전망입니다. 멀티테넌트 아키텍처는 패치 배포, 분석 처리, 규정 준수 보고 측면에서 온프레미스 환경에서는 실현할 수 없는 규모의 경제를 가져옵니다. 또한 CIO들은 자본 투자를 필요로 하지 않으면서 가동 시간 보장을 충족하는, 하이퍼스케일 데이터센터를 통해 제공되는 지리적 중복성을 높이 평가하고 있습니다.
데이터 상주 요건이나 에어갭 운영이 요구되는 국방, 공공 부문 및 규제가 엄격한 공공 서비스 분야에서는 여전히 온프레미스 배포가 이어지고 있습니다. 이러한 업계 내에서도 핵심 ID 스토어는 온프레미스에 남겨두고, 디바이스 텔레메트리 및 AI 분석은 클라우드에서 처리되는 하이브리드 모델이 등장하고 있습니다. 이에 따라 서비스 제공업체들은 환경 간에 워크로드를 원활하게 이동시키는 커넥터를 갖춘 유연한 아키텍처에 투자하고 있습니다. 이러한 접근 방식을 통해 주권 관련 규제가 변화하더라도 대상 고객층을 폭넓게 유지할 수 있으며, 통합된 엔드포인트 모니터링을 위한 현실적인 경로로서 매니지드 모빌리티 서비스 시장을 강화하고 있습니다.
지역별 분석
북미는 2025년에도 39.35%의 점유율을 유지했습니다. 이는 초기부터 BYOD(개인 소유 단말기의 업무용 사용)를 수용하고, 클라우드 도입이 성숙 단계에 이르렀으며, 엄격한 개인정보 보호 규제가 맞물려 모든 기능을 갖춘 관리형 프로그램에 대한 투자를 촉진했기 때문입니다. 기업들은 모바일 위협 방어, 보안 연결 및 분석 기능을 통합된 계약에 포함시키는 것이 일반화되고 있으며, 이로 인해 평균 계약 금액이 상승하고 있습니다. 또한, 정부 기관이 FedRAMP 및 CJIS 요건을 충족하면서 서비스 제공의 현대화를 추진함에 따라 공공 부문의 수요도 증가하고 있으며, 이 모든 요인이 관리형 모빌리티 서비스 시장의 지역별 매출 규모를 확대시키고 있습니다.
아시아태평양은 산업의 디지털화, 정부의 스마트 시티 구상, 그리고 다각적인 E-Commerce 생태계에 힘입어 세계 최고 수준인 연평균 성장률(CAGR) 26.21%로 성장할 전망입니다. 중국의 주요 국내 클라우드 기업들은 모빌리티 서비스를 5G 사설 네트워크와 번들로 제공하고 있는 반면, 인도의 IT 서비스 통합업체들은 원격 지원을 갈망하는 현지 중소기업을 대상으로 세계 모범 사례를 도입하고 있습니다. 아세안(ASEAN) 국가들은 견고한 엔드포인트 보안에 의존하는 관광 분야의 국경 검사, 물류 회랑 및 금융 포용 프로그램의 효율성을 높이기 위해 인력 이동성에 투자하고 있습니다. 이러한 다양한 도입 사례는 지역 내 전문 지식을 심화시키고, 매니지드 모빌리티 서비스 시장에 새로운 자본을 유치하고 있습니다.
유럽에서는 GDPR 시행, 디지털 ID 제도, 그리고 주권 요건을 준수하는 클라우드에 대한 수요로 인해 꾸준한 성장이 나타나고 있습니다. 기업들은 EU 역내에서 텔레메트리를 호스팅하고 ISO 27001 준수를 입증할 수 있는 공급업체를 우선적으로 선정하도록 조달 정책을 조정하고 있습니다. 예산 주기에는 여전히 신중한 태도가 유지되고 있지만, 계약의 지속적인 갱신으로 인해 예측 가능한 성장세가 유지되고 있습니다. 남미, 중동 및 아프리카에서는 모바일 광대역 보급률이 상승하고, 다국적 기업들이 계열사 전체에 걸쳐 표준화된 정책을 도입함에 따라 새로운 수요가 나타나고 있습니다. 지역 통신 사업자들의 역량 강화가 매니지드 모빌리티 서비스 시장의 규모를 더욱 확대시키고 있습니다.
기타 혜택:
- 엑셀 형식의 시장 예측(ME) 시트
- 3개월간의 애널리스트 지원
자주 묻는 질문
목차
제1장 소개
제2장 조사 방법
제3장 주요 요약
제4장 시장 구도
제5장 시장 규모와 성장 예측
제6장 경쟁 구도
제7장 시장 기회와 향후 전망
KSM 26.09.02According to Mordor Intelligence, the managed mobility services market size is expected to grow from USD 7.61 billion in 2025 to USD 9.5 billion in 2026 and is forecast to reach USD 28.84 billion by 2031 at 24.86% CAGR over 2026-2031.
This report is Segmented by Function (Mobile Device Management, Mobile Application Management, and More), Deployment Model (Cloud-Based and On-Premises), Organization Size (Large Enterprises and Small and Medium-Sized Enterprises), End-User Industry (IT and Telecom, BFSI, Healthcare, and More), and Geography. The Market Forecasts are Provided in Terms of Value (USD).
Global Managed Mobility Services Market Trends and Insights
BYOD proliferation and hybrid work normalization
Firms now manage unprecedented endpoint diversity because 80% of employees access corporate data from personal devices, a scenario that stretches internal IT teams beyond practical limits. Cyber-risks rise when unmanaged smartphones and tablets handle sensitive files, so enterprises seek external specialists able to impose policy uniformity without limiting user freedom. Managed mobility services market vendors respond with containerization and real-time threat detection that secure data in motion and at rest. Demand rises fastest among knowledge-intensive industries where productivity gains offset device heterogeneity. Service providers that can blend security, user experience, and regulatory compliance stand to win large multiyear contracts as hybrid work policies solidify.
Outsourcing of IT and mobility lifecycle to cut TCO
Budget ownership has shifted from capital to operating expense, making predictable subscription models attractive. Comparative studies show per-device support costs drop 30% when lifecycle tasks move to a multi-tenant provider that leverages automation and scale. Outsourcing frees overstretched IT teams for strategic digital programs while giving executives uniform dashboards for usage, compliance, and spend. The managed mobility services market therefore grows rapidly among mid-market companies that lack mobility specialists. Vendors win deals when they can prove measurable savings, rapid onboarding, and SLA-based quality metrics that outclass in-house alternatives.
Perceived loss of operational control and cost visibility
Executives hesitate to hand key mobility functions to third parties when budget accountability and live performance data appear opaque. Concerns grow when variable fees, custom reporting surcharges, or vendor lock-in clauses come to light during contract negotiations. Providers now counter by exposing granular dashboards, flexible exit options, and benchmark pricing to rebuild trust. Transparent governance frameworks and co-managed models help sustain momentum in the managed mobility services market even among risk-averse organizations.
Other drivers and restraints analyzed in the detailed report include:
- Rapid cloud adoption enabling scalable MMS delivery
- Need for unified security and compliance across endpoints
- Integration complexity with legacy infrastructure
For complete list of drivers and restraints, kindly check the Table Of Contents.
Segment Analysis
Mobile device management delivered 61.98% of the managed mobility services market share in 2025 because enterprises initially prioritized uniform policy enforcement, asset tracking, and remote wipe capabilities across smartphones, tablets, and rugged endpoints. Comprehensive control over firmware updates and encryption status made the device layer an indispensable foundation for compliance audits and incident response. However, the segment's expansion rate now lags more agile application-centric options as organizations refine security to the data layer.
Mobile application management is forecast to post a 26.64% CAGR, the strongest among functional categories, as containerization separates corporate and personal contexts on BYOD hardware without intrusive full-device controls. Healthcare providers adopt app-level management to safeguard patient records while permitting clinicians to use personal phones, and financial institutions deploy secure app wrappers for mobile banking advisors. The shift encourages service vendors to bundle device, app, and content modules so clients avoid multiple contracts. Such convergence keeps the managed mobility services market adaptable to evolving endpoint threats and workforce expectations.
Cloud solutions held 68.15% of managed mobility services market size in 2025 and they will maintain momentum with a 26.92% CAGR as enterprises seek elastic capacity, uniform policy propagation, and rapid feature rollout. Multi-tenant architectures offer economies of scale for patch distribution, analytics processing, and compliance reporting that on-premises stacks cannot match. CIOs also value geographic redundancy delivered through hyperscale data centers that satisfy uptime commitments without capital expenditure.
On-premises deployments persist in defense, public sector, and heavily regulated utilities that require data residency or air-gapped operations. Even within those verticals, hybrid models emerge where core identity stores remain on site but device telemetry and AI analytics reside in the cloud. Service providers therefore invest in flexible architectures with connectors that move workloads seamlessly across environments. This approach keeps their addressable universe broad as sovereignty rules evolve, reinforcing the managed mobility services market as a pragmatic pathway to unified endpoint oversight.
Complete Report Scope:
- By Function
- Mobile Device Management
- Mobile Application Management
- Mobile Security Management
- Support and Maintenance
- By Deployment Model
- Cloud-based
- On-premises
- By Organization Size
- Large Enterprises
- Small and Medium-Sized Enterprises
- By End-user Industry
- IT and Telecom
- BFSI
- Healthcare
- Manufacturing
- Retail and E-commerce
- Education
- Government and Public Sector
- By Geography
- North America
- United States
- Canada
- Mexico
- South America
- Brazil
- Argentina
- Rest of South America
- Europe
- Germany
- United Kingdom
- France
- Italy
- Spain
- Rest of Europe
- Asia-Pacific
- China
- Japan
- South Korea
- India
- ASEAN
- Rest of Asia-Pacific
- Middle East and Africa
- Middle East
- Saudi Arabia
- United Arab Emirates
- Turkey
- Rest of Middle East
- Africa
- South Africa
- Nigeria
- Rest of Africa
- Middle East
- North America
Geography Analysis
North America retained 39.35% share in 2025 because early BYOD acceptance, mature cloud adoption, and stringent privacy rules together encouraged investment in full-featured managed programs. Enterprises routinely integrate mobile threat defense, secure connectivity, and analytics within unified contracts, raising average deal values. Public sector demand also rises as agencies modernize service delivery while satisfying FedRAMP and CJIS mandates, all of which magnify regional revenue pools for the managed mobility services market.
Asia-Pacific will advance at a 26.21% CAGR, the fastest worldwide, underpinned by industrial digitalization, government smart city agendas, and multifaceted e-commerce ecosystems. China's domestic cloud champions bundle mobility services with 5G private networks, while India's IT service integrators extend global best practices to local SMEs eager for remote support. ASEAN nations invest in workforce mobility to streamline tourism border checks, logistics corridors, and financial inclusion programs that rely on robust endpoint security. These varied deployments deepen regional expertise and attract fresh capital into the managed mobility services market.
Europe records steady growth due to GDPR enforcement, digital identity schemes, and demand for sovereignty-compliant clouds. Enterprises adjust procurement to favor providers that host telemetry within the bloc and can certify ISO 27001 compliance. Although budget cycles remain cautious, repeat contract renewals sustain predictable momentum. South America and the Middle East and Africa exhibit emerging demand as mobile broadband penetration climbs and multinational firms roll out standardized policies across affiliates. Capacity building by regional telecoms further enlarges the managed mobility services market footprint.
- AT&T Inc.
- Fujitsu Limited
- Kyndryl Holdings, Inc.
- Wipro Limited
- Orange S.A.
- Telefonica S.A.
- Samsung Electronics Co., Ltd.
- Hewlett Packard Enterprise Company
- Vodafone Group Plc
- Microsoft Corporation
- Tech Mahindra Limited
- Accenture plc
- International Business Machines Corporation
- Deutsche Telekom AG
- Verizon Communications Inc.
- Tata Consultancy Services Limited
- Infosys Limited
- DXC Technology Company
- Calero-MDSL, LLC
- Tangoe, Inc.
- SOTI Inc.
- Stratix Corporation
- Brightfin, LLC
- DMI (Digital Management, LLC)
Additional Benefits:
- The market estimate (ME) sheet in Excel format
- 3 months of analyst support
TABLE OF CONTENTS
1 INTRODUCTION
- 1.1 Study Assumptions and Market Definition
- 1.2 Scope of the Study
2 RESEARCH METHODOLOGY
3 EXECUTIVE SUMMARY
4 MARKET LANDSCAPE
- 4.1 Market Overview
- 4.2 Market Drivers
- 4.2.1 BYOD proliferation and hybrid-work normalization
- 4.2.2 Outsourcing of IT and mobility lifecycle to cut TCO
- 4.2.3 Rapid cloud adoption enabling scalable MMS delivery
- 4.2.4 Need for unified security and compliance across endpoints
- 4.2.5 eSIM/iSIM and remote SIM-OTA fueling zero-touch global fleets
- 4.2.6 AI-driven predictive support slashing device downtime
- 4.3 Market Restraints
- 4.3.1 Perceived loss of operational control and cost visibility
- 4.3.2 Integration complexity with legacy infrastructure
- 4.3.3 Rising SLA penalties from customization and high-touch support
- 4.3.4 Shortage of skilled mobility professionals
- 4.4 Industry Value Chain Analysis
- 4.5 Regulatory Landscape
- 4.6 Technological Outlook
- 4.7 Porter's Five Forces Analysis
- 4.7.1 Bargaining Power of Suppliers
- 4.7.2 Bargaining Power of Buyers/Consumers
- 4.7.3 Threat of New Entrants
- 4.7.4 Intensity of Competitive Rivalry
- 4.7.5 Threat of Substitutes
5 MARKET SIZE AND GROWTH FORECASTS (VALUE)
- 5.1 By Function
- 5.1.1 Mobile Device Management
- 5.1.2 Mobile Application Management
- 5.1.3 Mobile Security Management
- 5.1.4 Support and Maintenance
- 5.2 By Deployment Model
- 5.2.1 Cloud-based
- 5.2.2 On-premises
- 5.3 By Organization Size
- 5.3.1 Large Enterprises
- 5.3.2 Small and Medium-Sized Enterprises
- 5.4 By End-user Industry
- 5.4.1 IT and Telecom
- 5.4.2 BFSI
- 5.4.3 Healthcare
- 5.4.4 Manufacturing
- 5.4.5 Retail and E-commerce
- 5.4.6 Education
- 5.4.7 Government and Public Sector
- 5.5 By Geography
- 5.5.1 North America
- 5.5.1.1 United States
- 5.5.1.2 Canada
- 5.5.1.3 Mexico
- 5.5.2 South America
- 5.5.2.1 Brazil
- 5.5.2.2 Argentina
- 5.5.2.3 Rest of South America
- 5.5.3 Europe
- 5.5.3.1 Germany
- 5.5.3.2 United Kingdom
- 5.5.3.3 France
- 5.5.3.4 Italy
- 5.5.3.5 Spain
- 5.5.3.6 Rest of Europe
- 5.5.4 Asia-Pacific
- 5.5.4.1 China
- 5.5.4.2 Japan
- 5.5.4.3 South Korea
- 5.5.4.4 India
- 5.5.4.5 ASEAN
- 5.5.4.6 Rest of Asia-Pacific
- 5.5.5 Middle East and Africa
- 5.5.5.1 Middle East
- 5.5.5.1.1 Saudi Arabia
- 5.5.5.1.2 United Arab Emirates
- 5.5.5.1.3 Turkey
- 5.5.5.1.4 Rest of Middle East
- 5.5.5.2 Africa
- 5.5.5.2.1 South Africa
- 5.5.5.2.2 Nigeria
- 5.5.5.2.3 Rest of Africa
- 5.5.5.1 Middle East
- 5.5.1 North America
6 COMPETITIVE LANDSCAPE
- 6.1 Market Concentration Analysis
- 6.2 Strategic Moves (MandA, Partnerships, Product Launches)
- 6.3 Market Share Analysis
- 6.4 Company Profiles (includes Global overview, Market-level overview, Core Segments, Financials as available, Strategic Information, Market Rank/Share, Products and Services, Recent Developments)
- 6.4.1 AT&T Inc.
- 6.4.2 Fujitsu Limited
- 6.4.3 Kyndryl Holdings, Inc.
- 6.4.4 Wipro Limited
- 6.4.5 Orange S.A.
- 6.4.6 Telefonica S.A.
- 6.4.7 Samsung Electronics Co., Ltd.
- 6.4.8 Hewlett Packard Enterprise Company
- 6.4.9 Vodafone Group Plc
- 6.4.10 Microsoft Corporation
- 6.4.11 Tech Mahindra Limited
- 6.4.12 Accenture plc
- 6.4.13 International Business Machines Corporation
- 6.4.14 Deutsche Telekom AG
- 6.4.15 Verizon Communications Inc.
- 6.4.16 Tata Consultancy Services Limited
- 6.4.17 Infosys Limited
- 6.4.18 DXC Technology Company
- 6.4.19 Calero-MDSL, LLC
- 6.4.20 Tangoe, Inc.
- 6.4.21 SOTI Inc.
- 6.4.22 Stratix Corporation
- 6.4.23 Brightfin, LLC
- 6.4.24 DMI (Digital Management, LLC)
7 MARKET OPPORTUNITIES AND FUTURE OUTLOOK
- 7.1 White-space and Unmet-need Assessment


