

|
시장보고서
상품코드
2120834
태양광발전(PV) 시장 : 시장 점유율 분석, 업계 동향 및 통계, 성장 예측(2026-2031년)Solar Photovoltaic (PV) - Market Share Analysis, Industry Trends & Statistics, Growth Forecasts (2026 - 2031) |
||||||
 Mordor Intelligence
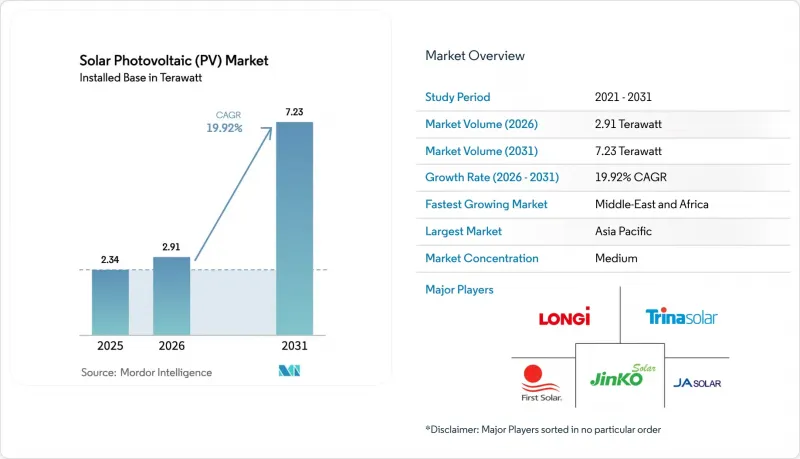
Mordor Intelligence에 의하면, 태양광발전 시장 설치 용량은 2025년에 2.34 테라왓트로 평가되었고, 2026년에 2.91 테라왓트로 추정되고, 2031년까지 7.23 테라왓트에 이를 것으로 예측되며, 2026-2031년 CAGR 19.92%로 성장할 전망입니다.
본 보고서는 기술별(단결정 실리콘, 다결정 실리콘, 박막, 탠덤/페로브스카이트), 설치 형태별(지상 설치형, 옥상/BIPV, 수상 설치형), 최종 사용자별(주거용, 상업 및 산업용, 유틸리티 규모의 IPP), 지역별(북미, 유럽,아시아태평양, 남미, 중동 및 아프리카)로 분류되어 있습니다. 시장 전망은 출하량(GW) 기준으로 제시되어 있습니다.
세계의 태양광(PV) 시장 동향 및 인사이트
모듈 평균 판매 가격(ASP) 하락으로 그리드 패리티가 달성되는 지역 확대
태양광 시장의 현물 가격은 2025년 7월 FOB 중국 기준 1와트피크당 0.082달러까지 하락하였으며, 2024년 초 대비 32% 하락했습니다. 이러한 하락으로 그리드 패리티가 적용되는 국가는 142개국으로 확대되었으며, 이들 국가에서는 유틸리티 규모의 태양광 발전이 석탄 및 가스 발전보다 15-25% 저렴해졌습니다. 2025년 출하량의 68%를 상위 5개 공급업체가 차지하면서 시장 통합이 가속화되었습니다. 유틸리티 규모 프로젝트에서는 21%, 옥상 시스템에서는 19%라는 규제상 효율 기준이 성능 기준을 보장하고 있습니다. 이에 반해, 개발사들은 이익률을 회복하기 위해 모듈 생산과 EPC 서비스를 통합하는 움직임을 보였습니다. 선물 가격 곡선에 따르면, N형 TOPCon 기술이 PERC 기술과 제조 비용 면에서 동등해짐에 따라 2027년까지 10-15%의 추가 하락이 예상됩니다.
IRA에 힘입은 미국 내 태양광 발전 제조의 국내 복귀
모듈의 경우 1와트 DC당 0.07달러, 셀의 경우 1와트 DC당 0.04달러의 섹션 45X 세액 공제를 통해 2025년까지 총 100억 달러 규모의 공장 건설 계획이 발표되었습니다. 퍼스트 솔라의 루이지애나주 공장은 2026년에 3.5GW의 박막 생산 능력을 추가할 예정입니다. 2024년 국내 모듈 생산량은 12GW(DC)에 달했으나, 국내 수요의 불과 8%만을 충족시켰습니다. 재무부의 지침에 따르면, 30%의 투자 세액 공제를 전액 받기 위해서는 2027년까지 미국산 원가 비율을 55%로 끌어올려야 합니다. 수직 통합형 공급망을 통해 리드타임은 8주로 단축되었으며, 동부 해안 프로젝트의 운송 비용은 40% 절감되었습니다.
재생에너지 보급률이 높은 지역의 송전망 혼잡 및 출력 제한 위험
캘리포니아주에서는 2023년에 260만 MWh의 재생에너지 발전이 억제되었습니다. 이는 38만 5,000가구의 연간 소비량에 해당합니다. 저녁 시간대의 출력 변동으로 인해 가스 피크 발전소의 사이클 비용이 1MWh당 15-20달러 증가했습니다. ERCOT는 서부 텍사스의 태양광 발전량이 송전 용량을 초과함에 따라 2028년까지 매년 400만 MWh의 발전 억제가 발생할 것으로 예측했습니다. 독일은 2024년에 출력 제한을 받은 발전 사업자에게 보상으로 12억 유로를 지급했습니다. 남호주주는 주택용 태양광 발전 시스템에 대해 동적 송전 제한을 부과하여 가정의 전력 판매 수익을 12-18% 감소시켰습니다. 미국의 계통 연계 대기 용량이 2,000GW를 초과함에 따라 송전망 확충 일정이 10년에 달하고 있으며, 이는 개발업자들을 ‘계량기 뒤’ 설치로 몰아넣어 태양광 발전 시장에 중요한 과제로 대두되고 있습니다.
부문별 분석
2025년, 단결정 실리콘은 태양광 패널 시장 점유율 86.1%를 유지했으며, 셀 효율이 27.81%에 도달함으로써 태양광(PV) 업계에서의 주도적 지위를 더욱 공고히 했습니다. 첨단 탠덤형 및 페로브스카이트형 모듈의 태양광 패널 시장 규모는 2031년까지 연평균 성장률(CAGR) 31.1%로 확대될 것으로 예측됩니다. 이는 Oxford PV사가 상용 제품에서 24.5%의 효율을 달성하고 10,000시간의 안정성이라는 이정표를 세운 것을 반영한 것입니다. 다결정 실리콘 시장 점유율은 8.2%로 하락했습니다. 이는 각 제조업체들이 동등한 비용으로 성능을 1.5-2퍼센트 포인트 향상시키는 N형 TOPCon 및 헤테로접합 라인으로의 전환을 추진했기 때문입니다.
2025년에는 주요 기업들의 연구개발(R&D) 투자액이 12억 달러를 넘어섰으며, 600W 이상의 패널 정격을 실현하는 양면 수광형, 하프컷, 멀티 버스바 레이아웃에 초점이 맞추어졌습니다. 박막 카드뮴 텔루륨(CdTe)은 4.9%의 시장 점유율을 유지했습니다. 이는 온도 계수가 낮아 연간 발전량을 3-5% 향상시키기 때문에 고온 기후의 전력 사업용 부지에서 선호되고 있습니다. 자금 조달의 확실성은 IEC 61215 및 IEC 61730 준수에 달려 있으며, 이는 대출 조건의 기반이 되어 부채 마진을 최대 50베이시스포인트까지 낮춥니다.
지역별 분석
아시아태평양은 중국의 210 GW 신규 프로젝트와 인도의 85GW 누적 설치 실적이 견인하여, 2025년 말 기준 전 세계 설치 용량의 64.3%를 차지했습니다. 일본에서는 고정가격매입제도(FIT)의 단계적 인하로 인해 주택용 태양광 발전의 성장세가 둔화되었지만, LNG 가격 변동이 가격 안정에 대한 관심을 높임에 따라 기업용 전력구매계약(PPA)은 62% 증가했습니다. 아세안(ASEAN) 시장에서는 부채 프리미엄을 30-40 베이시스 포인트 인하한 우대 대출 덕분에 18 GW가 추가되었습니다. 호주의 가정용 보급률은 38%에 달했으나, 재생에너지 비중이 높은 주에서 시행된 동적인 수출 상한제로 인해 자본은 유틸리티 규모의 태양광 발전 및 에너지 저장 시스템으로 이동했습니다.
중동 및 아프리카는 사우디아라비아의 ‘비전 2030’ 로드맵(58.7 GW)과 UAE의 두바이 파크 확장 계획(5GW)에 힘입어 연평균 성장률(CAGR) 21.5%를 나타낼 것으로 전망됩니다. 사우디아라비아의 1.5GW 규모 수다이르 발전소는 1 kWh당 0.0104달러라는 사상 최저 입찰가를 기록했습니다. UAE의 ‘누르 아부다비’는 현재 현지 수요의 10%를 충당하고 있으며, 페르시아만 송전 계통 연계선을 통해 전력도 수출하고 있습니다. 남아프리카공화국은 입찰 6차에서 3.2 GW의 수주를 확정했으나, 송전망 제약으로 인해 1.8 GW의 도입을 연기했습니다. 나이지리아는 2025년에 450 MW 규모의 미니 그리드를 도입하여 280만 명에게 전력을 공급하게 되었습니다.
2025년, 북미는 태양광 발전 시장 설치 용량의 12.8%를 차지했습니다. 미국에서는 32GW가 추가되었으며, 연간 신규 설치량 측면에서 텍사스주가 캘리포니아주를 앞질렀습니다. 캐나다의 청정 전력 세액 공제(30%) 덕분에 앨버타주와 온타리오주에서 총 2.5GW의 도입이 촉진되었습니다. 멕시코에서는 넷 미터링 제도의 전망이 불투명해지면서 주택용 태양광 발전 도입 속도가 둔화되었습니다. 유럽은 9.4%의 점유율을 차지했습니다. 독일은 8.5GW, 스페인은 6.2GW를 도입했으나, 이는 톤당 CO2 가격이 90유로 수준인 탄소 가격의 압박 하에서 이루어진 것이었습니다. 브라질의 분산형 발전 기반은 2025년에 18GW에 달할 전망이며, 잉여 전력 판매에 대한 소매 크레딧은 전액 유지되었습니다.
기타 혜택 :
- 엑셀 형식 시장 예측(ME) 시트
- 3개월간의 애널리스트 지원
자주 묻는 질문
목차
제1장 서론
제2장 조사 방법
제3장 주요 요약
제4장 시장 구도
제5장 시장 규모 및 성장 예측
제6장 경쟁 구도
제7장 시장 기회 및 향후 전망
AJY 26.09.09According to Mordor Intelligence, the solar photovoltaic market size in terms of installed base is projected to be 2.34 Terawatt in 2025, 2.91 Terawatt in 2026, and reach 7.23 Terawatt by 2031, growing at a CAGR of 19.92% from 2026 to 2031.
This report is Segmented by Technology (Monocrystalline-Si, Multicrystalline-Si, Thin-Film, Tandem/Perovskite), Deployment Type (Ground-Mounted, Rooftop/BIPV, Floating PV), End-User (Residential, Commercial and Industrial, Utility-Scale IPPs), and Geography (North America, Europe, Asia-Pacific, South America, Middle East and Africa). The Market Forecasts are Provided in Terms of Volume (GW).
Global Solar Photovoltaic (PV) Market Trends and Insights
Falling Module ASPs Widen Grid-Parity Zones
Spot prices in the Solar PV market dropped to USD 0.082 per watt-peak FOB China in July 2025, a 32% fall from early 2024. The decrease expanded grid-parity to 142 nations where utility-scale solar now undercuts coal and gas generation by 15-25%. Market consolidation accelerated as the five largest suppliers controlled 68% of 2025 shipments. Regulatory efficiency thresholds of 21% for utility projects and 19% for rooftop systems safeguard performance standards. Developers responded by integrating module production and EPC services to recapture margin. Forward price curves suggest another 10-15% decline by 2027 as N-type TOPCon technology achieves manufacturing parity with PERC.
IRA-Driven On-Shoring of PV Manufacturing in the U.S.
Section 45X credits of USD 0.07 per watt-dc for modules and USD 0.04 per watt-dc for cells spurred USD 10 billion of factory announcements through 2025. First Solar's Louisiana plant adds 3.5 GW of thin-film output in 2026. Domestic module production reached 12 GW dc in 2024, yet satisfied only 8% of local demand. Treasury guidance now requires 55% U.S. cost content by 2027 to qualify for the full 30% investment tax credit. Vertically integrated supply chains cut lead times to eight weeks and slashed freight costs by 40% for East Coast projects.
Grid-Congestion & Curtailment Risks in High-Penetration Regions
California curtailed 2.6 million MWh of renewable electricity in 2023, equal to 385,000 homes' annual use. Evening ramps increase gas-peaker cycling costs by USD 15-20 per MWh. ERCOT foresees 4 million MWh of curtailment each year by 2028 as West-Texas solar surpasses transmission capacity. Germany paid EUR 1.2 billion to compensate curtailed generators in 2024. South Australia imposed dynamic export limits on rooftop systems, cutting household feed-in revenue 12-18%. U.S. interconnection queues above 2,000 GW stretch upgrade timelines to a decade, posing a key challenge for the Solar photovoltaic PV market by pushing developers toward behind-the-meter installations.
Other drivers and restraints analyzed in the detailed report include:
- AI-Enabled Solar Forecasting Cuts Balancing Costs
- Demand From Green-Hydrogen Electrolyzer Projects
- Rapid Polysilicon Price Swings Squeeze Producer Margins
For complete list of drivers and restraints, kindly check the Table Of Contents.
Segment Analysis
Monocrystalline silicon maintained 86.1% solar panels market share in 2025 as cell efficiencies reached 27.81%, reinforcing its leadership in the Solar PV industry. The solar panels market size for advanced tandem and perovskite modules is forecast to grow at 31.1% CAGR through 2031, reflecting Oxford PV's 24.5% commercial products and 10,000-hour stability milestones. Multicrystalline declined to 8.2% as producers migrated toward N-type TOPCon and heterojunction lines that lift performance by 1.5-2 percentage points at comparable costs.
Investment in R&D topped USD 1.2 billion among leading firms in 2025, focusing on bifacial, half-cut, and multi-bus-bar layouts that push 600 W-plus panel ratings. Thin-film cadmium-telluride retained a 4.9% share, favored for hot-climate utility sites where lower temperature coefficients elevate annual energy yield 3-5%. Bankability hinges on IEC 61215 and IEC 61730 compliance, which underpins financing terms and lowers debt margins by up to 50 basis points.
Complete Report Scope:
- By Technology
- Monocrystalline-Si
- Multicrystalline-Si
- Thin-film (CdTe, CIGS, a-Si)
- Tandem/Perovskite
- By Deployment Type
- Ground-mounted
- Rooftop/Building-Integrated (BIPV)
- Floating PV
- By End-User
- Residential
- Commercial and Industrial
- Utility-scale IPPs
- By Geography
- North America
- United States
- Canada
- Mexico
- Europe
- Germany
- United Kingdom
- France
- Italy
- Russia
- Rest of Europe
- Asia-Pacifc
- China
- India
- Japan
- South Korea
- ASEAN Countries
- Australia
- Rest of Asia-Pacifc
- South America
- Brazil
- Argentina
- Rest of South America
- Middle East and Africa
- Saudi Arabia
- United Arab Emirates
- South Africa
- Nigeria
- Rest of Middle East and Africa
- North America
Geography Analysis
Asia-Pacific closed 2025 with 64.3% of global installed capacity, driven by China's 210 GW of new projects and India's 85 GW cumulative base. Japan's feed-in tariff step-down slowed rooftop growth, but corporate PPAs advanced 62% as LNG volatility spurred interest in price stability. ASEAN markets added 18 GW thanks to concessional finance that trimmed debt premiums 30-40 basis points. Australia's household penetration reached 38%, yet dynamic export caps in high-renewables states redirected capital toward utility-scale solar-plus-storage.
The Middle East and Africa are set for a 21.5% CAGR, supported by Saudi Arabia's 58.7 GW Vision 2030 roadmap and the UAE's 5 GW Dubai park expansion. Saudi Arabia's 1.5 GW Sudair plant achieved a record USD 0.0104 per kWh bid price. The UAE's Noor Abu Dhabi now covers 10% of local demand and exports into the Gulf interconnector. South Africa awarded 3.2 GW in Bid Window 6 but postponed 1.8 GW due to grid constraints. Nigeria deployed 450 MW of mini-grids in 2025, extending service to 2.8 million people.
North America accounted for 12.8% of the solar photovoltaic market capacity in 2025. The United States added 32 GW, with Texas surpassing California in annual additions. Canada's 30% clean-electricity tax credit stimulated 2.5 GW across Alberta and Ontario. Mexican rooftop deployment slowed amid net-metering uncertainty. Europe captured a 9.4% share; Germany installed 8.5 GW and Spain 6.2 GW under carbon-price pressures near EUR 90 per t CO2. Brazil's distributed-generation base hit 18 GW in 2025, retaining full retail credit for exports.
- LONGi Green Energy Technology Co. Ltd.
- Trina Solar Co. Ltd.
- JinkoSolar Holding Co. Ltd.
- JA Solar Technology Co. Ltd.
- First Solar Inc.
- Canadian Solar Inc.
- Hanwha Q Cells Co. Ltd.
- SunPower Corporation
- Risen Energy Co. Ltd.
- Sharp Corporation
- Suntech Power Co. Ltd.
- REC Solar Holdings AS
- GCL System Integration Technology
- Maxeon Solar Technologies
- Yingli Solar
- Adani Solar
- Axitec Energy GmbH
- FuturaSun Srl
- Waaree Energies Ltd.
- Meyer Burger Technology AG
Additional Benefits:
- The market estimate (ME) sheet in Excel format
- 3 months of analyst support
TABLE OF CONTENTS
1 Introduction
- 1.1 Study Assumptions & Market Definition
- 1.2 Scope of the Study
2 Research Methodology
3 Executive Summary
4 Market Landscape
- 4.1 Market Overview
- 4.2 Market Drivers
- 4.2.1 Falling module ASPs widen grid-parity zones
- 4.2.2 IRA-driven on-shoring of PV manufacturing in the U.S.
- 4.2.3 AI-enabled solar forecasting cuts balancing costs
- 4.2.4 Demand from green-hydrogen electrolyzer projects
- 4.2.5 Corporate 24/7 clean-power PPA commitments
- 4.2.6 Agrivoltaics unlocks dual-land use revenues
- 4.3 Market Restraints
- 4.3.1 Grid-congestion & curtailment risks in high-penetration regions
- 4.3.2 Rapid polysilicon price swings squeeze producer margins
- 4.3.3 Anti-dumping trade actions fragment supply chains
- 4.3.4 Rising rooftop-fire regulations add balance-of-system (BOS) cost
- 4.4 Supply-Chain Analysis
- 4.5 Regulatory Landscape
- 4.6 Technological Outlook
- 4.7 Porter's Five Forces
- 4.7.1 Bargaining Power of Suppliers
- 4.7.2 Bargaining Power of Consumers
- 4.7.3 Threat of New Entrants
- 4.7.4 Threat of Substitutes
- 4.7.5 Intensity of Competitive Rivalry
- 4.8 Installed-Capacity and Shipment Trends
- 4.9 Pricing and LCOE Trends
- 4.10 Key Projects Pipeline
5 Market Size & Growth Forecasts
- 5.1 By Technology
- 5.1.1 Monocrystalline-Si
- 5.1.2 Multicrystalline-Si
- 5.1.3 Thin-film (CdTe, CIGS, a-Si)
- 5.1.4 Tandem/Perovskite
- 5.2 By Deployment Type
- 5.2.1 Ground-mounted
- 5.2.2 Rooftop/Building-Integrated (BIPV)
- 5.2.3 Floating PV
- 5.3 By End-User
- 5.3.1 Residential
- 5.3.2 Commercial and Industrial
- 5.3.3 Utility-scale IPPs
- 5.4 By Geography
- 5.4.1 North America
- 5.4.1.1 United States
- 5.4.1.2 Canada
- 5.4.1.3 Mexico
- 5.4.2 Europe
- 5.4.2.1 Germany
- 5.4.2.2 United Kingdom
- 5.4.2.3 France
- 5.4.2.4 Italy
- 5.4.2.5 Russia
- 5.4.2.6 Rest of Europe
- 5.4.3 Asia-Pacifc
- 5.4.3.1 China
- 5.4.3.2 India
- 5.4.3.3 Japan
- 5.4.3.4 South Korea
- 5.4.3.5 ASEAN Countries
- 5.4.3.6 Australia
- 5.4.3.7 Rest of Asia-Pacifc
- 5.4.4 South America
- 5.4.4.1 Brazil
- 5.4.4.2 Argentina
- 5.4.4.3 Rest of South America
- 5.4.5 Middle East and Africa
- 5.4.5.1 Saudi Arabia
- 5.4.5.2 United Arab Emirates
- 5.4.5.3 South Africa
- 5.4.5.4 Nigeria
- 5.4.5.5 Rest of Middle East and Africa
- 5.4.1 North America
6 Competitive Landscape
- 6.1 Market Concentration
- 6.2 Strategic Moves (M&A, Partnerships, PPAs)
- 6.3 Market Share Analysis (Market Rank/Share for key companies)
- 6.4 Company Profiles (includes Global level Overview, Market level overview, Core Segments, Financials as available, Strategic Information, Products & Services, and Recent Developments)
- 6.4.1 LONGi Green Energy Technology Co. Ltd.
- 6.4.2 Trina Solar Co. Ltd.
- 6.4.3 JinkoSolar Holding Co. Ltd.
- 6.4.4 JA Solar Technology Co. Ltd.
- 6.4.5 First Solar Inc.
- 6.4.6 Canadian Solar Inc.
- 6.4.7 Hanwha Q Cells Co. Ltd.
- 6.4.8 SunPower Corporation
- 6.4.9 Risen Energy Co. Ltd.
- 6.4.10 Sharp Corporation
- 6.4.11 Suntech Power Co. Ltd.
- 6.4.12 REC Solar Holdings AS
- 6.4.13 GCL System Integration Technology
- 6.4.14 Maxeon Solar Technologies
- 6.4.15 Yingli Solar
- 6.4.16 Adani Solar
- 6.4.17 Axitec Energy GmbH
- 6.4.18 FuturaSun Srl
- 6.4.19 Waaree Energies Ltd.
- 6.4.20 Meyer Burger Technology AG
7 Market Opportunities & Future Outlook
- 7.1 White-space & Unmet-need Assessment


