

|
시장보고서
상품코드
2121383
유전자 발현 분석 : 시장 점유율 분석, 업계 동향과 통계, 성장 예측(2026-2031년)Gene Expression Analysis - Market Share Analysis, Industry Trends & Statistics, Growth Forecasts (2026 - 2031) |
||||||
 Mordor Intelligence
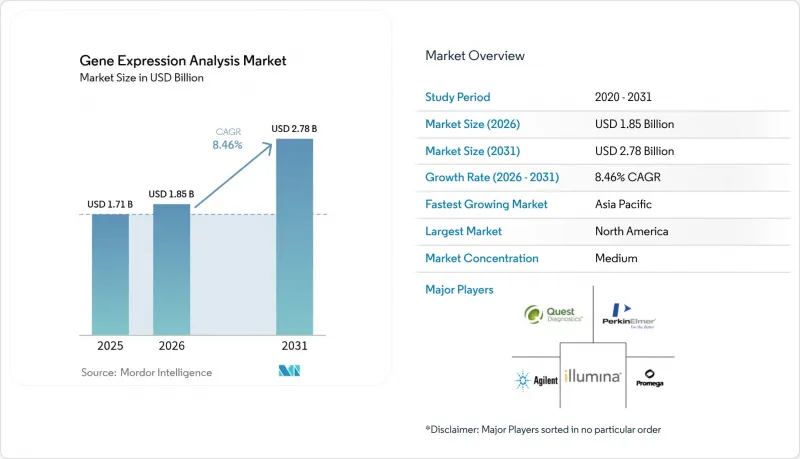
Mordor Intelligence에 따르면 유전자 발현 분석 시장 규모는 2025년에 17억 1,000만 달러로 평가되며, 2026년 18억 5,000만 달러에서 2031년까지 27억 8,000만 달러에 달할 것으로 예측되고 있으며, 예측 기간(2026-2031년)에 CAGR은 8.46%에 달할 전망입니다.
이 보고서에서는 업계를 기술별(중합효소연쇄반응(PCR), 정량 PCR 등),제품 유형별(기기 등), 용도별(종양 등), 최종사용자별(제약·바이오기술 기업 등), 지역별(북미, 유럽, 아시아태평양, 중동 및 아프리카, 남미)로 분류하고 있습니다. 시장 예측은 금액(달러) 기준으로 제시되어 있습니다.
전 세계 유전자 발현 분석 시장의 동향 및 인사이트
NGS·qPCR 플랫폼의 급속한 기술 발전
차세대 시퀀싱(NGS)은 현재 텔로미어에서 텔로미어까지의 어셈블리가 가능해졌으며, 쇼트 리드 시스템으로는 검출할 수 없었던 구조적 변이 및 후성유전학적 마커를 밝혀내고 있습니다. 옥스포드 나노포어(Oxford Nanopore)의 롱 리드 장치는 증폭 공정을 거치지 않고 직접 RNA 데이터를 제공하며, AI를 활용한 염기 판정을 통해 오류율과 계산 부하를 줄이고 있습니다. 정량 PCR과의 통합을 통해 확인 작업의 워크플로가 단축되고, 총 처리 능력이 향상되고 있습니다. QIAGEN의 AI를 활용한 ‘Ingenuity Pathway Analysis’는 원시 데이터를 생물학적 경로로 변환하여, 임상의가 몇 시간 이내에 해석할 수 있도록 합니다. 이러한 발전들이 결합되어 소요 시간이 단축되고, 일상적인 진단에서의 도입이 확대되고 있습니다.
게놈 연구에 대한 정부 자금 증액
각국의 국가 프로그램에서는 유전체학을 경쟁력의 원천으로 자리매김하고 있습니다. 미국 국립보건원(NIH)은 2024년, 유전체 데이터를 학습형 헬스케어 시스템에 통합하기 위해 2,700만 달러를 배정했습니다. 인도는 2025년, 특정 집단에 특화된 기준 자료를 작성하기 위해 1만 명의 게놈 염기서열 분석을 완료했습니다. 중국의 ‘인간 게놈 프로젝트 II’ 계획은 세계 인구의 1%에 대한 집단 염기서열 분석을 목표로 하고 있는 반면, 호주의 ‘Genomics Health Futures Mission’은 10년 동안 5억 10만 호주 달러를 예산으로 편성했습니다. 이러한 자금 지원으로 인해 연구의 초점은 기초 과학에서 임상 응용으로 이동하고 있으며, 시퀀싱 능력에 대한 장기적인 수요가 유지되고 있습니다.
첨단 시퀀서의 높은 자본 비용
최첨단 공간 생물학 플랫폼은 대당 100만 달러를 초과하는 경우가 많으며, 추가적인 이미징 모듈과 고성능 컴퓨팅이 필요합니다. 라틴아메리카, 아프리카, 아시아 일부 지역에 위치한 소규모 연구소는 구매를 미루거나 서비스 제공업체에 의존하고 있으며, 그 결과 자금력이 있는 거점에 처리량이 집중되고 있습니다. 일루미나(Illumina)가 제시한 ‘게놈당 200달러’라는 목표는 여전히 멀기만 하여 비용 장벽을 더욱 강화하고 있습니다. 리스 계약은 지불을 분산시키지만, 총 지출을 증가시키고 데이터 파이프라인에 대한 사용자의 통제력을 약화시킵니다.
부문 분석
유전자 발현 분석 시장의 규모를 기술 부문별로 살펴보면, 정량 PCR이 매출의 33.98%를 계속 차지하고 있지만, 공간 전사체학은 타의 추종을 불허하는 14.62%의 CAGR을 기록하고 있습니다. 공간 분석 툴은 조직의 맥락을 유지하며, 벌크 분석에서는 간과되기 쉬운 세포 간 상호작용을 밝혀냅니다. 차세대 시퀀싱은 진단 분야에서 여전히 필수적이지만, 현재는 구조적 변이를 규명하는 롱 리드 화학이 통합되어 있습니다. 디지털 PCR은 절대 정량이 필요한 사용자를 확보하고 있으며, 마이크로어레이는 감소 추세를 보이고 있지만 타겟 패널에서는 여전히 중요한 역할을 수행하고 있습니다.
공간적 기법은 신약 개발 파이프라인을 혁신하고 있습니다. 옥스포드 나노포어(Oxford Nanopore)의 Mk1D MinION은 감염병 집단 발생시 병상에서 시퀀싱을 가능하게 하며, 동사의 ElysION 로봇은 라이브러리 조제를 자동화합니다. 비교 벤치마크에 따르면 10x Genomics사의 Chromium Fixed RNA Profiling 키트는 민감도 측면에서 타사 제품을 앞지르는 반면, 벡톤 디킨슨(Becton Dickinson)사의 Rhapsody 키트는 가성비가 뛰어난 선택지로 자리 잡고 있습니다. 인공지능(AI)을 통해 실행 중인 오류 수정이 감소하고 편의성이 향상되고 있습니다. 이러한 동향들이 맞물려 공간 생물학에 대한 인지도가 높아지면서 유전자 발현 분석 시장 내에서 높은 성장세가 유지되고 있습니다.
연구실이 내부 처리 능력을 초과하는 멀티오믹스 분석을 외부에 위탁함에 따라 서비스 부문은 연평균 성장률(CAGR) 12.78%를 기록하며 유전자 발현 분석 업계 내에서 가장 높은 성장률을 보였습니다. 시약 및 소모품은 2025년 매출의 48.05%를 차지하며, 일상적인 워크플로우에서 핵심적인 역할을 하고 있음을 입증하고 있습니다. 클라우드 기반 바이오인포매틱스 서비스는 데이터 과학자를 고용하지 않고도 신속한 결과를 원하는 병원 및 제약 기업의 후원사를 끌어들이고 있습니다. 위탁 연구 기관(CRO)은 이러한 수요를 흡수하기 위해 단일 세포 분석을 포함한 서비스 메뉴를 확충하고 있습니다.
각 기업은 수익성이 높은 소프트웨어 및 서비스로 사업을 전환하고 있습니다. QIAGEN은 ‘Digital Insights’ 포트폴리오를 확대하여 5개 제품의 출시를 계획하고 있는 반면, BD는 Biosero와 제휴하여 유세포분석과 로봇 공학을 연동했습니다. 플랫폼의 수명이 5년을 초과하게 되면서 장비의 성장세는 둔화되고 있지만, 공간 이미징의 추가 기능을 이용하기 위해서는 여전히 업그레이드가 필요합니다. 로봇을 이용한 처리는 오염 위험을 줄이고 배치 간 품질을 일정하게 유지하므로 검사량을 확대하고 있는 진단 검사실에게 매력적입니다.
지역별 분석
북미는 2025년 매출의 42.95%를 차지하며, 바이오마커 검사의 보험 적용을 의무화하는 보험 제도의 혜택을 받고 있습니다. 미국 국립보건원(NIH)의 유전체학을 활용한 의료 시스템에 대한 투자가 데이터를 임상 워크플로우로 이끌고 있습니다. 2024년 FDA가 8건의 세포·유전자 치료법을 승인한 것은 규제 당국의 수용이 확인되었음을 보여주며, 검사 이용을 촉진하고 있습니다. 캐나다는 정밀 의료 프로그램을 확대하고 있으며, 멕시코는 감염병 시퀀싱에 자금을 투입하고 있지만, 시장이 성숙기에 접어들면서 성장세는 완만해지고 있습니다.
아시아태평양은 연평균 성장률(CAGR) 11.12%로 가장 빠른 성장 궤도를 보이고 있으며, 유전자 발현 분석 시장에서 이 지역의 점유율은 급속히 확대되고 있습니다. 인도는 문화적으로 관련성이 높은 참조 세트를 생성하는 ‘1만 게놈 프로젝트’를 완료했습니다. 중국의 ‘인간 게놈 프로젝트 II’ 제안은 세계 인구의 1%에 대한 집단 시퀀싱을 수행하겠다는 야심을 보여주고 있으며, 일본의 ‘오믹스 브라우저’는 동아시아 게놈에 맞춘 멀티오믹스 툴을 제공하고 있습니다. 호주의 ‘Genomics Health Futures Mission’은 조정상 과제가 있음에도 불구하고 88개 프로젝트에 자금을 지원하고 있습니다. 한국은 AI와 롱 리드 시퀀싱을 결합한 스타트업을 지원하고 있습니다.
유럽에서는 ‘호라이즌(Horizon)’ 연구 공모 및 각국의 헬스케어 예산을 통해 꾸준한 확장을 이어가고 있습니다. 영국 로열 마스덴 병원에서 로봇을 활용한 게놈 검사를 통해 처리 능력이 2배로 증가했고, 오류율이 감소했습니다. 독일과 프랑스는 NGS 종양 패널에 대한 보험 급여 절차를 간소화하고 있습니다. 중동 및 아프리카에서는 민관 협력 유전체 센터 설립이 모색되고 있으며, 사우디아라비아는 QIAGEN사와 양해각서를 체결했습니다. 남미에서는 진전 속도가 완만하지만, 브라질과 아르헨티나는 연구소가 시퀀싱 시약을 합리적인 가격에 구입할 수 있는 국제 공동 연구에 참여하고 있습니다.
기타 혜택:
- 엑셀 형식의 시장 예측(ME) 시트
- 3개월간의 애널리스트 지원
자주 묻는 질문
목차
제1장 서론
제2장 조사 방법
제3장 개요
제4장 시장 구도
제5장 시장 규모와 성장 예측
제6장 경쟁 구도
제7장 시장 기회와 향후 전망
KSA 26.09.04According to Mordor Intelligence, the gene expression analysis market size was valued at USD 1.71 billion in 2025 and estimated to grow from USD 1.85 billion in 2026 to reach USD 2.78 billion by 2031, at a CAGR of 8.46% during the forecast period (2026-2031).
This report Segments the Industry Into by Technology (Polymerase Chain Reaction, Quantitative PCR, and More), Product Type (Instruments, and More), Application (Oncology, and More), End-User (Pharmaceutical and Biotechnology Companies, and More), and Geography (North America, Europe, Asia-Pacific, Middle East and Africa, South America). The Market Forecasts are Provided in Terms of Value (USD).
Global Gene Expression Analysis Market Trends and Insights
Rapid Technological Advancement in NGS & qPCR Platforms
Next-generation sequencing now reaches telomere-to-telomere assemblies that uncover structural variants and epigenetic marks missed by short-read systems. Oxford Nanopore's long-read instruments deliver direct RNA data without amplification steps, while AI-enhanced base-calling lowers error rates and computing needs. Integration with quantitative PCR shortens confirmatory workflows and boosts total throughput. QIAGEN's AI-powered Ingenuity Pathway Analysis converts raw reads into biological pathways that clinicians can interpret within hours. Collectively, these advances cut turnaround times and widen adoption in routine diagnostics.
Increased Government Funding for Genomics
National programs treat genomics as a competitiveness asset. The US National Institutes of Health assigned USD 27 million in 2024 to weave genomic data into learning health systems. India finished sequencing 10,000 genomes in 2025 to create population-specific references. China's Human Genome Project II proposal seeks to sequence 1% of the global population, while Australia's Genomics Health Futures Mission earmarks AUD 500.1 million over ten years. Such funding shifts the focus from discovery science to clinical deployment and sustains long-term demand for sequencing capacity.
High Capital Costs of Advanced Sequencers
Top-tier spatial biology platforms often exceed USD 1 million per unit and require extra imaging modules and high-performance computing. Smaller laboratories in Latin America, Africa, and parts of Asia delay purchases or rely on service providers, which concentrates volume among well-funded hubs. Illumina's target of USD 200 per genome remains distant, reinforcing cost barriers. Leasing agreements spread payments but increase total outlay and reduce user control over data pipelines.
Other drivers and restraints analyzed in the detailed report include:
- Growing Adoption of Precision Medicine
- Integration of Spatial-Omics & Single-Cell Profiling
- Shortage of Skilled Bioinformaticians
For complete list of drivers and restraints, kindly check the Table Of Contents.
Segment Analysis
The gene expression analysis market size for technology segments with quantitative PCR retaining 33.98% revenue while spatial transcriptomics registers an unmatched 14.62% CAGR. Spatial tools preserve tissue context and reveal cell-cell interactions that bulk assays mask. Next-generation sequencing remains essential in diagnostics but now integrates long-read chemistry that resolves structural variants. Digital PCR gains users who need absolute quantification, and microarrays decline yet stay relevant for targeted panels.
Spatial methods reshape discovery pipelines. Oxford Nanopore's Mk1D MinION provides bedside sequencing for infectious disease outbreaks, and its ElysION robot automates library prep. Comparative benchmarks show 10x Genomics' Chromium Fixed RNA Profiling kit outperforming peers on sensitivity, while Becton Dickinson's Rhapsody kit offers budget options. Artificial intelligence reduces run-time error correction, broadening usability. Together these trends elevate spatial biology's profile and sustain high growth inside the gene expression analysis market.
Services posted a 12.78% CAGR, the fastest within the gene expression analysis industry, as labs outsource multi-omics analytics that exceed internal capacity. Reagents and consumables still delivered 48.05% of 2025 revenue, confirming their anchoring role in daily workflows. Cloud-hosted bioinformatics attracts hospitals and pharmaceutical sponsors seeking quick turnaround without hiring data scientists. Contract research organizations expand menu offerings, including single-cell analytics, to tap this demand.
Firms pivot toward higher-margin software and services. QIAGEN expanded its Digital Insights portfolio with five planned launches while BD partnered with Biosero to link flow cytometry and robotics. Instrument growth decelerates since platform life spans now exceed five years, yet upgrades remain necessary for spatial imaging add-ons. Robotic handling lowers contamination risk and keeps batch quality consistent, which appeals to diagnostic labs scaling test volumes.
Complete Report Scope:
- By Technology
- Polymerase Chain Reaction (PCR)
- Quantitative PCR (qPCR)
- Digital PCR (dPCR)
- Next-Generation Sequencing (NGS)
- Microarrays
- Spatial Transcriptomics
- Others
- By Product Type
- Instruments
- Reagents & Consumables
- Services
- By Application
- Oncology
- Genetic Disease Research
- Infectious Disease Diagnostics
- Agriculture & Plant Genomics
- Other Applications
- By End-user
- Pharmaceutical and Biotechnology Companies
- Diagnostic Laboratories
- Academic & Research Centers
- Contract Research Organizations (CROs)
- Hospitals & Clinics
- By Geography
- North America
- United States
- Canada
- Mexico
- Europe
- Germany
- United Kingdom
- France
- Italy
- Spain
- Rest of Europe
- Asia-Pacific
- China
- Japan
- India
- Australia
- South Korea
- Rest of Asia-Pacific
- Middle East & Africa
- GCC
- South Africa
- Rest of Middle East & Africa
- South America
- Brazil
- Argentina
- Rest of South America
- North America
Geography Analysis
North America generated 42.95% of 2025 revenue and benefits from insurance mandates that compel coverage of biomarker tests. The National Institutes of Health investment in genomics-enabled health systems steers data into clinical workflows. FDA approvals of eight cell and gene therapies in 2024 confirm regulatory acceptance and stimulate test utilization. Canada expands precision medicine programs, while Mexico channels funds toward infectious disease sequencing; yet growth moderates as the market approaches maturity.
Asia-Pacific exhibits the fastest trajectory at 11.12% CAGR, and its share of the gene expression analysis market is rising quickly. India completed the 10,000-genome project that yields a culturally relevant reference set. China's Human Genome Project II proposal underlines ambitions to sequence 1% of the global population, and Japan's Omics Browser tailors multi-omics tools to East Asian genomes. Australia's Genomics Health Futures Mission funds 88 projects despite coordination challenges. South Korea backs start-ups that combine AI and long-read sequencing.
Europe maintains steady expansion through Horizon research calls and national healthcare budgets. Robotic genomic testing at the UK's Royal Marsden hospital doubles throughput and lowers errors. Germany and France streamline reimbursement for NGS tumor panels. The Middle East and Africa explore public-private genomics centers, with Saudi Arabia signing memoranda with QIAGEN. South America records slower gains; however, Brazil and Argentina join international collaborations that give laboratories affordable access to sequencing reagents.
- Illumina
- Thermo Fisher Scientific
- QIAGEN
- Agilent Technologies
- Bio-Rad Laboratories
- Roche
- PerkinElmer
- Novogene Co., Ltd.
- Luminex
- Quest Diagnostics
- Promega
- Oxford Nanopore Technologies
- Pacific Bioscience
- Takara Bio
- BGI Genomics Co., Ltd.
- 10x Genomics
- NanoString Technologies Inc.
- Fluidigm
- Genscript
- Merck
Additional Benefits:
- The market estimate (ME) sheet in Excel format
- 3 months of analyst support
TABLE OF CONTENTS
1 Introduction
- 1.1 Study Assumptions & Market Definition
- 1.2 Scope of the Study
2 Research Methodology
3 Executive Summary
4 Market Landscape
- 4.1 Market Overview
- 4.2 Market Drivers
- 4.2.1 Rapid Technological Advancement in NGS & qPCR Platforms
- 4.2.2 Increased Government Funding for Genomics
- 4.2.3 Growing Adoption of Precision Medicine
- 4.2.4 Integration of Spatial-Omics & Single-Cell Profiling
- 4.2.5 AI-Driven Bioinformatics Pipelines
- 4.2.6 Cell & Gene-Therapy Manufacturing QC Demand
- 4.3 Market Restraints
- 4.3.1 High Capital Costs of Advanced Sequencers
- 4.3.2 Shortage of Skilled Bioinformaticians
- 4.3.3 Data-Sovereignty Regulations on Genomic Data
- 4.3.4 Reagent Supply-Chain Fragility (Synthetic Nucleotides)
- 4.4 Porter's Five Forces Analysis
- 4.4.1 Threat of New Entrants
- 4.4.2 Bargaining Power of Buyers
- 4.4.3 Bargaining Power of Suppliers
- 4.4.4 Threat of Substitute Products
- 4.4.5 Intensity of Competitive Rivalry
5 Market Size & Growth Forecasts
- 5.1 By Technology
- 5.1.1 Polymerase Chain Reaction (PCR)
- 5.1.2 Quantitative PCR (qPCR)
- 5.1.3 Digital PCR (dPCR)
- 5.1.4 Next-Generation Sequencing (NGS)
- 5.1.5 Microarrays
- 5.1.6 Spatial Transcriptomics
- 5.1.7 Others
- 5.2 By Product Type
- 5.2.1 Instruments
- 5.2.2 Reagents & Consumables
- 5.2.3 Services
- 5.3 By Application
- 5.3.1 Oncology
- 5.3.2 Genetic Disease Research
- 5.3.3 Infectious Disease Diagnostics
- 5.3.4 Agriculture & Plant Genomics
- 5.3.5 Other Applications
- 5.4 By End-user
- 5.4.1 Pharmaceutical and Biotechnology Companies
- 5.4.2 Diagnostic Laboratories
- 5.4.3 Academic & Research Centers
- 5.4.4 Contract Research Organizations (CROs)
- 5.4.5 Hospitals & Clinics
- 5.5 By Geography
- 5.5.1 North America
- 5.5.1.1 United States
- 5.5.1.2 Canada
- 5.5.1.3 Mexico
- 5.5.2 Europe
- 5.5.2.1 Germany
- 5.5.2.2 United Kingdom
- 5.5.2.3 France
- 5.5.2.4 Italy
- 5.5.2.5 Spain
- 5.5.2.6 Rest of Europe
- 5.5.3 Asia-Pacific
- 5.5.3.1 China
- 5.5.3.2 Japan
- 5.5.3.3 India
- 5.5.3.4 Australia
- 5.5.3.5 South Korea
- 5.5.3.6 Rest of Asia-Pacific
- 5.5.4 Middle East & Africa
- 5.5.4.1 GCC
- 5.5.4.2 South Africa
- 5.5.4.3 Rest of Middle East & Africa
- 5.5.5 South America
- 5.5.5.1 Brazil
- 5.5.5.2 Argentina
- 5.5.5.3 Rest of South America
- 5.5.1 North America
6 Competitive Landscape
- 6.1 Market Concentration
- 6.2 Market Share Analysis
- 6.3 Company Profiles (includes Global level Overview, Market level overview, Core Segments, Financials as available, Strategic Information, Market Rank/Share for key companies, Products & Services, and Recent Developments)
- 6.3.1 Illumina Inc.
- 6.3.2 Thermo Fisher Scientific Inc.
- 6.3.3 QIAGEN N.V.
- 6.3.4 Agilent Technologies
- 6.3.5 Bio-Rad Laboratories Inc.
- 6.3.6 F. Hoffmann-La Roche Ltd
- 6.3.7 PerkinElmer Inc.
- 6.3.8 Novogene Co., Ltd.
- 6.3.9 Luminex Corporation
- 6.3.10 Quest Diagnostics Incorporated
- 6.3.11 Promega Corporation
- 6.3.12 Oxford Nanopore Technologies
- 6.3.13 Pacific Biosciences of California, Inc.
- 6.3.14 Takara Bio Inc.
- 6.3.15 BGI Genomics Co., Ltd.
- 6.3.16 10x Genomics
- 6.3.17 NanoString Technologies Inc.
- 6.3.18 Fluidigm Corporation
- 6.3.19 GenScript Biotech Corporation
- 6.3.20 Merck KGaA
7 Market Opportunities & Future Outlook
- 7.1 White-space & Unmet-need Assessment


