

|
시장보고서
상품코드
2121384
통신 타워 : 시장 점유율 분석, 업계 동향·통계, 성장 예측(2026-2031년)Telecom Towers - Market Share Analysis, Industry Trends & Statistics, Growth Forecasts (2026 - 2031) |
||||||
 Mordor Intelligence
Mordor Intelligence에 따르면 통신 타워 시장 규모는 2025년에 292억 9,000만 달러로 평가되며, 2026년 300억 7,000만 달러에서 2031년까지 343억 달러에 달할 것으로 예측되고 있으며, 예측 기간(2026-2031년)에 CAGR은 2.67%에 달할 전망입니다.
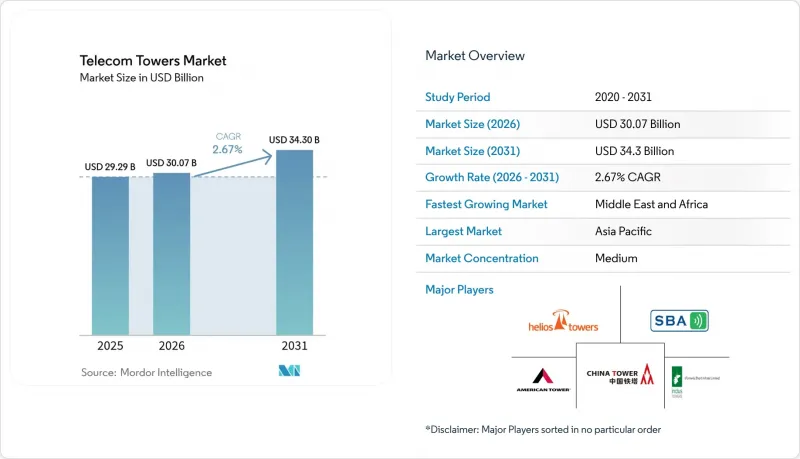
이 보고서는 연료 유형(재생 가능, 비재생 가능), 타워 유형(라티스 타워, 가선식 타워, 모노폴 타워,스텔스 타워), 설치 방식(옥상, 지상), 소유 형태(사업자 소유, 합작 투자, 민간 소유, MNO 전용), 지역(북미, 유럽, 아시아태평양, 중동 및 아프리카, 남미)별로 분류되어 있습니다. 시장 전망은 금액(달러) 기준으로 제시되어 있습니다.
글로벌 통신 타워 시장의 동향 및 인사이트
5G 네트워크 구축이 인프라 집약화를 촉진
통신 사업자는 5G의 저지연 목표를 달성하기 위해, 특히 고대역 밀리미터파 주파수 대역에서 4G에 비해 사이트 밀도를 3배에서 5배까지 높여야 합니다. 라틴아메리카만 해도 2030년까지 5G 연결 건수가 4억 2,500만 건에 달할 것으로 예상되며, 기존의 매크로 타워와 계속 증가하는 스몰 셀이 모두 필요하게 됩니다. 규제 당국도 이에 대응하고 있습니다. 캐나다 방송통신위원회(CRTC)는 통신 사업자가 긴 허가 절차를 거치지 않고도 기존 구조물에 5G 무선 장비를 추가할 수 있도록 설치 규정을 간소화했습니다. 이러한 정책 전환으로 도입 주기가 단축되었으며, 주요 도시 회랑 전역에서 신규 및 업그레이드된 타워 사이트에 대한 수요가 꾸준히 증가하고 있습니다.
모바일 데이터 사용량 증가가 네트워크 용량에 부담을 주고 있습니다.
2024년, 동영상 스트리밍, 클라우드 게임, 기업 모빌리티가 보편화되면서 미국의 무선 데이터 소비량은 36% 증가했습니다. 이에 따라 크라운 캐슬의 임차 기업을 비롯한 통신 사업자들은 도시 지역의 기지국 밀도를 높이고, 지방 지역의 커버리지를 확대할 수밖에 없게 되었습니다. 신흥 시장에서도 합리적인 가격의 스마트폰이 보급됨에 따라 유사한 급증 현상이 나타나고 있습니다. 캐리어 어그리게이션(Carrier Aggregation)이나 매시브 MIMO(Massive MIMO)와 같은 기술을 통해 주파수 대역을 효율적으로 활용할 수는 있지만, 물리적 인프라는 여전히 병목 현상을 일으키고 있습니다. 그 결과, 통신 타워 시장은 완만하지만 지속적인 확장을 이어가고 있으며, 통신 사업자들은 용량 부족 문제를 가속적으로 해결하기 위해 타워 업체에 의존하고 있습니다.
타워 공유의 포화로 인해 성숙 시장의 성장 여지가 제한됨
북미 및 서유럽의 콜로케이션 비율은 타워 1기당 약 2.7개의 테넌트로 유지되고 있으며, 임대 수익의 추가 증가 여지는 제한적입니다. 구조적 제약으로 인해 무게가 증가한 5G 장비로의 업그레이드가 어려워지고 있으며, 수익을 압박하는 고액의 보강 공사가 필요해지고 있습니다. 신흥 국가에서는 신규 테넌트 확보 전망이 여전히 견고하지만, 성숙한 지역에서는 포화 상태가 성장을 억제하고 있으며, 전 세계 통신 타워 시장은 보다 균형 잡힌 확대 패턴으로 전환되고 있습니다.
부문별 분석
2025년에는 매크로셀 사이트를 위한 송전망 전력 및 디젤 발전기를 주축으로, 비재생에너지가 통신 타워 시장 점유율의 72.88%를 차지하며 여전히 주류를 이루고 있습니다. 그러나 통신 사업자들이 원격지의 운영 비용을 대폭 절감할 수 있는 태양광·배터리 하이브리드 시스템으로 전환함에 따라 재생 가능 에너지는 연평균 성장률(CAGR) 5.22%라는 가장 빠른 성장세를 보이고 있습니다. 재생 가능 에너지의 도입은 전력 공급이 불안정하고 디젤 연료의 물류 비용이 높은 지역에서 특히 두드러집니다. 텔레포니카 독일(Telefonica Deutschland)이 도입한 에너지 자급형 5G 타워는 온대 기후에서도 그 실현 가능성을 입증하고 있습니다. 하이브리드 시스템은 이산화탄소 배출량 감축에도 기여하여, 인프라 제공업체가 점점 더 엄격해지는 ESG 요건을 충족할 수 있도록 지원하는 동시에, 그린 파이낸스 자본을 통신 타워 시장으로 유도하고 있습니다.
선도적인 타워 기업은 현재 ‘에너지-어-서비스(EaaS)’ 계약을 패키지화하고 있으며, 이를 통해 이동통신사업자(MNO)는 사이트 관리와 전력 관리를 모두 외부에 위탁할 수 있게 되었습니다. 스마트 컨트롤러와 AI를 활용한 배터리 분석을 통해 소비 곡선이 최적화됨에 따라 통신 타워 업계는 에너지 소비자에서 지역 밀착형 생산자로 전환되고 있습니다. 이러한 진화를 통해 이익률 향상 기회가 확대되고, 수입원이 다각화되며, 지속가능한 연결성 분야에서 이 부문의 역할이 강화되고 있습니다.
라티 타워는 삼각형으로 조립된 강철 구조가 경제적인 비용으로 무거운 멀티밴드 페이로드를 지탱할 수 있으므로 2025년에도 55.62%의 점유율을 유지했습니다. 이들은 아시아태평양과 아프리카의 광활한 농촌 지역에서 광역 커버리지의 기반 역할을 계속하고 있습니다. 한편, 모노폴은 도시 지역에서 연평균 성장률(CAGR) 4.12%라는 가장 높은 성장률을 보이고 있습니다. 그 단일 기둥 형태의 구조는 부지 확보에 필요한 공간을 줄이고 경관상 우려를 해소함으로써, 인허가 절차를 신속하게 진행할 수 있게 해줍니다. 2024년에 도입된 탄소섬유 모노폴은 강철의 12분의 1에 불과한 무게임에도 12배의 인장 강도를 발휘하여, 운송비와 기초 공사비를 절감하는 동시에 자산의 수명을 연장합니다.
스텔스형 및 지지선이 부착된 유형이 제품 라인업을 더욱 풍성하게 하고 있습니다. 스텔스형 솔루션은 역사 지구 내의 구역 규제를 충족하며, 지선 부착형 타워는 토지가 풍부한 지역의 초고층 용도에 대응합니다. 이러한 다양한 설계가 어우러져 통신 타워 시장은 경제성을 해치지 않으면서도 도시 지역의 고밀도화와 지방으로의 서비스 확대라는 두 가지 목표를 모두 달성할 수 있도록 지원하고 있습니다.
지역별 분석
아시아태평양은 여전히 세계 성장의 원동력이 되고 있습니다. 그 배경에는 중국의 204만개 기지국 거점과 2030년까지 수십만 건의 신규 테넌트를 추가하겠다는 인도의 적극적인 5G 목표가 있습니다. 정부 정책도 이를 지원하고 있으며, 주파수 경매에서는 커버리지가 우선시되고, 농촌 지역에 대한 보조금을 통해 사업성 격차가 줄어들고 있습니다. 일본과 한국에서는 매크로 그리드 위에 스몰 셀을 중첩하는 초고밀도 아키텍처가 정교해지고 있는 반면, 동남아시아 시장에서는 구축을 가속화하고 비용을 절감하기 위해 타워 공유 체계를 모색하고 있습니다. 이러한 동향에 힘입어 아시아태평양은 통신 타워 시장에서 가장 크고 가장 빠르게 성장하는 지역으로서의 입지를 공고히 하고 있습니다.
북미는 성숙한 동시에 기술적으로 첨단인 상황에 있습니다. 광범위한 공유화로 인해 신규 건설 건수는 억제되고 있지만, 5G로의 업그레이드 및 엣지 데이터센터 구축 노력이 임대 수요를 지원하고 있습니다. ‘농촌 5G 기금’과 같은 연방 정부 프로그램은 인구 밀도가 낮은 지역의 경제적 과제를 해소하고, 서비스가 충분히 제공되지 않는 지역사회의 점진적인 성장을 촉진하고 있습니다. 규제 측면의 역풍은 지방 자치 단체 수준에서 발생하고 있으며, 구역 지정 관행이나 경관상의 반대로 인해 프로젝트 일정이 장기화될 가능성이 있지만, 연방 정부의 우선 조치로 인해 지방 자치 단체가 거부권을 행사할 수 있는 여지는 점차 좁아지고 있습니다.
유럽에서는 양극화 경향이 나타나고 있습니다. 서유럽 시장은 포화 상태와 엄격한 환경 규제에 직면해 있으며, 타워 업체들은 재생에너지를 활용한 부지나 환경 친화적인 규제를 충족하는 눈에 띄지 않는 디자인과 같은 혁신적인 노력을 기울여야 합니다. 대조적으로, 동유럽과 발칸 반도는 5G 도입 초기 단계에 있으며, 주파수 경매와 EU의 연결성 기금이 그린필드 건설을 지원하여 지역 전체의 성장 동력을 높이고 있습니다. 한편, 중동에서는 업계 재편이 진행 중이며, STC의 ‘TAWAL’이나 Zain의 ‘TASC’와 같은 플랫폼을 배경으로 타워 기업의 시장 점유율은 44%를 넘어섰습니다. 라틴아메리카에서는 아메리카 모빌의 브라질에 대한 77억 달러 투자와 확대되는 5G 주파수 경매의 혜택을 받고 있습니다. 반면, 아프리카의 장기적인 잠재력은 위성 백홀, 농촌 지역 보조금, 보편적 서비스 의무를 결합한 정부의 디지털화 계획에 달려 있습니다.
기타 혜택:
- 엑셀 형식의 시장 예측(ME) 시트
- 3개월간의 애널리스트 지원
자주 묻는 질문
목차
제1장 서론
제2장 조사 방법
제3장 개요
제4장 시장 구도
제5장 시장 규모와 성장 예측
제6장 경쟁 구도
제7장 시장 기회와 향후 전망
KSA 26.09.04According to Mordor Intelligence, the telecom towers market size was valued at USD 29.29 billion in 2025 and estimated to grow from USD 30.07 billion in 2026 to reach USD 34.3 billion by 2031, at a CAGR of 2.67% during the forecast period (2026-2031).
This report is Segmented by Fuel Type (Renewable, Non-Renewable), Type of Tower (Lattice Tower, Guyed Tower, Monopole Tower, Stealth Tower), Installation (Rooftop, Ground-Based), Ownership (Operator-Owned, Joint Venture, Private-Owned, MNO Captive), and Geography (North America, Europe, Asia-Pacific, Middle East, Africa, South America). The Market Forecasts are Provided in Terms of Value (USD).
Global Telecom Towers Market Trends and Insights
5G Network Rollouts Drive Infrastructure Densification
Operators must increase site density by three to five times compared with 4G to deliver 5G's low-latency targets, especially in high-band millimetre-wave spectrum. Latin America alone is expected to reach 425 million 5G connections by 2030, necessitating both traditional macro towers and growing layers of small cells. Regulatory bodies are responding: the Canadian Radio-television and Telecommunications Commission (CRTC) streamlined attachment rules so carriers can add 5G radios on existing structures without lengthy permissions. These policy shifts shorten deployment cycles and support consistent upward demand for new and upgraded tower sites across major urban corridors.
Rising Mobile Data Usage Pressures Network Capacity
U.S. wireless data consumption climbed 36% during 2024 as video streaming, cloud gaming, and enterprise mobility took hold, forcing carriers such as Crown Castle's tenants to densify urban footprints and expand rural coverage. Emerging markets mirror this surge as affordable smartphones proliferate. Techniques like carrier aggregation and massive-MIMO can stretch the spectrum, yet physical infrastructure remains the gating factor. As a result, the telecom towers market continues to exhibit incremental but durable expansion, with operators relying on tower companies to accelerate capacity meets.
Tower-Sharing Saturation Limits Mature-Market Upside
Co-location ratios in North America and Western Europe hover around 2.7 tenants per tower, leaving limited headroom for incremental leasing revenue. Structural limits complicate upgrades for heavier 5G equipment, prompting costly reinforcements that erode returns. While new tenancy pipelines remain healthy in emerging economies, saturation tempers growth in established regions, nudging the global telecom towers market toward a more balanced expansion profile.
Other drivers and restraints analyzed in the detailed report include:
- Rural Connectivity Programs Unlock New Market Opportunities
- MNO Tower-Asset Monetization Accelerates Industry Restructuring
- Environmental and Zoning Restrictions Complicate Deployment
For complete list of drivers and restraints, kindly check the Table Of Contents.
Segment Analysis
Non-renewable sources dominated with 72.88% telecom towers market share in 2025, anchored by grid electricity and diesel generators for macro-cell sites. However, renewables deliver the fastest growth at a 5.22% CAGR as operators pivot to solar-battery hybrids that slash operating expense in remote areas. Renewable adoption is most pronounced in regions with erratic grid supply and high diesel logistics costs; Telefonica Germany's energy self-sufficient 5G tower demonstrates viability in temperate climates. Hybrid systems also curb carbon output, aligning infrastructure providers with tightening ESG mandates and drawing green-finance capital toward the telecom towers market.
Progressive tower companies now bundle energy-as-a-service contracts, allowing MNOs to outsource both site and power management. As smart controllers and AI-driven battery analytics optimize consumption curves, the telecom towers industry is transitioning from energy consumer to localized producer. That evolution widens margin opportunity, diversifies revenue, and reinforces the sector's role in sustainable connectivity.
Lattice towers retained a 55.62% share in 2025 because their triangulated-steel design supports heavy multi-band payloads at economical cost. They remain the backbone for wide-area coverage across rural expanses of Asia-Pacific and Africa. Monopoles, though, exhibit the highest growth at 4.12% CAGR in urban corridors. Their single-column form factors reduce right-of-way and skirt aesthetic objections, enabling faster permitting cycles. Carbon-fiber monopoles introduced in 2024 weigh one-twelfth of steel yet deliver twelve times the tensile strength, curbing transport and foundation expense while extending asset life.
Stealth and guyed variants round out the portfolio: stealth solutions satisfy zoning mandates in heritage districts, while guyed towers address ultra-tall applications where land is abundant. Collectively, diversified designs help the telecom towers market serve both densification and rural outreach targets without compromising economics.
Complete Report Scope:
- By Fuel Type
- Renewable
- Non-Renewable
- By Type of Tower
- Lattice Tower
- Guyed Tower
- Monopole Tower
- Stealth Tower
- By Installation
- Rooftop
- Ground-based
- By Ownership
- Operator-owned
- Joint Venture
- Private-owned
- MNO Captive
- By Geography
- North America
- United States
- Canada
- Mexico
- Europe
- United Kingdom
- Germany
- France
- Italy
- Rest of Europe
- Asia-Pacific
- China
- Japan
- India
- South Korea
- Rest of Asia
- Middle East
- Israel
- Saudi Arabia
- United Arab Emirates
- Turkey
- Rest of Middle East
- Africa
- South Africa
- Egypt
- Rest of Africa
- South America
- Brazil
- Argentina
- Rest of South America
- North America
Geography Analysis
Asia-Pacific remains the engine of global growth, backed by China's 2.04 million-site footprint and India's aggressive 5G targets that will add hundreds of thousands of new tenancies by 2030. Government policy is supportive: spectrum auctions prioritize coverage, and rural subsidies narrow viability gaps. Japan and South Korea refine ultra-dense architectures that layer small cells onto macro grids, while Southeast Asian markets pursue tower-sharing frameworks to accelerate rollout and contain costs. These dynamics solidify Asia-Pacific's status as both the largest and fastest-growing slice of the telecom towers market.
North America presents a mature but technologically advanced landscape. Extensive co-location has tempered new-build volumes, yet 5G upgrades and edge-data-center initiatives sustain leasing demand. Federal programs such as the Rural 5G Fund bridge the economics of sparsely populated territories, steering incremental growth toward underserved communities. Regulatory headwinds arise at the municipal level, where zoning inertia and aesthetic opposition can extend project timelines, but federal pre-emption measures are narrowing the window for local vetoes.
Europe shows a two-speed pattern. Western markets face saturation and stringent environmental scrutiny, prompting tower companies to innovate with renewable-powered sites and stealth designs that satisfy eco-centric regulations. Eastern Europe and the Balkans, in contrast, are earlier in the 5G curve; spectrum auctions and EU connectivity funds support green-field construction that lifts overall regional momentum. Meanwhile, the Middle East advances consolidation, with TowerCo share surpassing 44% on the back of STC's TAWAL and Zain's TASC platforms. Latin America benefits from America Movil's USD 7.7 billion Brazil commitment and expanding 5G auctions, while Africa's long-term potential rests on government digitization plans that combine satellite backhaul, rural subsidies, and universal-service mandates.
- American Tower Corporation
- Cellnex Telecom S.A.
- China Tower Corporation Limited
- SBA Communications Corporation
- Indus Towers Limited
- Helios Towers PLC
- IHS Holding Limited
- Vantage Towers AG
- Deutsche Funkturm GmbH
- TAWAL Company Ltd.
- Telxius Telecom S.A.
- Telesites S.A.B. de C.V.
- AT&T Inc.
- T-Mobile US, Inc.
- GTL Infrastructure Limited
- Orange S.A.
- Telenor ASA
- PT Dayamitra Telekomunikasi Tbk (Mitratel)
- Ooredoo Q.P.S.C.
- Zong Pakistan (CMPak Limited)
Additional Benefits:
- The market estimate (ME) sheet in Excel format
- 3 months of analyst support
TABLE OF CONTENTS
1 INTRODUCTION
- 1.1 Study Assumptions and Market Definition
- 1.2 Scope of the Study
2 RESEARCH METHODOLOGY
3 EXECUTIVE SUMMARY
4 MARKET LANDSCAPE
- 4.1 Market Overview
- 4.2 Market Drivers
- 4.2.1 5G network roll-outs
- 4.2.2 Rising mobile data and smartphone usage
- 4.2.3 Rural connectivity programmes
- 4.2.4 MNO tower-asset monetisation
- 4.2.5 Edge data-centre co-location demand
- 4.2.6 Hybrid renewable power systems adoption
- 4.3 Market Restraints
- 4.3.1 Tower-sharing saturation
- 4.3.2 Environmental and zoning restrictions
- 4.3.3 High-strength steel and composite supply constraints
- 4.3.4 LEO-satellite rural coverage substitution
- 4.4 Industry Value-Chain Analysis
- 4.5 Regulatory Landscape
- 4.6 Technological Outlook
- 4.7 Porter's Five Forces Analysis
- 4.7.1 Bargaining Power of Suppliers
- 4.7.2 Bargaining Power of Buyers
- 4.7.3 Threat of New Entrants
- 4.7.4 Threat of Substitutes
- 4.7.5 Intensity of Competitive Rivalry
5 MARKET SIZE AND GROWTH FORECASTS (VALUE)
- 5.1 By Fuel Type
- 5.1.1 Renewable
- 5.1.2 Non-Renewable
- 5.2 By Type of Tower
- 5.2.1 Lattice Tower
- 5.2.2 Guyed Tower
- 5.2.3 Monopole Tower
- 5.2.4 Stealth Tower
- 5.3 By Installation
- 5.3.1 Rooftop
- 5.3.2 Ground-based
- 5.4 By Ownership
- 5.4.1 Operator-owned
- 5.4.2 Joint Venture
- 5.4.3 Private-owned
- 5.4.4 MNO Captive
- 5.5 By Geography
- 5.5.1 North America
- 5.5.1.1 United States
- 5.5.1.2 Canada
- 5.5.1.3 Mexico
- 5.5.2 Europe
- 5.5.2.1 United Kingdom
- 5.5.2.2 Germany
- 5.5.2.3 France
- 5.5.2.4 Italy
- 5.5.2.5 Rest of Europe
- 5.5.3 Asia-Pacific
- 5.5.3.1 China
- 5.5.3.2 Japan
- 5.5.3.3 India
- 5.5.3.4 South Korea
- 5.5.3.5 Rest of Asia
- 5.5.4 Middle East
- 5.5.4.1 Israel
- 5.5.4.2 Saudi Arabia
- 5.5.4.3 United Arab Emirates
- 5.5.4.4 Turkey
- 5.5.4.5 Rest of Middle East
- 5.5.5 Africa
- 5.5.5.1 South Africa
- 5.5.5.2 Egypt
- 5.5.5.3 Rest of Africa
- 5.5.6 South America
- 5.5.6.1 Brazil
- 5.5.6.2 Argentina
- 5.5.6.3 Rest of South America
- 5.5.1 North America
6 COMPETITIVE LANDSCAPE
- 6.1 Market Concentration
- 6.2 Strategic Moves
- 6.3 Market Share Analysis
- 6.4 Company Profiles (includes Global level Overview, Market level overview, Core Segments, Financials as available, Strategic Information, Market Rank/Share for key companies, Products and Services, and Recent Developments)
- 6.4.1 American Tower Corporation
- 6.4.2 Cellnex Telecom S.A.
- 6.4.3 China Tower Corporation Limited
- 6.4.4 SBA Communications Corporation
- 6.4.5 Indus Towers Limited
- 6.4.6 Helios Towers PLC
- 6.4.7 IHS Holding Limited
- 6.4.8 Vantage Towers AG
- 6.4.9 Deutsche Funkturm GmbH
- 6.4.10 TAWAL Company Ltd.
- 6.4.11 Telxius Telecom S.A.
- 6.4.12 Telesites S.A.B. de C.V.
- 6.4.13 AT&T Inc.
- 6.4.14 T-Mobile US, Inc.
- 6.4.15 GTL Infrastructure Limited
- 6.4.16 Orange S.A.
- 6.4.17 Telenor ASA
- 6.4.18 PT Dayamitra Telekomunikasi Tbk (Mitratel)
- 6.4.19 Ooredoo Q.P.S.C.
- 6.4.20 Zong Pakistan (CMPak Limited)
7 MARKET OPPORTUNITIES AND FUTURE OUTLOOK
- 7.1 White-space and Unmet-Need Assessment


