
|
시장보고서
상품코드
2121416
무선 센서 시장 : 시장 점유율 분석, 업계 동향 및 통계, 성장 예측(2026-2031년)Wireless Sensors - Market Share Analysis, Industry Trends & Statistics, Growth Forecasts (2026 - 2031) |
||||||
 Mordor Intelligence
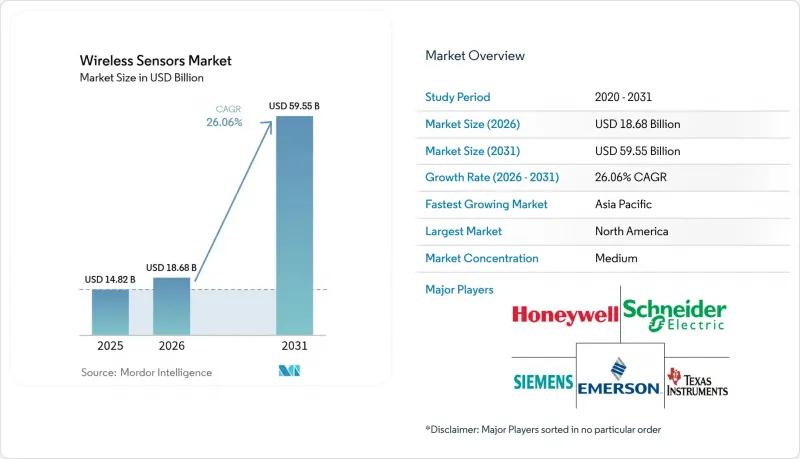
Mordor Intelligence에 의하면, 2026년 무선 센서 시장 규모는 186억 8,000만 달러로 추정되고, 2025년 148억 2,000만 달러에서 확대해, 2031년에는 595억 5,000만 달러에 이를 것으로 예측됩니다.
2026-2031년 연평균 성장률(CAGR)은 26.06%가 될 것으로 전망됩니다.
본 보고서는 센서 유형별(압력, 온도 등), 최종 사용자 산업별(자동차, 헬스케어, 항공우주 및 방위 등), 연결 프로토콜별(블루투스·BLE, Wi-Fi, Zigbee 등), 배치 환경별(실내 산업용, 실외 가혹 환경, 원격지/위험 구역 등), 지역별로 분류되어 있습니다. 시장 예측은 금액(달러) 기준으로 제시되어 있습니다.
세계의 무선 센서 시장 동향 및 인사이트
인더스트리 4.0·IIoT 아키텍처의 급속한 보급
디지털화의 추진에 따라 공장에서는 기존 생산 라인 전체에 무선 센서를 통합해야 할 필요성이 대두되고 있으며, 이를 통해 분석 및 머신러닝 워크플로우에 활용되는 실시간 데이터 스트림이 생성되고 있습니다. 2024년에 23%의 생산성 향상을 기록한 독일의 한 공장은 실시간 텔레메트리가 가져다주는 경제적 이점을 입증하고 있습니다. 5G 스몰 셀과 함께 배치된 엣지 컴퓨팅 노드는 의사 결정 루프를 단축하여, 유선 시스템으로는 실현하기 어려운 1초 미만의 제어 조정을 가능하게 합니다. ISO 50001 준수는 지속적인 자원 모니터링을 촉진하여 센서를 단순한 보조 장비에서 전략적 자산으로 격상시키고 있습니다. 경쟁사들의 추격에 힘입어 동종 업계의 시설에서도 도입이 잇따르고 있습니다. 도입 규모가 확대됨에 따라 벤더 생태계는 오픈 API를 중심으로 통합되어 투자의 미래 가치를 확보함과 동시에 솔루션의 확산을 가속화하고 있습니다.
저전력 광역 네트워크(LPWAN)의 보급
2024년에는 45개국에 이르는 전국 규모의 NB-IoT 네트워크와 유럽 산업 지대의 95% LoRaWAN 커버리지를 통해 연결성 격차가 해소되었습니다. 통신 사업자들은 미사용 주파수 슬라이스를 활용하여 대량 이용자를 대상으로 연간 2달러 미만의 연결 요금을 제공함으로써 수익화를 도모하고 있으며, 토양 수분 모니터링 및 원격 계측과 같은 이용 사례를 수개월 이내에 현금 흐름이 흑자로 전환되는 프로젝트로 전환하고 있습니다. 서비스 수준 계약(SLA) 보장을 통해 비면허 네트워크는 미션 크리티컬한 워크로드에도 활용 가능해졌으며, ETSI 준수 인증을 통해 다국적 전개가 효율화되었습니다. 액세스가 보급됨에 따라 무선 센서 시장은 공장의 벽을 넘어 새로운 용도를 창출하고 있으며, 교량 및 댐의 구조 건전성 진단 등이 그 예입니다.
독자적인 사양의 무선 스택 간 상호 운용성 제한
벤더 고유의 프로토콜은 여러 벤더가 도입할 경우 통합 비용을 40% 증가시키고, 구매자를 ‘월드가든’에 가두어 혁신을 지연시키고 있습니다. 산업 컨소시엄은 공통 데이터 스키마 수립에 노력하고 있지만, 그 진척도는 시장의 시급성을 따라가지 못하고 있습니다. 기업들은 서로 다른 프로토콜을 변환하는 게이트웨이나 미들웨어 계층을 점점 더 선호하고 있지만, 이는 지연과 비용을 증가시킵니다. 고객의 반발에 직면한 주요 공급업체들은 락인(lock-in)을 통한 이익과 목표 시장의 성장 사이에서 신중한 저울질을 하고 있습니다. 이러한 교착 상태로 인해 신뢰할 수 있는 상호 운용성 로드맵이 제시될 때까지 일부 대규모 프로젝트는 정체되어 있습니다.
부문 분석
석유, 가스, 화학 플랜트의 엄격한 안전 프로그램을 배경으로, 압력 측정 기기는 연평균 성장률(CAGR) 26.97%를 기록하며 모든 경쟁 제품을 능가하는 성장이 예상됩니다. 한편, 2025년에도 온도 측정 기기는 매출액 기준 27.10%로 1위 자리를 유지하고 있습니다. 이러한 변화는 예측 유지보수 예산이 과거에는 선택 사항으로 여겨졌던 고장 예방을 위한 압력 데이터로 전환되고 있음을 보여줍니다. SOI(Silicon-on-Insulator) 다이어프램과 BLE 무선 기능을 결합한 압력 센서의 혁신적인 기술 덕분에 부식성 유체에서도 드리프트가 없는 성능이 실현되어 교정에 드는 부담이 줄어들고 있습니다. 한편, 진동 센서와 위치 센서는 창고 로봇 및 회전 기계 진단 분야에서 성장세를 보이고 있어 수요의 다양화를 더욱 촉진하고 있습니다. 통합형 다중 매개변수 노드는 설치 비용을 더욱 절감하고 자산 태그 부착을 간소화합니다. 압력 장치에 기인한 무선 센서 시장 규모는 2031년까지 29.05%의 점유율을 차지할 것으로 예측되어, 이러한 성장 추세를 뒷받침하고 있습니다. 현재 부품 공급업체들은 공장에서 센서의 사전 교정을 수행함으로써 시스템 통합사업자의 수익 창출까지 걸리는 시간을 단축하고 있습니다.
2세대 화학·가스 센서는 엄격한 실내 공기질 기준을 충족하여 의료시설 및 반도체 제조 공장의 HVAC(공기조화설비) 개조를 촉진하고 있습니다. 이미지 센서와 mm파 레이더를 결합한 시각 검사 모듈은 위험한 현장에서 사용하기에 적합하며, 사람이 직접 출입하지 않고도 원격으로 안전 감사를 수행할 수 있게 해줍니다. 유량 센서와 습도 센서는 각각 물 절약 및 제약 제조 분야의 규정 준수 동향을 호재로 삼고 있습니다. 멀티 센서 구성이 성숙해짐에 따라 구매자들은 무선 펌웨어 업그레이드를 지원하고 장기적인 수익을 확보할 수 있는 미래 지향적인 노드를 선호하는 추세입니다. 그 결과, 무선 센서 시장은 사이버 위생 관리와 기능 강화를 결합한 안전한 업데이트 서비스의 애프터마켓 성장을 뒷받침하고 있습니다.
자동차 분야는 2025년 매출의 22.05%를 차지했으며, 타이어 공기압, 엔진 관리, 차량 안정성 등 확립된 이용 사례를 통해 OEM 수요와 교체 주기를 뒷받침하고 있습니다. 한편, 물류 및 운송 분야는 콜드체인 규정 준수를 강화하고 연료 낭비를 줄이기 위해 트레일러, 컨테이너, 지게차의 디지털화가 진행됨에 따라 26.75%라는 가장 높은 연평균 성장률(CAGR)을 나타낼 전망입니다. 실시간 지오펜싱 및 화물 상태 분석을 통해 보험료가 인하됨에 따라 센서의 대규모 도입이 촉진되고 있습니다. 물류 분야가 차지하는 무선 센서 시장 점유율은 2031년까지 18.60%를 넘어설 것으로 예측되며, 자동차 분야의 기존 기업들과의 격차가 좁혀질 전망입니다.
의료 분야에서는 재입원을 최소화하는 원격 환자 모니터링용 웨어러블 기기를 통해 도입이 가속화되고 있는 반면, 에너지 및 전력 사업자들은 막대한 손실을 초래하는 정전을 방지하기 위해 터빈과 변압기에 진동·온도 센서 노드를 설치하고 있습니다. 항공우주 및 방위 분야에서는 기체 구조의 건전성 감시를 위해 견고한 무선 노드가 조달되고 있으며, 추가 배선을 피하기 위해 경량 메쉬 무선 기술이 활용되고 있습니다. 소비자용 스마트 홈 기기의 경우, 보안 및 에너지 관리를 위한 Wi-Fi·Thread 센서가 보급되면서 기술에 익숙하지 않은 구매자층 사이에서도 센서 사용이 일상화되어 경공업 분야로의 확산을 촉진하고 있습니다. 이러한 수렴하는 동향에 따라 무선 센서 업계의 고객 기반은 중공업의 범위를 넘어 확대되고 있습니다.
지역별 분석
북미는 인더스트리 4.0의 선구자, 성숙한 시스템 통합사업자 생태계, 면허가 필요 없는 서브GHz 대역 운용을 권장하는 투명성이 높은 FCC 규제의 뒷받침을 받아 2025년 매출의 38.10%를 차지했습니다. 법인세제상의 우대 조치로 인해 자본 설비의 갱신 주기는 더욱 가속화되고 있습니다. 고속도로, 교량, 상수도 시설 개보수에 대한 공공 부문의 보조금에는 무선 센싱이 표준으로 포함되어 있어, 이를 통해 수년에 걸친 수요 파이프라인이 안정적으로 유지되고 있습니다. NIST 800-82와 같은 사이버 보안 프레임워크는 OT(운영 기술)의 방어 지침이 되어, 리스크 회피 성향의 구매자에게 안심감을 주고, 벤더의 보안 개발 라이프사이클에 대한 기준을 높이고 있습니다.
아시아태평양은 27.22%라는 가장 높은 연평균 성장률(CAGR)을 나타낼 전망입니다. 중국의 ‘이중 순환’ 정책과 ‘중국 제조 2025’ 구상은 디지털화에 따른 설비 교체를 지원하며, 국내 팹에서 생산되는 MEMS 센서의 대량 발주를 뒷받침하고 있습니다. 인도의 ‘스마트 시티 미션’은 IoT 대응 공공 인프라를 의무화하고 있어, 지자체 조달을 촉진하고 있습니다. 일본의 ‘사회 5.0’은 AI, 로봇공학, 센서 플랫폼을 융합한 부문 간 시범 프로젝트를 촉진하고 있습니다. 비용 경쟁력 있는 부품 공급과 급증하는 지역 수요가 맞물려, 이 지역은 생산 거점인 동시에 대량 구매자로서의 지위를 확립하고 있으며, 무선 센서 시장 규모의 경제를 강화하고 있습니다.
유럽에서는 견조한 성장과 엄격한 규제 감독 간의 균형이 잡혀 있습니다. GDPR(EU 개인정보보호규정)(일반 데이터 보호 규정)로 인해 데이터 보호 부담이 증가하는 한편, ‘사이버 복원력 법안’ 제안에 따라 ‘보안 설계(Security by Design)’가 추진되고 있습니다. 그러나 ‘유럽 그린 딜’에 따라 대규모 배출량 모니터링 프로젝트에 자금이 투입되면서, 화학 산업 회랑 및 철강 거점 주변에 시설 설치가 촉진되고 있습니다. 국가별로 분절되어 있던 무선 규제는 점차 조화를 이루고 있지만, 통합 파트너사들은 여전히 다양한 인증 절차를 준수해야 합니다. 이러한 복잡성에도 불구하고, 독일, 이탈리아, 북유럽 국가들에 확립된 공정 산업 클러스터는 무선 기반의 사후 개조에 적합한 안정적인 도입 기반을 제공합니다. 중동 및 아프리카는 아직 발전 단계에 있지만 미래가 기대되며, 석유 자원이 풍부한 걸프 국가에서는 외딴 지역의 파이프라인에서 에너지 수확형 센서의 시범 운영이 이루어지고 있고, 아프리카의 유틸리티 회사에서는 NB-IoT 지원 스마트 계량기의 도입 시험이 진행되고 있습니다.
기타 혜택 :
- 엑셀 형식 시장 예측(ME) 시트
- 3개월간의 애널리스트 지원
자주 묻는 질문
목차
제1장 서론
제2장 조사 방법
제3장 주요 요약
제4장 시장 구도
제5장 시장 규모 및 성장 예측
제6장 경쟁 구도
제7장 시장 기회 및 향후 전망
AJY 26.09.09According to Mordor Intelligence, wireless sensors market size in 2026 is estimated at USD 18.68 billion, growing from 2025 value of USD 14.82 billion with 2031 projections showing USD 59.55 billion, growing at 26.06% CAGR over 2026-2031.
This report is Segmented by Sensor Type (Pressure, Temperature, and More), End-User Industry (Automotive, Healthcare, Aerospace and Defense, and More), Connectivity Protocol (Bluetooth and BLE, Wi-Fi, Zigbee, and More), Deployment Environment (Indoor Industrial, Outdoor Harsh, Remote/Hazardous Locations, and More), and Geography. The Market Forecasts are Provided in Terms of Value (USD).
Global Wireless Sensors Market Trends and Insights
Rapid Adoption of Industry 4.0 and IIoT Architectures
Digitization mandates push factories to embed wireless sensors across legacy lines, creating live data streams that feed analytics and machine-learning workflows. German plants posting 23% productivity gains in 2024 validate the financial upside of real-time telemetry. Edge compute nodes collocated with 5G small cells shorten decision loops, allowing sub-second control adjustments that wired systems struggle to match. ISO 50001 compliance drives continuous resource monitoring, elevating sensors from ancillary gadgets to strategic assets. Competitive imitation then multiplies deployments across peer facilities. As adoption scales, vendor ecosystems coalesce around open APIs that future-proof investment and speed solution roll-outs.
Proliferation of Low-Power Wide-Area Networks
Nationwide NB-IoT footprints across 45 countries and 95% LoRaWAN coverage of European industrial zones erased the connectivity gap in 2024. Operators monetize idle spectrum slices by offering sub-USD 2 annual connectivity rates at volume, turning use cases like soil-moisture monitoring and remote metering into cash-flow-positive projects within months. Guaranteed service-level agreements make unlicensed networks viable for mission-critical workloads, while ETSI-aligned certification streamlines multinational roll-outs. As access becomes ubiquitous, the wireless sensors market spawns fresh applications outside factory walls, including structural-health diagnostics for bridges and dams.
Limited Interoperability Among Proprietary Wireless Stacks
Vendor-specific protocols inflate integration spending by 40% in multi-supplier deployments, locking buyers into walled gardens that slow innovation. Industrial consortia work on common data schemas, yet progress trails market urgency. Enterprises increasingly favor gateway or middleware layers that translate disparate protocols, but these add latency and cost. Faced with customer pushback, large suppliers weigh the trade-off between lock-in profits and addressable-market growth. The stand-off holds back some broad-scale projects until credible interoperability roadmaps emerge.
Other drivers and restraints analyzed in the detailed report include:
- Falling MEMS Sensor ASPs Enabling Massive Deployment
- Surge in Predictive-Maintenance Programs Across Process Industries
- Escalating Spectrum Congestion and Coexistence Issues in Sub-GHz Bands
For complete list of drivers and restraints, kindly check the Table Of Contents.
Segment Analysis
Pressure devices are set to outpace all rivals with a 26.97% CAGR on the back of stringent safety programs in oil, gas, and chemical plants, even as temperature devices retained 27.10% revenue leadership in 2025. This shift evidences how predictive-maintenance budgets pivot to failure-preventive pressure data that was once considered optional. Pressure-sensor innovations such as silicon-on-insulator diaphragms coupled with BLE radios yield drift-free performance in corrosive fluids, shrinking calibration overheads. Meanwhile, vibration and position sensors gain momentum in warehouse robotics and rotating-machinery diagnostics, rounding out diversified demand. Integrated multi-parameter nodes further compress installation costs and simplify asset tagging. The wireless sensors market size attributed to pressure devices is forecast to capture a 29.05% slice by 2031, underscoring the momentum shift. Component vendors now pre-calibrate sensors at the factory, speeding time to revenue for system integrators.
Second-generation chemical and gas sensors meet stringent indoor-air-quality norms, prompting HVAC retrofits across healthcare and semiconductor fabs. Image sensors combined with mm-wave radar form visual-inspection modules for hazardous sites, allowing remote safety audits without human entry. Flow and humidity sensors ride water-conservation and pharmaceutical-manufacturing compliance trends, respectively. As multi-sensor configurations mature, buyers lean toward future-proof nodes that accept over-the-air firmware upgrades, securing long-term returns. Consequently, the wireless sensors market supports a growing aftermarket for secure update services that bundle cyber-hygiene with functional enhancements.
Automotive held 22.05% revenue in 2025 through established tire-pressure, engine-management, and vehicle-stability use cases, anchoring original-equipment demand and replacement cycles. Yet logistics and transportation is on course for the swiftest 26.75% CAGR as fleets digitize trailers, containers, and forklifts to tighten cold-chain compliance and slash fuel wastage. Real-time geofencing and cargo-condition analytics lower insurance premiums, encouraging mass sensor roll-outs. The wireless sensors market share captured by logistics is projected to top 18.60% by 2031, narrowing the gap with automotive incumbents.
Healthcare adoption accelerates through remote-patient monitoring wearables that minimize hospital readmissions, while energy and power utilities install vibration and temperature nodes on turbines and transformers to defer costly outages. Aerospace and defense procure ruggedized wireless nodes for airframe structural-health monitoring, leveraging lightweight mesh radios to avoid additional cabling. Consumer smart-home devices popularize Wi-Fi and Thread sensors for security and energy management, normalizing sensor use among non-technical buyers and inspiring cross-overs into light-industrial segments. These converging dynamics broaden the wireless sensors industry customer base beyond heavy manufacturing.
Complete Report Scope:
- By Sensor Type
- Pressure Sensors
- Temperature Sensors
- Chemical and Gas Sensors
- Position and Proximity Sensors
- Vibration Sensors
- Flow Sensors
- Humidity Sensors
- Image Sensors
- Other Sensor Types
- By End-user Industry
- Automotive
- Healthcare
- Aerospace and Defense
- Energy and Power
- Food and Beverage
- Agriculture
- Building Automation and Smart Homes
- Consumer Electronics
- Logistics and Transportation
- Other End-user Industries
- By Connectivity Protocol
- Bluetooth and BLE
- Wi-Fi
- Zigbee
- Cellular (4G/5G/NB-IoT)
- LoRaWAN
- Sigfox
- WirelessHART
- Thread
- Z-Wave
- Other Connectivity Protocols
- By Deployment Environment
- Indoor Industrial
- Outdoor Harsh
- Remote / Hazardous Locations
- Underwater / Subsea
- Building Infrastructure / Residential
- By Geography
- North America
- United States
- Canada
- Mexico
- South America
- Brazil
- Argentina
- Rest of South America
- Europe
- Germany
- United Kingdom
- France
- Italy
- Spain
- Rest of Europe
- Asia-Pacific
- China
- Japan
- South Korea
- India
- ASEAN
- Rest of Asia-Pacific
- Middle East and Africa
- Middle East
- Saudi Arabia
- United Arab Emirates
- Qatar
- Turkey
- Rest of Middle East
- Africa
- South Africa
- Egypt
- Nigeria
- Rest of Africa
- Middle East
- North America
Geography Analysis
North America controlled 38.10% of 2025 revenue, supported by early Industry 4.0 champions, mature system-integrator ecosystems, and transparent FCC rules that endorse unlicensed sub-GHz operation. Corporate tax incentives further accelerate capital-equipment refresh cycles. Public-sector grants for highway, bridge, and water-utility upgrades integrate wireless sensing as standard, stabilizing multi-year demand pipelines. Cybersecurity frameworks such as NIST 800-82 guide OT defenses, reassuring risk-averse buyers and raising the bar for vendors' secure-development lifecycles.
Asia-Pacific is on track to post the quickest 27.22% CAGR. China's dual-circulation policy and Made in China 2025 blueprint subsidize digital retrofits and lift bulk orders for MEMS sensors produced by domestic fabs. India's Smart Cities Mission mandates IoT-enabled utilities, propelling municipal procurements. Japan's Society 5.0 catalyzes cross-sector pilot projects blending AI, robotics, and sensor platforms. Cost-competitive component supply, combined with soaring regional demand, positions the region as both production hub and volume buyer, reinforcing economies of scale for the wireless sensors market.
Europe balances robust growth with strict regulatory oversight. GDPR adds data-protection overhead, while Cyber Resilience Act proposals push security-by-design. Yet the European Green Deal funds large-scale emissions-monitoring projects, spurring installations along chemical corridors and steel hubs. Fragmented national radio rules gradually harmonize, but integration partners still navigate varying certification paths. Despite complexity, established process-industry clusters in Germany, Italy, and the Nordics provide a stable installed base ripe for wireless retrofits. The Middle East and Africa are nascent but promising, with oil-rich Gulf states piloting energy-harvesting sensors on remote pipelines and African utilities trialing NB-IoT smart-meter roll-outs.
- ABB Ltd.
- Advantech Co., Ltd.
- Analog Devices, Inc.
- Banner Engineering Corp.
- Bosch Sensortec GmbH
- Digi International Inc.
- Emerson Electric Co.
- Honeywell International Inc.
- Infineon Technologies AG
- Libelium Comunicaciones Distribuidas S.L.
- LORD Sensing Systems (MicroStrain)
- Monnit Corporation
- NXP Semiconductors N.V.
- OMRON Corporation
- Pasco Scientific
- Phoenix Sensors LLC
- Qualcomm Incorporated
- Rockwell Automation, Inc.
- Schneider Electric SE
- Sensirion AG
- Siemens AG
- Silicon Laboratories Inc.
- STMicroelectronics N.V.
- TE Connectivity Ltd.
- Texas Instruments Incorporated
Additional Benefits:
- The market estimate (ME) sheet in Excel format
- 3 months of analyst support
TABLE OF CONTENTS
1 INTRODUCTION
- 1.1 Study Assumptions and Market Definition
- 1.2 Scope of the Study
2 RESEARCH METHODOLOGY
3 EXECUTIVE SUMMARY
4 MARKET LANDSCAPE
- 4.1 Market Overview
- 4.2 Market Drivers
- 4.2.1 Rapid adoption of Industry 4.0 and IIoT architectures
- 4.2.2 Proliferation of low-power wide-area (LPWA) networks
- 4.2.3 Falling MEMS sensor ASPs enabling massive deployment
- 4.2.4 Surge in predictive-maintenance programs across process industries
- 4.2.5 Battery-free energy-harvesting sensor breakthroughs (e.g., piezo, RF)
- 4.2.6 Government incentives for smart-infrastructure retrofits
- 4.3 Market Restraints
- 4.3.1 Limited interoperability among proprietary wireless stacks
- 4.3.2 Escalating spectrum-congestion and coexistence issues in sub-GHz bands
- 4.3.3 Supply-chain volatility for key semiconductor components
- 4.3.4 Rising cyber-physical attack surface in OT environments
- 4.4 Industry Value Chain Analysis
- 4.5 Regulatory Landscape
- 4.6 Technological Outlook
- 4.7 Porter's Five Forces Analysis
- 4.7.1 Bargaining Power of Suppliers
- 4.7.2 Bargaining Power of Consumers
- 4.7.3 Threat of New Entrants
- 4.7.4 Threat of Substitutes
- 4.7.5 Intensity of Competitive Rivalry
- 4.8 Investment Analysis
- 4.9 Impact of Macroeconomic Fcators
5 MARKET SIZE AND GROWTH FORECASTS (VALUE)
- 5.1 By Sensor Type
- 5.1.1 Pressure Sensors
- 5.1.2 Temperature Sensors
- 5.1.3 Chemical and Gas Sensors
- 5.1.4 Position and Proximity Sensors
- 5.1.5 Vibration Sensors
- 5.1.6 Flow Sensors
- 5.1.7 Humidity Sensors
- 5.1.8 Image Sensors
- 5.1.9 Other Sensor Types
- 5.2 By End-user Industry
- 5.2.1 Automotive
- 5.2.2 Healthcare
- 5.2.3 Aerospace and Defense
- 5.2.4 Energy and Power
- 5.2.5 Food and Beverage
- 5.2.6 Agriculture
- 5.2.7 Building Automation and Smart Homes
- 5.2.8 Consumer Electronics
- 5.2.9 Logistics and Transportation
- 5.2.10 Other End-user Industries
- 5.3 By Connectivity Protocol
- 5.3.1 Bluetooth and BLE
- 5.3.2 Wi-Fi
- 5.3.3 Zigbee
- 5.3.4 Cellular (4G/5G/NB-IoT)
- 5.3.5 LoRaWAN
- 5.3.6 Sigfox
- 5.3.7 WirelessHART
- 5.3.8 Thread
- 5.3.9 Z-Wave
- 5.3.10 Other Connectivity Protocols
- 5.4 By Deployment Environment
- 5.4.1 Indoor Industrial
- 5.4.2 Outdoor Harsh
- 5.4.3 Remote / Hazardous Locations
- 5.4.4 Underwater / Subsea
- 5.4.5 Building Infrastructure / Residential
- 5.5 By Geography
- 5.5.1 North America
- 5.5.1.1 United States
- 5.5.1.2 Canada
- 5.5.1.3 Mexico
- 5.5.2 South America
- 5.5.2.1 Brazil
- 5.5.2.2 Argentina
- 5.5.2.3 Rest of South America
- 5.5.3 Europe
- 5.5.3.1 Germany
- 5.5.3.2 United Kingdom
- 5.5.3.3 France
- 5.5.3.4 Italy
- 5.5.3.5 Spain
- 5.5.3.6 Rest of Europe
- 5.5.4 Asia-Pacific
- 5.5.4.1 China
- 5.5.4.2 Japan
- 5.5.4.3 South Korea
- 5.5.4.4 India
- 5.5.4.5 ASEAN
- 5.5.4.6 Rest of Asia-Pacific
- 5.5.5 Middle East and Africa
- 5.5.5.1 Middle East
- 5.5.5.1.1 Saudi Arabia
- 5.5.5.1.2 United Arab Emirates
- 5.5.5.1.3 Qatar
- 5.5.5.1.4 Turkey
- 5.5.5.1.5 Rest of Middle East
- 5.5.5.2 Africa
- 5.5.5.2.1 South Africa
- 5.5.5.2.2 Egypt
- 5.5.5.2.3 Nigeria
- 5.5.5.2.4 Rest of Africa
- 5.5.5.1 Middle East
- 5.5.1 North America
6 COMPETITIVE LANDSCAPE
- 6.1 Market Concentration
- 6.2 Strategic Moves
- 6.3 Market Share Analysis
- 6.4 Company Profiles (includes Global level Overview, Market level overview, Core Segments, Financials as available, Strategic Information, Market Rank/Share for key companies, Products and Services, and Recent Developments)
- 6.4.1 ABB Ltd.
- 6.4.2 Advantech Co., Ltd.
- 6.4.3 Analog Devices, Inc.
- 6.4.4 Banner Engineering Corp.
- 6.4.5 Bosch Sensortec GmbH
- 6.4.6 Digi International Inc.
- 6.4.7 Emerson Electric Co.
- 6.4.8 Honeywell International Inc.
- 6.4.9 Infineon Technologies AG
- 6.4.10 Libelium Comunicaciones Distribuidas S.L.
- 6.4.11 LORD Sensing Systems (MicroStrain)
- 6.4.12 Monnit Corporation
- 6.4.13 NXP Semiconductors N.V.
- 6.4.14 OMRON Corporation
- 6.4.15 Pasco Scientific
- 6.4.16 Phoenix Sensors LLC
- 6.4.17 Qualcomm Incorporated
- 6.4.18 Rockwell Automation, Inc.
- 6.4.19 Schneider Electric SE
- 6.4.20 Sensirion AG
- 6.4.21 Siemens AG
- 6.4.22 Silicon Laboratories Inc.
- 6.4.23 STMicroelectronics N.V.
- 6.4.24 TE Connectivity Ltd.
- 6.4.25 Texas Instruments Incorporated
7 MARKET OPPORTUNITIES AND FUTURE OUTLOOK
- 7.1 White-space and Unmet-Need Assessment