

|
시장보고서
상품코드
2121454
특수 흑연 : 시장 점유율 분석, 업계 동향과 통계, 성장 예측(2026-2031년)Special Graphite - Market Share Analysis, Industry Trends & Statistics, Growth Forecasts (2026 - 2031) |
||||||
 Mordor Intelligence
Mordor Intelligence에 의하면, 특수 흑연 시장 규모는 2025년에 11억 3,000만 달러, 2026년에 11억 9,000만 달러, 2031년까지 15억 2,000만 달러에 이를 것으로 예측되며, 2026-2031년 CAGR 5.02%를 기록할 전망입니다.
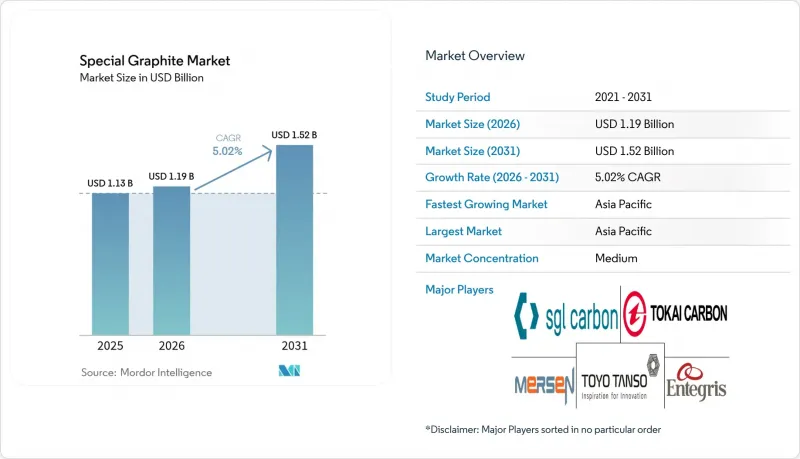
본 보고서는 제품 유형(등방성 흑연, 압출 흑연, 성형 흑연 및 기타 제품 유형), 최종 사용자 산업(주조 및 야금, 전자, 태양광 발전 및 기타 최종 사용자 산업), 지역(아시아태평양, 북미, 유럽, 남미, 중동 및 아프리카)별로 세분화되어 있습니다. 시장 예측은 금액(달러) 기준으로 제시되어 있습니다.
세계 특수 흑연 시장 동향 및 인사이트
정부의 탈탄소화 정책이 태양전지 웨이퍼 수요를 끌어올리고
각국의 기후 변화 대책은 폴리실리콘 및 웨이퍼 생산 능력 확대로 직접 이어지고 있으며, 이에 따라 특수 흑연 시장 수요가 급증하고 있습니다. 중국은 2024년에 400GW 규모의 태양광 발전 생산 라인을 증설했는데, 이를 위해 초크랄스키법 및 방향성 응고법용 도가니용 흑연이 약 12만 톤 필요했습니다. 미국의 ‘인플레이션 억제법’에 따라 퍼스트 솔라(First Solar)와 Qcells는 국내 웨이퍼 공장에 40억 달러를 투자하기로 결정했습니다. 이 공장들에서는 1,450°C의 온도에 노출되어도 휘어지지 않는 등방성 서셉터가 각각 필요합니다. 인도의 ‘생산 연계형 인센티브(PLI)’ 프로그램에서는 태양전지 부품용으로 2,400억 루피가 배정되었으나, 인도에서는 여전히 특수 등급 제품의 90% 이상을 수입에 의존하고 있어 이로 인해 3-6개월의 가동 개시 지연이 발생하고 있습니다. 유럽에서는 2024년부터 2026년에 걸쳐 8-10퍼센트 포인트 상승했습니다. 웨이퍼의 두께가 180µm에서 130µm으로 얇아질수록, 역설적으로 기가와트당 흑연 사용량은 증가합니다. 이는 웨이퍼가 얇을수록 열 프로파일 제어가 더 엄격해지고, 도가니 교체 빈도가 높아지기 때문입니다.
미국 및 유럽연합(EU) 내 전기차(EV) 배터리 공급망의 현지화가 특수 흑연 수요를 견인
미국의 ‘우려 대상 외국 기업(FEOC)’ 규정 및 EU의 ‘중요 원자재법’에 따라, 자동차 제조업체는 2027년 이후 중국산 이외의 흑연을 확보해야 할 의무가 있습니다. 이는 2024년에 중국이 150만 톤의 구상 흑연을 정제했음에도 불구하고입니다. 제너럴 모터스(GM)와 스텔란티스는 루이지애나주에 위치한 사이라(Syla)사의 비달리아 공장 및 테네시주에 위치한 노보니크스(Novonicks)사의 시설과 다년간공급 계약을 체결하고, IRA(인플레이션 억제법)의 적격성을 확보하기 위해 15-20%의 가격 프리미엄을 지불했습니다. BMW와 폭스바겐은 폴란드의 합성 흑연 합작 사업에 12억 유로를 배정했으나, 해당 공장은 석유 유래 니들 코크에 의존하고 있어 2025년 초에 관측된 톤당 750달러 수준의 원자재 가격 급등에 취약한 상황에 놓여 있습니다. FEOC의 면세 조치는 2027년에 만료되므로, 유럽과 미국의 자동차 제조업체들에게는 공급을 확보할 것인지, 아니면 차량당 7,500달러의 세액 공제를 포기할 것인지 선택해야 하는 제한된 기간이 될 것입니다. 한국이 9조 원을 투자하는 ‘K-Battery’ 프로그램은 2028년까지 20만 톤의 음극재 생산 능력을 목표로 하고 있지만, 여전히 중국산 플레이크형 흑연 수입에 의존하고 있어 ‘현지화’가 정제 단계에서 멈추는 경우가 많습니다.
LTO 및 나트륨 이온 화학 분야의 획기적인 발전이 흑연 사용량을 줄일 것으로 전망됩니다.
리튬 티타네이트(LTO) 음극은 2만 사이클의 수명을 자랑하며, 이미 중국 전기 버스용 배터리 팩에서 주류로 자리 잡았으며, 2025년 한 해에만 약 1만 5,000톤의 흑연을 대체할 전망입니다. CATL이 상용화하고 BYD의 ‘Seagull’에 탑재된 나트륨 이온 배터리는 2025년에 흑연 음극을 사용하지 않고 20만 대를 판매했습니다. 향후 200 Wh/kg이라는 기준점이 달성되면, 흑연은 고급 등급으로만 제한될 가능성이 있으며, 2028년 이후에는 수요가 최대 15% 감소할 우려가 있습니다. 이러한 위협은 천연 플레이크에 집중되어 있어, 이익률이 높은 합성 등급에 미치는 영향은 비교적 적겠지만, 유럽과 미국의 신규 정제소를 뒷받침하는 판매량은 감소할 전망입니다.
부문 분석
등방성 흑연은 2025년 특수 흑연 시장 점유율의 47.98%를 차지하고 있으며, 반도체, 수소 및 실리콘 함량이 높은 음극재 수요에 힘입어 2031년까지 연평균 성장률(CAGR) 5.51%로 확대될 것으로 예측됩니다. 도카이 카본과 도요 탄소는 일본과 미국에서 공동으로 생산 능력을 확대하고 있지만, 등방성 압축 성형 및 수 주간에 걸친 흑연화 공정이 생산 확대 속도를 제한하고 있어 18개월의 리드타임이 여전히 지속되고 있습니다.
압출 흑연은 절대적인 순도보다 사이클당 비용이 중시되는 방전 가공(EDM)이나 주조용 금형에 이용되고 있습니다. 성형 흑연은 철강 및 비철금속 연속 주조 라인의 기반이 되고 있지만, 중국의 철강 생산량이 정점에 도달함에 따라 그 성장은 둔화되고 있습니다. 유연성 흑연 및 팽창성 흑연과 같은 틈새 제품은 300-400 W/m*K의 열전도율이 필요한 전기차(EV)의 열 관리 시스템으로부터 혜택을 받고 있으며, 성장이 더딘 범용 제품 분야 중에서도 두 자릿수 성장을 보이는 분야입니다. 가격 차이는 여전히 크며, 등방성 흑연은 압출 성형 흑연보다 2-3배 높은 가격에 거래되고 있습니다. 이는 고정밀 등급의 특수 흑연 시장에서 0.1%의 기공률이라는 사양에 기반한 프리미엄 가격이 형성되어 있기 때문입니다.
지역별 분석
아시아태평양은 2025년에 특수 흑연 시장 점유율의 45.78%를 차지하며, 2031년까지 연평균 6.57%의 성장률을 보이고 있습니다. 이는 중국의 연간 400GW 규모의 태양전지 웨이퍼 생산 능력 확대와 150만 톤의 구상 흑연 생산에 힘입은 것입니다. 2023년에 강화된 중국의 수출 허가 규제로 인해, 유럽과 미국의 구매자들은 이미 중국산 이외의 원료에 대해 15-20%의 프리미엄을 지불할 수밖에 없는 상황입니다. 한국은 ‘K-Battery’ 이니셔티브에 따라 2028년까지 20만 톤의 국내 음극재 생산 능력을 계획하고 있지만, 중국산 플레이크에 대한 의존도가 높아 진정한 자립은 여전히 요원한 상황입니다. 일본은 오랜 기간에 걸친 팹 인증을 방어적인 성벽으로 활용하여, 초고순도 등방성 등급 분야에서 틈새 시장 리더십을 유지하고 있습니다. 인도는 2024년에 3만 5,000톤의 천연 흑연을 채굴하고, 600억 루피를 특수 용도로 전환하는 데 투자하고 있지만, 파이프라인공급량은 여전히 소규모에 그치고 있습니다.
북미는 ‘인플레이션 억제법(Inflation Reduction Act)’의 혜택을 받고 있으며, 이로 인해 흑연 조달 상황이 대당 7,500달러의 양자택일 문제로 대두되고 있습니다. 시라(Syrah)사의 비달리아(Vidalia) 라인은 2024년에 1만 톤에 도달할 예정이며, 2027년까지 4만 5,000톤으로 확대될 전망입니다. 한편, 노보닉스(Novonix)사의 테네시주 공장은 2025년 말까지 1만 6,000톤을 목표로 하고 있습니다. 캐나다의 비셋 크릭(Bissett Creek)은 2024년에 가동을 재개하여 퀘벡주의 구상 흑연 합작 사업(연간 생산량 2만 5,000톤)에 원료를 공급하고 있습니다. 또한, 멕시코의 USMCA(미국·멕시코·캐나다 협정) 준수 공급업체는 현재 테슬라의 오스틴 복합 시설에 원료를 공급하고 있습니다.
유럽에서는 SGL 카본이 2억 유로를 투자해 스웨덴에서 추진 중인 확장 계획이 EU의 ‘중요 원자재법’의 흐름에 편승하고 있습니다. 이 법에 따르면 2030년까지 소비량의 40%를 현지에서 가공해야 할 의무가 부과됩니다. 현재 도가니용 흑연을 공급하고 있는 곳은 SGL사와 메르센사뿐이며, 이로 인해 양사는 8-10포인트의 가격 차이를 확보하고 있습니다. 러시아의 수출은 제재로 인해 감소함에 따라, 유럽의 구매자들은 튀르키예나 인도산 원료로 전환하고 있습니다. 중동 및 아프리카에서는 NEOM의 4GW에 달하는 전해조 수요에 연동된 집중적인 성장이 나타나는 반면, 남미의 프로젝트는 여전히 검토 단계에 머물러 있습니다.
기타 혜택:
- 엑셀 형식 시장 전망(ME) 시트
- 3개월간의 애널리스트 지원
자주 묻는 질문
목차
제1장 서론
제2장 조사 방법
제3장 주요 요약
제4장 시장 구도
제5장 시장 규모와 성장 예측
제6장 경쟁 구도
제7장 시장 기회와 향후 전망
LSH 26.09.09According to Mordor Intelligence, the special graphite market size is projected to be USD 1.13 billion in 2025, USD 1.19 billion in 2026, and reach USD 1.52 billion by 2031, growing at a CAGR of 5.02% from 2026 to 2031.
This report is Segmented by Product Type (Isotropic Graphite, Extruded Graphite, Molded Graphite, and Other Product Types), End-User Industry (Foundry and Metallurgy, Electronics, Photovoltaic, and Other End-User Industries), and Geography (Asia-Pacific, North America, Europe, South America, and Middle-East and Africa). The Market Forecasts are Provided in Terms of Value (USD).
Global Special Graphite Market Trends and Insights
Government Decarbonization Policies Boosting Solar-Wafer Demand
National climate mandates are translating directly into polysilicon and wafer capacity that sharply lifts special graphite market demand. China added 400 GW of solar manufacturing lines in 2024, which required an estimated 120,000 tonnes of crucible-grade graphite for Czochralski and directional-solidification processes. The U.S. Inflation Reduction Act pushed First Solar and Qcells to commit USD 4 billion to domestic wafer plants that each need isotropic susceptors able to survive 1,450 °C without warping. India's Production-Linked Incentive program set aside INR 240 billion for solar components, yet the country still imports more than 90% of specialty grades, creating commissioning delays of three to six months. Europe's rose eight to ten percentage points between 2024 and 2026. Falling wafer thickness from 180 µm to 130 µm paradoxically raises graphite intensity per gigawatt because thinner wafers need tighter thermal-profile control and more rapid crucible replacement.
EV-Battery Supply-Chain Localization in United States and European Union Spurring Special Graphite Offtake
Foreign Entity of Concern rules in the United States and the EU Critical Raw Materials Act obligate automakers to secure non-Chinese graphite after 2027, even though China refined 1.5 million tonnes of spherical graphite in 2024. General Motors and Stellantis signed multi-year offtakes with Syrah's Vidalia plant in Louisiana and Novonix's Tennessee facility, paying 15-20% price premiums to lock in IRA eligibility. BMW and Volkswagen earmarked EUR 1.2 billion for a synthetic-graphite venture in Poland, but the plant's dependence on petroleum needle coke makes it vulnerable to feedstock spikes such as the USD 750-per-tonne price seen in early 2025. The FEOC exemption sunsets in 2027, creating a narrow window in which Western OEMs either secure supply or forfeit USD 7,500 per vehicle in tax credits. South Korea's KRW 9 trillion K-Battery program aims for 200,000 tonnes of anode capacity by 2028, yet still leans on imported Chinese flake, showing that "localization" often stops at refining.
Breakthroughs in LTO and Sodium-Ion Chemistries Lowering Graphite Intensity
Lithium-titanate-oxide anodes offer 20,000-cycle lifespans and already dominate Chinese e-bus packs, displacing about 15,000 tonnes of graphite in 2025 alone. Sodium-ion batteries commercialized by CATL and deployed in BYD's Seagull sold 200,000 units in 2025 without graphite anodes, and the upcoming 200 Wh/kg milestones could restrict graphite to premium trims, trimming demand by up to 15% post-2028. The threat skews toward natural flake, leaving higher-margin synthetic grades less affected yet eroding volume that supports new Western refineries.
Other drivers and restraints analyzed in the detailed report include:
- Shift to Large-Format Si-Rich Anodes Needing Higher-Purity Graphite
- Foundry Migration from Metal to Graphite Molds for Complex Alloys
- Stricter EU-REACH Limits on Graphite-Dust Emissions Increase CAPEX
For complete list of drivers and restraints, kindly check the Table Of Contents.
Segment Analysis
Isotropic graphite held 47.98% of the special graphite market share in 2025 and is forecast to expand at a 5.51% CAGR through 2031, supported by semiconductor, hydrogen, and silicon-rich anode demand. Tokai Carbon and Toyo Tanso together are adding capacity across Japan and the United States, yet 18-month lead times persist because isostatic pressing and multi-week graphitization limit ramp speed.
Extruded graphite is serving EDM and foundry molds where cost per cycle matters more than absolute purity. Molded graphite anchors continuous-casting lines for steel and non-ferrous metals, but growth is muted as Chinese steel output plateaus. Niche products such as flexible and expandable graphite benefit from EV thermal-management systems that need 300-400 W/m*K conductivity, creating double-digit growth pockets even within a slower commodity tier. Price differentials remain wide: isotropic sells for two to three times extruded because the special graphite market size for high-precision grades commands premiums tied to 0.1% porosity specs.
Complete Report Scope:
- By Product Type
- Isotropic Graphite
- Extruded Graphite
- Molded Graphite
- Other Product Types
- By End-user Industry
- Foundry and Metallurgy
- Electronics
- Photovoltaic
- Other End-user Indsutries
- By Geography
- Asia-Pacific
- China
- India
- Japan
- South Korea
- Rest of Asia-Pacific
- North America
- United States
- Canada
- Mexico
- Europe
- Germany
- United Kingdom
- France
- Italy
- Russia
- Rest of Europe
- South America
- Brazil
- Argentina
- Rest of South America
- Middle-East and Africa
- Saudi Arabia
- South Africa
- United Arab Emirates
- Rest of Middle-East and Africa
- Asia-Pacific
Geography Analysis
Asia-Pacific commanded 45.78% of the special graphite market share in 2025 and is growing at 6.57% to 2031, anchored by China's 400 GW annual solar-wafer expansions and 1.5 million-tonne spherical-graphite output. Chinese export-permit rules, tightened in 2023, already prompt Western offtakers to pay 15-20% premiums for non-Chinese feedstock. South Korea plans 200,000 tonnes of local anode capacity by 2028 under the K-Battery initiative, but heavy reliance on Chinese flake means real autonomy remains distant. Japan keeps its niche leadership in ultra-pure isotropic grades, leveraging multi-year fab qualifications as a protective moat. India mined 35,000 tonnes of natural graphite in 2024 and is channeling INR 60 billion into specialty conversions, yet pipeline volumes remain small.
North America benefits from the Inflation Reduction Act, which turns graphite sourcing into a USD 7,500-per-vehicle binary. Syrah's Vidalia line hit 10,000 tonnes in 2024 and is scaling to 45,000 tonnes by 2027, while Novonix's Tennessee plant targets 16,000 tonnes by late 2025. Canada's Bissett Creek restarted in 2024 and feeds a 25,000-tonne Quebec spherical-graphite partnership, and Mexico's USMCA-compliant suppliers now feed Tesla's Austin complex.
In Europe, SGL Carbon's EUR 200 million Swedish expansion rides the EU Critical Raw Materials Act, which requires 40% of consumption to be processed locally by 2030. Only SGL and Mersen currently supply crucible-grade graphite, giving them an 8-10 point margin. Russia's exports dipped under sanctions, moving European buyers toward Turkish and Indian feedstock. The Middle-East and Africa show focused growth tied to 4 GW of NEOM electrolyser demand, while South American projects remain at the exploration stage.
- Entegris
- Fangda Carbon New Material Co. Ltd
- GCM CORPORATION Ltd
- GrafTech International
- Graphite India Limited
- Mersen Property
- Morgan Advanced Materials Plc
- Nippon Carbon Co. Ltd
- Pingdingshan City Kaiyuan Specialty Graphite Ltd
- Schunk Carbon Technology
- SEC CARBON, Limited
- SGL Carbon
- Tokai Carbon Co., Ltd.
- Toyo Tanso Co., Ltd.
- Yichang Xincheng Graphite Co., Ltd.
Additional Benefits:
- The market estimate (ME) sheet in Excel format
- 3 months of analyst support
TABLE OF CONTENTS
1 Introduction
- 1.1 Study Assumptions and Market Definition
- 1.2 Scope of the Study
2 Research Methodology
3 Executive Summary
4 Market Landscape
- 4.1 Market Overview
- 4.2 Market Drivers
- 4.2.1 Government decarbonisation policies boosting solar-wafer demand
- 4.2.2 EV-battery supply-chain localisation in United States and European Union spurring special graphite offtake
- 4.2.3 Shift to large-format Si-rich anodes needing higher-purity graphite
- 4.2.4 Foundry migration from metal to graphite molds for complex alloys
- 4.2.5 Rapid expansion of green-hydrogen electrolyser plates using isostatic graphite
- 4.3 Market Restraints
- 4.3.1 Breakthroughs in LTO and sodium-ion chemistries lowering graphite intensity
- 4.3.2 Stricter EU-REACH limits on graphite-dust emissions increase CAPEX
- 4.3.3 Slow qualification cycles for isostatic graphite in advanced semiconductor fabs
- 4.4 Value Chain Analysis
- 4.5 Porter's Five Forces
- 4.5.1 Bargaining Power of Suppliers
- 4.5.2 Bargaining Power of Buyers
- 4.5.3 Threat of New Entrants
- 4.5.4 Threat of Substitutes
- 4.5.5 Degree of Competition
5 Market Size and Growth Forecasts (Value)
- 5.1 By Product Type
- 5.1.1 Isotropic Graphite
- 5.1.2 Extruded Graphite
- 5.1.3 Molded Graphite
- 5.1.4 Other Product Types
- 5.2 By End-user Industry
- 5.2.1 Foundry and Metallurgy
- 5.2.2 Electronics
- 5.2.3 Photovoltaic
- 5.2.4 Other End-user Indsutries
- 5.3 By Geography
- 5.3.1 Asia-Pacific
- 5.3.1.1 China
- 5.3.1.2 India
- 5.3.1.3 Japan
- 5.3.1.4 South Korea
- 5.3.1.5 Rest of Asia-Pacific
- 5.3.2 North America
- 5.3.2.1 United States
- 5.3.2.2 Canada
- 5.3.2.3 Mexico
- 5.3.3 Europe
- 5.3.3.1 Germany
- 5.3.3.2 United Kingdom
- 5.3.3.3 France
- 5.3.3.4 Italy
- 5.3.3.5 Russia
- 5.3.3.6 Rest of Europe
- 5.3.4 South America
- 5.3.4.1 Brazil
- 5.3.4.2 Argentina
- 5.3.4.3 Rest of South America
- 5.3.5 Middle-East and Africa
- 5.3.5.1 Saudi Arabia
- 5.3.5.2 South Africa
- 5.3.5.3 United Arab Emirates
- 5.3.5.4 Rest of Middle-East and Africa
- 5.3.1 Asia-Pacific
6 Competitive Landscape
- 6.1 Market Concentration
- 6.2 Strategic Moves
- 6.3 Market Share(%)/Ranking Analysis
- 6.4 Company Profiles (includes Global level Overview, Market level overview, Core Segments, Financials as available, Strategic Information, Products and Services, and Recent Developments)
- 6.4.1 Entegris
- 6.4.2 Fangda Carbon New Material Co. Ltd
- 6.4.3 GCM CORPORATION Ltd
- 6.4.4 GrafTech International
- 6.4.5 Graphite India Limited
- 6.4.6 Mersen Property
- 6.4.7 Morgan Advanced Materials Plc
- 6.4.8 Nippon Carbon Co. Ltd
- 6.4.9 Pingdingshan City Kaiyuan Specialty Graphite Ltd
- 6.4.10 Schunk Carbon Technology
- 6.4.11 SEC CARBON, Limited
- 6.4.12 SGL Carbon
- 6.4.13 Tokai Carbon Co., Ltd.
- 6.4.14 Toyo Tanso Co., Ltd.
- 6.4.15 Yichang Xincheng Graphite Co., Ltd.
7 Market Opportunities and Future Outlook
- 7.1 White-space and Unmet-need Assessment


