
|
시장보고서
상품코드
2121489
소매 분석 : 시장 점유율 분석, 업계 동향과 통계, 성장 예측(2026-2031년)Retail Analytics - Market Share Analysis, Industry Trends & Statistics, Growth Forecasts (2026 - 2031) |
||||||
 Mordor Intelligence
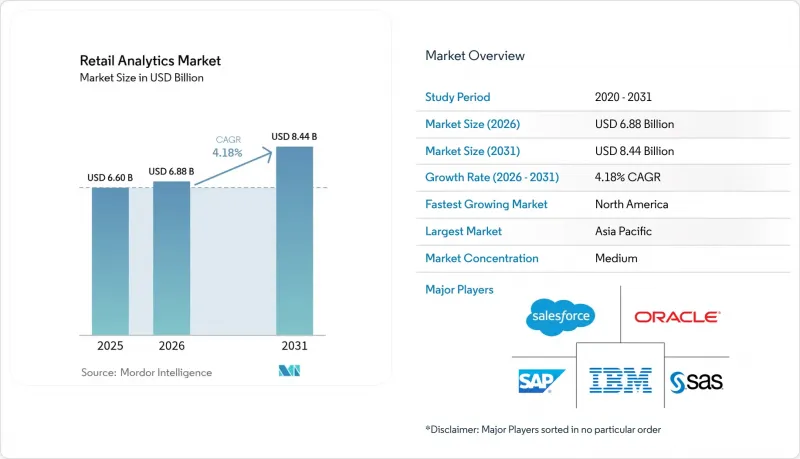
Mordor Intelligence에 의하면, 2026년 소매 분석 시장 규모는 68억 8,000만 달러로 추정되며, 2025년 66억 달러에서 2031년에는 84억 4,000만 달러에 달할 것으로 예측됩니다.
또한 2026-2031년 연평균 성장률(CAGR) 4.18%를 기록할 전망입니다.
본 보고서는 솔루션(소프트웨어 및 서비스), 도입 형태(클라우드, On-Premise, 하이브리드), 기능(고객 관리, 공급망 관리 등), 소매 형태(오프라인 매장, 순수 전자상거래, 옴니채널 소매업체), 지역(북미, 남미, 유럽 등)별로 분류되어 있습니다. 시장 전망은 금액(달러) 기준으로 제시되어 있습니다.
세계 소매 분석 시장 동향 및 인사이트
옴니채널에서 데이터량의 폭발적 증가
소매업체들은 현재 지난 몇 년간을 훨씬 능가하는 방대한 양의 거래 데이터, 행동 데이터, 소셜 시그널을 수집하고 있으며, 확장 가능한 분석 플랫폼이 필수적입니다. 데이터 증가 속도에 따라 매장, 전자상거래 및 제3자 피드를 통합하고, 거의 실시간으로 보고서를 작성할 수 있도록 지원하는 통합 데이터 레이크에 대한 투자가 진행되고 있습니다. 신속한 패턴 인식 능력을 습득한 사업자는 가격 책정의 민첩성을 높이고, 수요 예측의 정확도를 향상시키며, 재고 회전율을 높일 수 있으며, 이러한 요소들이 결합되어 매출 총이익률 향상으로 이어집니다. 이러한 급증하는 데이터를 관리하는 것은 클라우드 수요의 가속화로도 이어집니다. 유연한 인프라를 통해 피크 시간대의 성능 병목 현상을 방지할 수 있기 때문입니다. 그 결과, 분석 성숙도는 비즈니스의 회복력을 측정하는 지표가 됩니다.
실시간 처방적 인사이트를 가능하게 하는 AI/ML의 발전
머신러닝을 활용한 수요 예측을 통해 밸류체인상의 오류와 판매 기회 손실이 감소하는 한편, 컴퓨터 비전 용도는 판매 현장까지 인텔리전스를 확장하고 있습니다. AI를 추천 엔진에 통합한 소매업체들은 출력이 기술적인 대시보드에서 자동화된 의사 결정으로 전환됨에 따라 새로운 교차 판매 수익원을 확보하고 고객 생애 가치를 향상시키고 있습니다. 언어, 시각, 구조화된 데이터를 융합한 멀티모달 모델은 통합된 인텔리전스 계층을 창출하여 기능 간의 사일로화를 해소합니다. 이러한 변화는 소매업체가 요구하는 인재상을 재정의하는 동시에 벤더 선정 기준도 재구성하고 있으며, 현재는 미리 구축된 설명 가능한 모델이 중요시되고 있습니다.
데이터 개인정보 보호 규정 및 규정 준수 비용
GDPR(EU 개인정보보호규정) 및 CCPA와 같은 개인정보 보호법의 강화로 인해 소매업체는 동의 및 데이터 최소화 규칙을 준수하기 위해 데이터 파이프라인을 재구축할 수밖에 없게 되었습니다. 현재 현대화 예산 중 기밀 정보를 암호화하고 관리하는 보안 도구에 대한 배분이 증가하고 있으며, 그 결과 분석 기술 혁신에 할당되는 자금이 축소되고 있습니다. 국경을 넘어 사업을 전개하는 소매업체는 복잡한 규정 준수 요건에 직면하고 있으며, 이로 인해 세계 시장 진출 시 도입 주기가 장기화되고 있습니다. ‘프라이버시 바이 디자인(Privacy by Design)’ 프레임워크는 규제 위험을 줄이는 데 기여하는 한편, 데이터의 세분화 수준을 제한하게 되어 규제가 엄격한 시장에서는 고급 분석의 적용 범위를 좁힐 가능성이 있습니다. 따라서 보호 의무와 분석에 대한 의지 간의 상호작용은 여전히 중요한 전략적 균형 조정 과제로 남아 있습니다.
부문 분석
2025년에는 프로젝트의 61.55%가 클라우드 배포를 차지할 것으로 예상되며, 2031년까지 연평균 성장률(CAGR) 9.22%로 성장할 전망입니다. 구독 기반 가격 책정을 통해 자본 지출 부담을 최소화하고, 유연한 컴퓨팅 능력을 통해 소매업체는 성능 저하 없이 판촉 캠페인으로 인한 트래픽 급증을 처리할 수 있게 됩니다. 일부 체인의 경우 데이터 주권 및 지연 시간 요건을 충족하기 위해 기밀 데이터를 On-Premise에 보관하고 있지만, 로컬 데이터 스토리지와 클라우드 컴퓨팅을 융합한 하이브리드 아키텍처가 전략적 타협점으로 부상하고 있습니다. 이러한 하이브리드 설계를 통해 부정 감지 등 미션 크리티컬한 워크로드의 왕복 시간을 단축하는 동시에, 분석 모델 훈련에는 클라우드의 비용 효율성을 활용할 수 있습니다. 그 결과, 도입 결정은 ‘클라우드 퍼스트’나 ‘On-Premise’와 같은 획일적인 접근 방식이 아닌, 워크로드의 특성에 기반하여 이루어지고 있습니다.
2025년에는 순수 전자상거래 소매업체가 도입 건수의 59.30%를 차지할 것으로 예상되며, 앞으로도 연평균 성장률(CAGR) 8.85%로 다른 업종을 웃도는 성장을 이어갈 전망입니다. 이러한 기업들의 디지털 네이티브 아키텍처 덕분에 레거시 시스템과의 통합이라는 장벽 없이 예측 모델을 신속하게 도입할 수 있으며, 클릭 하나하나마다 고객 경험을 최적화할 수 있게 됩니다. 오프라인 매장을 운영하는 사업자는 센서, RFID, 컴퓨터 비전을 도입하여 데이터 격차를 해소하고, 매장 내 행동을 실용적인 데이터로 변환하고 있습니다. 옴니채널 체인은 온라인과 매장의 인사이트를 통합하는 ‘통합 상거래 분석(Unified Commerce Analytics)’을 도입하여, 크로스채널 재고 배분 및 주문 처리 경로를 개선하고 있습니다. 이러한 다양한 우선순위는 비즈니스 모델이 분석 로드맵을 결정하는 한편, 모든 업태에서 더 신속하고 세밀한 인사이트에 대한 요구가 공통적으로 존재함을 보여줍니다.
지역별 분석
북미는 견고한 클라우드 인프라, 높은 전자상거래 보급률, 주요 분석 벤더와의 지리적 근접성 덕분에 2025년에 매출 점유율 38.05%로 소매 분석 시장을 주도했습니다. 미국의 소매업체들은 2025년에 기술 예산을 증액할 계획이며, 그 중 가장 큰 비중을 고객 데이터 플랫폼과 AI 기반 의사결정 엔진에 할당할 예정입니다. 캐나다는 약간 뒤처져 있지만, 성숙한 시장에서 차별화를 꾀하기 위해 고객 분석에 막대한 투자를 하고 있는 반면, 멕시코는 물류 변동성에 대처하기 위해 공급망 최적화를 중시하고 있습니다.
아시아태평양은 전자상거래의 폭발적인 성장, 스마트폰 보급 확대, 그리고 야심 찬 디지털 전환(DX) 프로그램의 견인에 힘입어 2031년까지 연평균 성장률(CAGR) 6.09%라는 가장 높은 성장률을 기록할 전망입니다. 중국은 결제, 배송, 커뮤니티 참여 데이터를 통합하여 엔드투엔드 인사이트 루프를 창출하는 소셜 커머스 분석의 선구자가 되고 있습니다. 인도의 다양한 소비자 환경은 소매업체들이 도시와 농촌 지역에서 상품 구성을 최적화하는 예측 모델을 도입하도록 뒷받침하고 있습니다. 일본과 한국에서는 오프라인 매장 활성화를 위해 컴퓨터 비전을 활용한 방문객 수 측정 등 매장 중심의 분석을 중시하고 있습니다. 유럽은 영국, 독일, 프랑스의 정교한 소매 시스템을 기반으로 여전히 중요한 입지를 유지하고 있습니다. 엄격한 개인정보 보호 규제로 인해 데이터 거주지와 클라우드 확장성을 양립시키는 하이브리드 방식의 도입이 진행되고 있습니다. 소매업체들이 조달 및 포장 관련 의사결정의 지침으로 환경 지표를 활용함에 따라, 지속가능성 분석이 주목받고 있습니다. 라틴아메리카의 성장은 브라질과 아르헨티나에 집중되어 있으며, 이들 국가에서는 분석이 환율 변동 관리 및 지역 맞춤형 프로모션 최적화에 기여하고 있습니다. 중동 및 아프리카는 여전히 규모는 작지만, 이스라엘이나 아랍에미리트(UAE) 등 시장에서는 활발한 움직임이 관찰되고 있으며, 명품 소매업 및 관광업이 고객 경험 분석 도입을 가속화하고 있습니다.
기타 혜택:
- 엑셀 형식 시장 예측(ME) 시트
- 3개월간의 애널리스트 지원
자주 묻는 질문
목차
제1장 서론
제2장 조사 방법
제3장 주요 요약
제4장 시장 구도
제5장 시장 규모와 성장 예측
제6장 경쟁 구도
제7장 시장 기회와 향후 전망
LSH 26.09.09According to Mordor Intelligence, the retail analytics market size in 2026 is estimated at USD 6.88 billion, growing from 2025 value of USD 6.60 billion with 2031 projections showing USD 8.44 billion, growing at 4.18% CAGR over 2026-2031.
This report is Segmented by Solutions (Software, and Services), Deployment (Cloud, On-Premises, and Hybrid), Function (Customer Management, Supply Chain Management, and More), Retail Format (Brick-And-Mortar Stores, Pure-Play E-Commerce, and Omnichannel Retailers), Geography (North America, South America, Europe, and More). The Market Forecasts are Provided in Terms of Value (USD).
Global Retail Analytics Market Trends and Insights
Omnichannel data-volume explosion
Retailers now ingest vast pools of transaction, behavioural, and social signals that dwarf prior years and mandate scalable analytics platforms. The pace of data growth is prompting investments in unified data lakes that consolidate store, e-commerce, and third-party feeds to support near real-time reporting. Operators that master rapid pattern recognition improve pricing agility, sharpen demand forecasts, and raise inventory turns, which collectively push gross-margin lift. Managing this surge also accelerates cloud demand because elastic infrastructure prevents performance bottlenecks during peak events. Consequently, analytic maturity becomes a barometer for commercial resilience.
AI/ML advances enabling real-time prescriptive insights
Machine-learning-powered demand sensing is reducing supply-chain errors and missed sales opportunities, while computer vision applications extend intelligence to the sales floor. Retailers that embed AI into recommendation engines capture new cross-sell revenue streams and improve lifetime customer value as output moves from descriptive dashboards to automated decisions. Multimodal models that blend language, vision, and structured data produce unified intelligence layers that break down functional silos. These shifts are redefining the talent profiles retailers seek and are reshaping vendor selection criteria, with emphasis now on pre-built, explainable models.
Data-privacy regulation and compliance costs
Tightening privacy laws such as GDPR and CCPA compel retailers to re-engineer data pipelines to uphold consent and minimisation rules. Modernisation budgets now allocate growing shares to security tooling that encrypts and governs sensitive information, diverting funds from analytics innovation. Cross-border retailers face complex compliance matrices that elongate deployment cycles for global rollouts. Privacy-by-design frameworks help reduce regulatory exposure but also limit data granularity, which may curb the scope of advanced analytics in high-stringency markets. The interplay between protection mandates and analytics ambitions, therefore, remains a key strategic balancing act.
Other drivers and restraints analyzed in the detailed report include:
- Uptake of cloud analytics lowering TCO
- Demand for hyper-personalised shopping journeys
- Legacy IT stacks and analytics skills gap
For complete list of drivers and restraints, kindly check the Table Of Contents.
Segment Analysis
Cloud deployments captured 61.55% of projects in 2025 and will grow at a 9.22% CAGR to 2031. Subscription pricing minimises capital commitments, and elastic compute equips retailers to handle promotional peaks without performance dips. Although some chains retain sensitive data on-site to satisfy sovereignty and latency requirements, hybrid architectures that blend local data storage with cloud compute are emerging as a strategic middle ground. These hybrid designs reduce round-trip times for mission-critical workloads such as fraud detection while leveraging cloud economics for analytics model training. As a result, deployment choices increasingly hinge on workload characteristics rather than a blanket cloud-first or on-premises stance.
Pure-play e-commerce retailers captured 59.30% of deployments in 2025 and will continue to outgrow other formats at a 8.85% CAGR. Their digital-native architectures enable rapid adoption of predictive models without legacy integration hurdles, allowing them to refine experiences at every click. Brick-and-mortar operators are bridging the data gap by adding sensors, RFID, and computer vision to convert in-store behaviour into actionable data. Omnichannel chains adopt unified commerce analytics that merge online and store insights to improve cross-channel stock allocation and fulfilment routing. These varied priorities illustrate that business model dictates analytics roadmaps, yet all formats converge on the need for faster, more granular insights.
Complete Report Scope:
- By Solution
- Software
- Services
- By Deployment Model
- Cloud
- On-premise
- Hybrid
- By Function
- Customer Management
- In-store Operation - Inventory Management
- In-store Operation - Performance Management
- Supply Chain Management
- Marketing and Merchandising - Pricing/Yield
- Other Functions - Transportation Management
- Other Functions - Order Management
- By Retail Format
- Brick-and-Mortar Stores
- Pure-play E-commerce
- Omnichannel Retailers
- By Geography
- North America
- United States
- Canada
- Mexico
- Europe
- United Kingdom
- Germany
- France
- Italy
- Rest of Europe
- Asia-Pacific
- China
- Japan
- India
- South Korea
- Rest of Asia-Pacific
- Middle East
- Israel
- Saudi Arabia
- United Arab Emirates
- Turkey
- Rest of Middle East
- Africa
- South Africa
- Egypt
- Rest of Africa
- South America
- Brazil
- Argentina
- Rest of South America
- North America
Geography Analysis
North America led the retail analytics market with 38.05% revenue share in 2025, supported by robust cloud infrastructure, deep e-commerce penetration, and proximity to leading analytics vendors. United States retailers plan to raise technology budgets in 2025, directing the largest allocations to customer-data platforms and AI-based decision engines. Canada trails slightly yet invests heavily in customer analytics to differentiate in a mature market, while Mexico emphasises supply-chain optimisation to address logistics volatility.
Asia-Pacific is set to post the fastest CAGR at 6.09% through 2031, propelled by explosive e-commerce growth, increasing smartphone adoption, and ambitious digital transformation programs. China pioneers social-commerce analytics that integrate payment, delivery, and community engagement data, producing end-to-end insight loops. India's diverse consumer landscape encourages retailers to deploy predictive models that tailor assortments across urban and rural zones. Japan and South Korea emphasise store-centric analytics such as computer-vision footfall measurement to revitalise physical outlets. Europe retains a meaningful footprint anchored by sophisticated retail systems in the United Kingdom, Germany, and France. Stringent privacy rules drive adoption of hybrid deployments that balance data residency with cloud scalability. Sustainability analytics is gaining traction as retailers use environmental metrics to guide sourcing and packaging decisions. Latin American growth concentrates in Brazil and Argentina, where analytics helps manage currency volatility and optimise localised promotions. Middle East and Africa remain smaller but active in markets such as Israel and the United Arab Emirates, where luxury retail and tourism accelerate the adoption of customer experience analytics.
- SAP SE
- IBM Corporation
- Oracle Corporation
- Salesforce Inc. (Tableau)
- SAS Institute Inc.
- QlikTech International AB
- Microsoft Corp. (Power BI, Dynamics 365)
- Amazon Web Services Inc. (QuickSight)
- Google LLC (Looker)
- Blue Yonder Inc.
- Dunnhumby Ltd.
- Teradata Corp.
- RetailNext Inc.
- Zebra Technologies Corp.
- Altair Engineering Inc.
- Alteryx Inc.
- MicroStrategy Inc.
- ThoughtSpot Inc.
- Fujitsu Ltd.
- Infor Inc.
Additional Benefits:
- The market estimate (ME) sheet in Excel format
- 3 months of analyst support
TABLE OF CONTENTS
1 INTRODUCTION
- 1.1 Study Assumptions and Market Definition
- 1.2 Scope of the Study
2 RESEARCH METHODOLOGY
3 EXECUTIVE SUMMARY
4 MARKET LANDSCAPE
- 4.1 Market Overview
- 4.2 Market Drivers
- 4.2.1 Omnichannel data-volume explosion
- 4.2.2 AI/ML advances for real-time prescriptive insights
- 4.2.3 Uptake of cloud analytics lowering ownership costs
- 4.2.4 Demand for hyper-personalised shopping journeys
- 4.3 Market Restraints
- 4.3.1 Data-privacy regulation and compliance costs
- 4.3.2 Legacy IT stacks and analytics skills gap
- 4.4 Supply Chain Analysis
- 4.5 Regulatory Landscape
- 4.6 Technological Outlook
- 4.7 Porter's Five Forces Analysis
- 4.7.1 Threat of New Entrants
- 4.7.2 Bargaining Power of Buyers
- 4.7.3 Bargaining Power of Suppliers
- 4.7.4 Threat of Substitute Products
- 4.7.5 Intensity of Competitive Rivalry
- 4.8 Assessment of the Impact of Macroeconomic Trends on the Market
5 MARKET SIZE AND GROWTH FORECASTS (VALUE)
- 5.1 By Solution
- 5.1.1 Software
- 5.1.2 Services
- 5.2 By Deployment Model
- 5.2.1 Cloud
- 5.2.2 On-premise
- 5.2.3 Hybrid
- 5.3 By Function
- 5.3.1 Customer Management
- 5.3.2 In-store Operation - Inventory Management
- 5.3.3 In-store Operation - Performance Management
- 5.3.4 Supply Chain Management
- 5.3.5 Marketing and Merchandising - Pricing/Yield
- 5.3.6 Other Functions - Transportation Management
- 5.3.7 Other Functions - Order Management
- 5.4 By Retail Format
- 5.4.1 Brick-and-Mortar Stores
- 5.4.2 Pure-play E-commerce
- 5.4.3 Omnichannel Retailers
- 5.5 By Geography
- 5.5.1 North America
- 5.5.1.1 United States
- 5.5.1.2 Canada
- 5.5.1.3 Mexico
- 5.5.2 Europe
- 5.5.2.1 United Kingdom
- 5.5.2.2 Germany
- 5.5.2.3 France
- 5.5.2.4 Italy
- 5.5.2.5 Rest of Europe
- 5.5.3 Asia-Pacific
- 5.5.3.1 China
- 5.5.3.2 Japan
- 5.5.3.3 India
- 5.5.3.4 South Korea
- 5.5.3.5 Rest of Asia-Pacific
- 5.5.4 Middle East
- 5.5.4.1 Israel
- 5.5.4.2 Saudi Arabia
- 5.5.4.3 United Arab Emirates
- 5.5.4.4 Turkey
- 5.5.4.5 Rest of Middle East
- 5.5.5 Africa
- 5.5.5.1 South Africa
- 5.5.5.2 Egypt
- 5.5.5.3 Rest of Africa
- 5.5.6 South America
- 5.5.6.1 Brazil
- 5.5.6.2 Argentina
- 5.5.6.3 Rest of South America
- 5.5.1 North America
6 COMPETITIVE LANDSCAPE
- 6.1 Market Concentration
- 6.2 Strategic Moves
- 6.3 Market Share Analysis
- 6.4 Company Profiles (includes Global level Overview, Market level overview, Core Segments, Financials as available, Strategic Information, Market Rank/Share for key companies, Products & Services, and Recent Developments)
- 6.4.1 SAP SE
- 6.4.2 IBM Corporation
- 6.4.3 Oracle Corporation
- 6.4.4 Salesforce Inc. (Tableau)
- 6.4.5 SAS Institute Inc.
- 6.4.6 QlikTech International AB
- 6.4.7 Microsoft Corp. (Power BI, Dynamics 365)
- 6.4.8 Amazon Web Services Inc. (QuickSight)
- 6.4.9 Google LLC (Looker)
- 6.4.10 Blue Yonder Inc.
- 6.4.11 Dunnhumby Ltd.
- 6.4.12 Teradata Corp.
- 6.4.13 RetailNext Inc.
- 6.4.14 Zebra Technologies Corp.
- 6.4.15 Altair Engineering Inc.
- 6.4.16 Alteryx Inc.
- 6.4.17 MicroStrategy Inc.
- 6.4.18 ThoughtSpot Inc.
- 6.4.19 Fujitsu Ltd.
- 6.4.20 Infor Inc.
7 MARKET OPPORTUNITIES AND FUTURE OUTLOOK
- 7.1 White-space and Unmet-Need Assessment