|
시장보고서
상품코드
2121609
유틸리티 및 에너지 분석 : 시장 점유율 분석, 업계 동향과 통계, 성장 예측(2026-2031년)Utility And Energy Analytics - Market Share Analysis, Industry Trends & Statistics, Growth Forecasts (2026 - 2031) |
||||||
 Mordor Intelligence
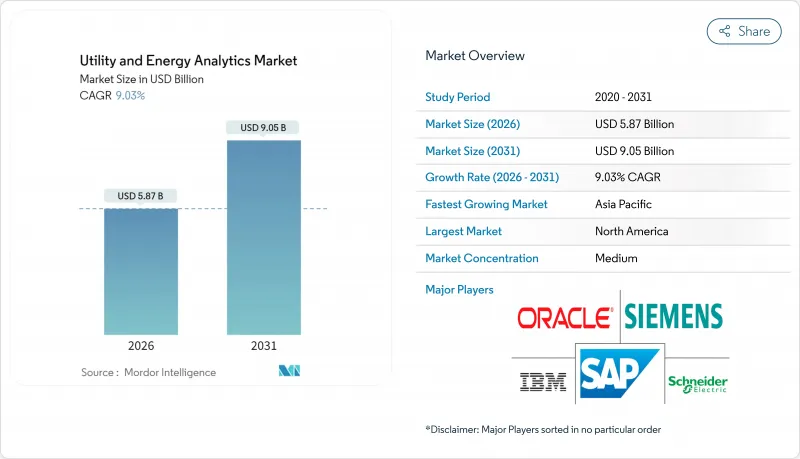
Mordor Intelligence에 의하면, 유틸리티 및 에너지 분석 시장 규모는 2026년에 58억 7,000만 달러에 이르고, 2031년까지 90억 5,000만 달러에 이를 것으로 예측되며, CAGR은 9.03%를 기록할 전망입니다.
본 보고서는 배포 방식(클라우드, 하이브리드, 기타), 구성 요소(소프트웨어, 서비스, 기타), 용도(계량기 운영·데이터 관리, 부하·발전 예측, 기타), 최종 사용자(발전 사업자, 송배전 사업자, 기타), 유틸리티 유형(전력, 가스, 기타) 및 지역별로 분류되어 있습니다. 시장 전망은 금액(달러) 기준으로 제시됩니다.
전 세계 유틸리티 및 에너지 분석 시장 동향 및 인사이트
재생에너지 도입 의무 및 탈탄소화를 위한 투자
유럽연합(EU) 및 캘리포니아주의 청정 에너지 관련 법규에 따라, 유틸리티자는 확률적 최적화와 정밀한 예측을 활용하여 증가하는 재생에너지 발전 도입률에 대응해야 합니다. 위성 이미지, 수치 기상 예보 및 과거 발전 실적을 통합한 머신러닝 모델을 통해 재생에너지 예측 오차는 수익성이 높은 부가 서비스 참여 기준인 평균 절대 오차율(MAPE) 5% 미만으로 낮아졌습니다. 2023년 전 세계 재생에너지 설비 용량 증가량은 510GW에 달하여 전년 대비 50% 증가했습니다. 이에 따라 변동성이 큰 발전과 유연성이 부족한 베이스로드 자산을 조화시키는 분석의 필요성이 더욱 커지고 있습니다. 2023년 탈탄소화를 위한 설비 투자액은 1조 8,000억 달러를 초과했으며, 그중 점점 더 큰 비중이 화석 연료 발전소의 폐쇄를 연기하기 위한 소프트웨어에 투입되고 있습니다. 기후 관련 재무 정보 공개 태스크포스(TCFD)와 같은 공개 프레임워크는 시나리오 모델링을 의무화하고 있으며, 거버넌스 및 투자자 관계에 분석 기능을 통합할 것을 요구하고 있습니다.
AMI 2.0의 전개와 엣지 분석의 도입
2세대 스마트 계량기 프로그램은 테라바이트 규모의 일일 데이터를 생성하고 있으며, 실시간 검증, 변조 감지 및 고객 세분화가 요구되고 있습니다. 인도의 2억 5,000만 대 규모 계량기 입찰과 미국의 그리드 현대화 이니셔티브는 대역폭 비용을 60% 절감하고, 현지 데이터 상주 요건을 충족하는 엣지 분석의 보급을 가속화하고 있습니다. IEEE 표준 2030.5는 통신 프로토콜을 통합하여 계량기 공급업체와 분석 플랫폼 간의 상호 운용성을 촉진하고 있습니다. 전력 회사는 세분화된 소비 패턴을 활용하여 3-5%의 비기술적 손실을 억제하고, 새로운 인프라를 구축하지 않고도 피크 수요를 줄이는 대상에 맞춘 효율화 프로그램을 수립하고 있습니다.
레거시 시스템의 OT-IT 통합 비용과 데이터 사일로
수십년전에 도입된 감시 제어 및 데이터 수집(SCADA) 시스템은 독자적인 프로토콜에 의존하고 있어 최신 분석 시스템과의 통합이 어렵습니다. 미국 정부감사원(GAO)의 추산에 따르면, 대규모 투자자 소유의 유틸리티 회사에서 업그레이드 비용은 4,000만-8,000만 달러에 달하며, 소요 기간은 최장 2년에 이르는 것으로 알려져 있습니다. 계량, 정전, GIS, 청구에 관한 데이터 세트가 사일로화되어 있어, 요구에 따른 추출·변환·로드(ETL) 파이프라인 구축이 필요하며, 이는 프로젝트 예산의 40%를 소모하고 있습니다. IEC 61850의 도입이 불완전하기 때문에 북미 변전소의 60%는 실시간 분석을 지원하지 못하고 있습니다. 운영 기술(OT) 팀 내의 조직적인 저항으로 인해 통합이 더욱 지연되고 있으며, 파일럿 프로젝트는 개념 증명(PoC) 단계에서 정체되어 있습니다.
부문 분석
2025년에는 On-Premise 배포가 매출의 53.16%를 차지할 것으로 예상되며, 유틸리티자가 운영 데이터를 직접 관리하는 것을 선호하는 경향이 두드러졌습니다. 하이브리드 아키텍처용 유틸리티 및 에너지 분석 시장 규모는 2026년부터 2031년까지 연평균 성장률(CAGR) 13.07%로 확대될 것으로 예측됩니다. 이는 사업자들이 과거 분석 및 시나리오 모델링을 클라우드로 이전하는 한편, 실시간 제어 워크로드는 로컬에 유지하려는 움직임에 기인합니다. 지방 자치 단체 소속 유틸리티자는 자본 예산을 절감하기 위해 클라우드 네이티브 SaaS(Software-as-a-Service)를 도입하는 반면, 투자자 소유의 유틸리티자는 진화하는 보안 프레임워크에 부합하는 단계적 전환 계획을 채택하고 있습니다. 미국 국립표준기술연구소(NIST)의 지침에 따라 규제상의 모호성이 해소되며 도입이 촉진되고 있습니다. 변전소에서의 엣지 배포를 통해 고장 감지 지연 시간이 밀리초 단위로 단축되며, 중앙 집중형 모델에서는 실현할 수 없는 피더 수준의 전압 조정이 가능해집니다. 또한, 유틸리티자는 엣지 게이트웨이를 활용하여 클라우드로 전송하기 전에 기밀성이 높은 원격 측정 데이터를 필터링함으로써 데이터 주권에 관한 규정을 준수하고 있습니다. 재생에너지의 간헐성이 심화됨에 따라 몬테카를로 시뮬레이션을 위한 탄력적인 연산 능력이 필수적이 되어, 이는 유틸리티 및 에너지 분석 시장에서 하이브리드 모델의 지속적인 보급을 뒷받침하고 있습니다.
하이브리드 모델로의 전환은 재해 복구 목표와도 부합하며, 물리적 인프라를 중복하지 않고 지역 간 원활한 워크로드 페일오버를 가능하게 합니다. On-Premise, 클라우드, 엣지 노드에 걸친 통합 관리를 제공하는 벤더는 운영상의 복잡성을 줄이고, 단일 관리 화면을 통한 모니터링을 원하는 전력 회사를 끌어들이고 있습니다. 현재경쟁 구도에는 업계 고유의 보안 통제를 인증하는 하이퍼스케일러도 진입하여 실사 부담을 경감시키고 있습니다. 그러나 유틸리티자는 정보 기술(IT) 네트워크와 운영 기술(OT) 네트워크 간의 횡단 이동을 방지하기 위해 여전히 견고한 ID 및 액세스 관리에 대한 투자가 필요합니다. 하이브리드 배포와 결합된 관리형 서비스 계약은 기술 이전을 가속화하고 인력 부족을 완화합니다. 그 결과, 공공 유틸리티 및 에너지 분석 시장에서는 예측 기간이 끝날 무렵 하이브리드 모델이 순수한 On-Premise 모델을 추월할 것으로 보입니다.
2025년에는 소프트웨어 플랫폼이 구성 요소별 매출의 65.72%를 차지할 것으로 예상되며, 이는 계량 데이터 관리 및 정전 관리 제품군이 정착되었음을 반영합니다. 그럼에도 불구하고, 유틸리티자들이 통합, 모델 조정, 변경 관리에 있어 자문 지원에 의존하고 있기 때문에 서비스 부문이 연평균 성장률(CAGR) 12.21%로 가장 빠르게 성장하고 있습니다. 오픈소스 프레임워크는 라이선스 비용을 절감하지만, 맞춤화가 필요하기 때문에 서비스 지출을 촉진하고 있습니다. 구독형 가격 책정으로 인해 소프트웨어 초기 도입 수익이 축소됨에 따라, 유틸리티 및 에너지 분석 시장에서 서비스가 차지하는 비중은 확대될 것으로 예측됩니다. 시스템 통합사업자들은 운영 위험을 부담하는 다년 계약의 관리형 서비스를 번들로 제공하고 있으며, 이를 통해 벤더의 인센티브와 유틸리티자의 성과가 일치하게 되었습니다. 하드웨어 수익은 여전히 점진적이지만 전략적인 위치를 차지하고 있으며, 엣지 분석에 필수적인 지능형 전자 장치, 게이트웨이, 센서 등을 포함합니다.
지속적인 AI 모델 유지 관리가 서비스 재계약을 촉진하고 있습니다. 사내에 데이터 사이언스 팀을 보유하지 않은 유틸리티자는 변화하는 부하 패턴이나 설비의 노후화에 대응하기 위해 벤더에게 정기적인 재교육을 위탁하고 있습니다. 서비스 제공업체는 사이버 보안 모니터링도 제공하여 진화하는 기준에 대한 준수를 보장하고 있습니다. 유틸리티자가 자산 관리의 디지털화를 추진함에 따라, 비즈니스 프로세스 재구축에 관한 컨설팅 수요가 증가하고 있습니다. 전문 지식과 신속한 도입 템플릿을 통해 차별화를 꾀하는 벤더는 높은 단가를 확보하고 있습니다. 이러한 요인들이 복합적으로 작용하여, 유틸리티 및 에너지 분석 시장의 서비스 사업이 견조한 성장 전망을 보이고 있습니다.
지역별 분석
2025년, 북미는 유틸리티 및 에너지 분석 시장에서 34.87%의 점유율을 차지하며 시장을 주도했습니다. 이는 분산형 자원을 도매 시장에 통합하도록 한 연방에너지규제위원회(FERC)의 지침에 힘입은 결과입니다. 미국에서는 105억 달러 규모의 송전망 업그레이드 자금을 통해 프로젝트 선정 과정에 분석이 반영되고 있는 반면, 캐나다에서는 발전과 홍수 조절을 병행하기 위해 수력 발전용 저수지의 최적화가 진행되고 있습니다. 멕시코에서는 규제 불확실성으로 인해 도입 움직임이 주춤하고 있지만, 민간 전력 회사에서는 현대화 프로젝트가 계속되고 있습니다. 캘리포니아주와 텍사스주의 높은 재생에너지 보급률은 확률론적 예측을 필요로 하며, 이것이 대륙 전체의 투자를 뒷받침하고 있습니다. 또한, 전력 회사는 산불 위험 완화를 위해 분석 기술을 활용하고 있으며, 기상 데이터와 식생 모델을 통합하여 송전선 주변의 수목 제거 우선순위를 결정하고 있습니다.
아시아태평양은 2031년까지 연평균 성장률(CAGR) 9.84%로 성장하고 있습니다. 중국이 2030년까지 풍력 및 태양광 발전 용량을 1,200기가와트로 확대하겠다는 계획을 실현하려면, 각 성의 송전망 현대화에 1,000억 달러 이상의 지출이 필요합니다. 인도에서는 2억 5,000만 대의 스마트 계량기 도입을 통해 여러 주에서 20% 이상의 총 손실률을 대폭 줄이는 것을 목표로 하고 있습니다. 일본의 가상 발전소(VPP) 시범 사업에서는 가정용 축전지를 집약하여 도매 전력 시장에 참여하고 있는 반면, 한국의 ‘그린 뉴딜’에서는 재생에너지와 스마트 그리드에 950억 달러가 배정되었습니다. 호주에서는 5분 단위 정산 제도 도입과 옥상 태양광 발전 보급률 상승에 따라 1시간 미만의 정밀도로 분석할 필요성이 높아지고 있습니다. 동남아시아국가연합(ASEAN)의 지역적 송전망 규격 조화는 국경을 초월한 발전 명령의 최적화를 가능하게 하여, 유틸리티 및 에너지 분석 시장의 확대로 이어집니다.
유럽의 청정 에너지 패키지에서는 2025년까지 모든 시장에서 수요 반응 및 전력 저장 장치에 대한 접근을 의무화하고 있어, 분산형 유연성에 대한 분석을 촉진하고 있습니다. 독일의 ‘에너지 전환(Energiewende)’에 따라 2023년에는 재생에너지의 전력 비중이 50%를 넘어설 전망이며, 송전 사업자는 양방향 전력 흐름을 관리할 수밖에 없게 되었습니다. 영국의 종합적인 네트워크 설계는 탄소 중립 달성을 위한 로드맵과 연계된 580억 파운드의 송전 투자를 뒷받침하고 있습니다. 중동에서는 사우디아라비아가 2030년까지 재생에너지에 500억 달러를 투자하겠다고 약속했으며, 아랍에미리트(UAE)는 수요 예측에 인공지능(AI)을 활용하고 있습니다. 아프리카, 특히 나이지리아와 케냐에서의 미니그리드 구축은 엣지 네이티브 분석에 새로운 비즈니스 기회를 창출하고 있습니다. 이러한 동향으로 인해 유틸리티 및 에너지 분석 시장의 지리적 다변화가 확고해지고 있습니다.
기타 혜택:
- 엑셀 형식 시장 예측(ME) 시트
- 3개월간의 애널리스트 지원
자주 묻는 질문
목차
제1장 서론
제2장 조사 방법
제3장 주요 요약
제4장 시장 구도
제5장 시장 규모와 성장 예측
제6장 경쟁 구도
제7장 시장 기회와 향후 전망
LSH 26.09.02According to Mordor Intelligence, the utility and energy analytics market size is USD 5.87 billion in 2026 and is projected to reach USD 9.05 billion by 2031, reflecting a 9.03% CAGR.
This report is Segmented by Deployment (Cloud, Hybrid, and More), Component (Software, Services, and More), Application (Meter Operations and Data Management, Load and Generation Forecasting, and More), End-User (Generation Utilities, Transmission and Distribution Operators, and More), Utility Type (Electric, Gas, and More), and Geography. The Market Forecasts are Provided in Terms of Value (USD).
Global Utility And Energy Analytics Market Trends and Insights
Mandatory Renewable Mandates and Decarbonisation Spend
Clean-energy statutes in the European Union and California force utilities to manage higher renewable penetration with stochastic optimization and granular forecasting. Machine-learning models that merge satellite imagery, numerical weather prediction, and historical generation now cut renewable forecast error below 5% mean absolute percentage error, the threshold for profitable ancillary-services participation. Global renewable capacity additions hit 510 GW in 2023, a 50% rise year-over-year, escalating the need for analytics that harmonize variable generation with inflexible baseload assets. Capital expenditure on decarbonization surpassed USD 1.8 trillion in 2023, and a growing slice flows to software that defers fossil retirements. Disclosure frameworks such as the Task Force on Climate-related Financial Disclosures oblige scenario modeling, embedding analytics into governance and investor relations.
AMI 2.0 Roll-out and Edge Analytics Adoption
Second-generation smart-meter programs generate terabyte-scale daily data, requiring real-time validation, tamper detection, and customer segmentation. India's 250 million-meter tender and the United States Grid Modernization Initiative are accelerating edge analytics that trim bandwidth costs by 60% and satisfy local data-residency laws. IEEE Standard 2030.5 harmonizes communication protocols, facilitating interoperability between meter vendors and analytics platforms. Utilities leverage granular consumption patterns to curb non-technical losses of 3-5% and to craft targeted efficiency programs that shave peak demand without new infrastructure.
Legacy OT-IT Integration Costs and Data Silos
Supervisory control and data acquisition systems installed decades ago rely on proprietary protocols that resist modern analytics integration. The United States Government Accountability Office pegs upgrade costs for large investor-owned utilities between USD 40 million and USD 80 million, with timelines stretching up to two years. Siloed datasets across metering, outage, GIS, and billing demand custom extract-transform-load pipelines absorbing 40% of project budgets. Partial adoption of IEC 61850 leaves 60% of North American substations incompatible with real-time analytics. Organizational resistance among operation-technology teams further delays integration, stalling pilots at proof-of-concept stage.
Other drivers and restraints analyzed in the detailed report include:
- Wholesale-Price Volatility Driving Load-Forecast Accuracy
- Cloud-Native Utility-Analytics Frameworks
- Data-Science Talent Shortage In Power Domain
For complete list of drivers and restraints, kindly check the Table Of Contents.
Segment Analysis
On-premise deployments commanded 53.16% revenue in 2025, underscoring utilities' preference for direct control over operational data. The utility and energy analytics market size for hybrid architectures is projected to expand at a 13.07% CAGR between 2026 and 2031 as operators move historical analytics and scenario modeling to the cloud while retaining real-time control workloads locally. Municipal utilities pursue cloud-native software-as-a-service to sidestep capital budgets, whereas investor-owned utilities embrace phased migration plans aligned with evolving security frameworks. National Institute of Standards and Technology guidelines have removed regulatory ambiguity, encouraging adoption. Edge deployments at substations shorten fault-detection latency to milliseconds, enabling feeder-level voltage regulation that centralized models cannot achieve. Utilities also leverage edge gateways to satisfy data-sovereignty rules by filtering sensitive telemetry before cloud transfer. As renewable intermittency intensifies, elastic compute capacity for Monte Carlo simulations becomes indispensable, driving continuous hybrid uptake in the utility and energy analytics market.
The shift toward hybrid models also aligns with disaster-recovery objectives, permitting seamless workload failover across regions without duplicating physical infrastructure. Vendors offering unified management across on-premise, cloud, and edge nodes reduce operational complexity and attract utilities seeking single-pane-of-glass oversight. The competitive landscape now includes hyperscalers that certify industry-specific security controls, lowering due-diligence burden. However, utilities must still invest in robust identity-and-access management to prevent lateral movement between information-technology and operation-technology networks. Managed-service contracts bundled with hybrid deployments expedite skill transfer and mitigate talent shortages. Consequently, the utility and energy analytics market will likely witness hybrid overtaking pure on-premise by the end of the forecast period.
Software platforms delivered 65.72% of component revenue in 2025, reflecting entrenched meter data management and outage suites. Nevertheless, services are growing fastest at 12.21% CAGR because utilities rely on advisory support for integration, model tuning, and change management. Open-source frameworks reduce license fees but demand customization, reinforcing service spend. The utility and energy analytics market size captured by services is expected to widen as subscription pricing compresses upfront software revenue. System integrators bundle multi-year managed services that assume operational risk, aligning vendor incentives with utility outcomes. Hardware revenue remains incremental yet strategic, covering intelligent electronic devices, gateways, and sensors critical for edge analytics.
Ongoing AI model maintenance fuels repeat service engagements. Utilities without in-house data-science teams contract vendors for periodic retraining to account for changing load patterns or equipment aging. Service providers also deliver cybersecurity monitoring, ensuring compliance with evolving standards. As utilities digitize asset management, demand for consulting around business process re-engineering rises. Vendors differentiating through domain expertise and accelerated deployment templates capture premium billable rates. Together, these factors underpin robust growth prospects for services within the utility and energy analytics market.
Complete Report Scope:
- By Deployment
- On-Premise
- Cloud
- Hybrid
- By Component
- Software
- Services
- Hardware / Edge Devices
- By Application
- Meter Operations and Data Management
- Load and Generation Forecasting
- Demand Response and Flexibility
- Distribution Planning and Optimisation
- Asset Performance Management
- Outage Management and Reliability
- By Utility Type
- Electric
- Gas
- Water
- Multi-Utility
- By End-User
- Generation Utilities
- Transmission and Distribution Operators
- Retail Energy Suppliers
- Independent Power Producers
- By Geography
- North America
- United States
- Canada
- Mexico
- South America
- Brazil
- Argentina
- Rest of South America
- Europe
- United Kingdom
- Germany
- France
- Italy
- Spain
- Nordics
- Russia
- Rest of Europe
- Asia-Pacific
- China
- Japan
- India
- South Korea
- Australia and New Zealand
- ASEAN
- Rest of Asia-Pacific
- Middle East
- Saudi Arabia
- United Arab Emirates
- Israel
- Turkey
- Rest of Middle East
- Africa
- South Africa
- Egypt
- Nigeria
- Rest of Africa
- North America
Geography Analysis
North America led the utility and energy analytics market with 34.87% share in 2025, buoyed by Federal Energy Regulatory Commission directives that integrate distributed resources into wholesale markets. United States transmission-upgrade funding of USD 10.5 billion embeds analytics into project selection, while Canada optimizes hydro reservoirs for simultaneous power generation and flood control. Mexico's regulatory uncertainty tempers adoption but modernization projects continue at private utilities. High renewable penetration in California and Texas necessitates probabilistic forecasting, spurring investment across the continent. Utilities also deploy analytics for wildfire risk mitigation, integrating weather data with vegetation models to prioritize line clearing.
Asia-Pacific is advancing at a 9.84% CAGR through 2031. China's plan to reach 1,200 GW of wind and solar by 2030 demands provincial grid-modernization spending above USD 100 billion. India's 250 million smart-meter rollout aims to slash aggregate losses above 20% in several states. Japan's virtual power plant pilots aggregate residential batteries for wholesale participation, while South Korea's Green New Deal allocates USD 95 billion to renewables and smart grids. Australia's five-minute settlement and rising rooftop solar penetration heighten the need for sub-hourly analytics. Regional grid code harmonization under the Association of Southeast Asian Nations will unlock cross-border dispatch optimization, expanding the utility and energy analytics market.
Europe's clean-energy package mandates demand response and storage access to all markets by 2025, catalyzing analytics for distributed flexibility. Germany's Energiewende surpassed 50% renewable electricity in 2023, forcing transmission operators to manage bidirectional power flows. The United Kingdom's holistic network design underwrites GBP 58 billion in transmission investments linked to net-zero pathways. In the Middle East, Saudi Arabia commits USD 50 billion to renewables by 2030, and the United Arab Emirates applies artificial intelligence for demand forecasting. Africa's mini-grid buildout, especially in Nigeria and Kenya, creates greenfield opportunities for edge-native analytics. These developments solidify geographic diversification of the utility and energy analytics market.
- Oracle Corporation
- IBM Corporation
- Siemens AG
- Schneider Electric SE
- ABB Ltd.
- General Electric Company
- SAS Institute Inc.
- SAP SE
- Capgemini SE
- Teradata Corporation
- Hitachi Energy Ltd.
- Landis+Gyr AG
- Itron Inc.
- AutoGrid Systems Inc.
- Wipro Ltd.
- Accenture plc
- Amazon Web Services Utilities
- Microsoft Azure Energy
- Enel X
- Nexant Inc.
- OSIsoft (AVEVA)
- Uptake Technologies
- Bidgely Inc.
- Smarter Grid Solutions
- Energyworx
- C3.ai Inc.
Additional Benefits:
- The market estimate (ME) sheet in Excel format
- 3 months of analyst support
TABLE OF CONTENTS
1 INTRODUCTION
- 1.1 Study Assumptions and Market Definition
- 1.2 Scope of the Study
2 RESEARCH METHODOLOGY
3 EXECUTIVE SUMMARY
4 MARKET LANDSCAPE
- 4.1 Market Overview
- 4.2 Market Drivers
- 4.2.1 Mandatory Renewable Mandates and Decarbonisation Spend
- 4.2.2 AMI 2.0 Roll-out and Edge Analytics Adoption
- 4.2.3 Wholesale-Price Volatility Driving Load-Forecast Accuracy
- 4.2.4 Cloud-Native Utility-Analytics Frameworks
- 4.2.5 AI-Driven Planning for Data-Centre Electricity Surge
- 4.2.6 Digital-Twin Adoption for Transformer Fleet Optimization
- 4.3 Market Restraints
- 4.3.1 Legacy OT-IT Integration Costs and Data Silos
- 4.3.2 Data-Science Talent Shortage in Power Domain
- 4.3.3 Cyber-Security and Data-Sovereignty Concerns
- 4.3.4 Transformer Supply-Chain Bottlenecks Limiting Sensor Retrofits
- 4.4 Industry Value Chain Analysis
- 4.5 Regulatory Landscape
- 4.6 Technological Outlook
- 4.7 Impact of Macroeconomic Factors on the Market
- 4.8 Porter's Five Forces Analysis
- 4.8.1 Bargaining Power of Suppliers
- 4.8.2 Bargaining Power of Buyers
- 4.8.3 Threat of New Entrants
- 4.8.4 Threat of Substitute Products
- 4.8.5 Intensity of Competitive Rivalry
5 MARKET SIZE AND GROWTH FORECASTS (VALUE)
- 5.1 By Deployment
- 5.1.1 On-Premise
- 5.1.2 Cloud
- 5.1.3 Hybrid
- 5.2 By Component
- 5.2.1 Software
- 5.2.2 Services
- 5.2.3 Hardware / Edge Devices
- 5.3 By Application
- 5.3.1 Meter Operations and Data Management
- 5.3.2 Load and Generation Forecasting
- 5.3.3 Demand Response and Flexibility
- 5.3.4 Distribution Planning and Optimisation
- 5.3.5 Asset Performance Management
- 5.3.6 Outage Management and Reliability
- 5.4 By Utility Type
- 5.4.1 Electric
- 5.4.2 Gas
- 5.4.3 Water
- 5.4.4 Multi-Utility
- 5.5 By End-User
- 5.5.1 Generation Utilities
- 5.5.2 Transmission and Distribution Operators
- 5.5.3 Retail Energy Suppliers
- 5.5.4 Independent Power Producers
- 5.6 By Geography
- 5.6.1 North America
- 5.6.1.1 United States
- 5.6.1.2 Canada
- 5.6.1.3 Mexico
- 5.6.2 South America
- 5.6.2.1 Brazil
- 5.6.2.2 Argentina
- 5.6.2.3 Rest of South America
- 5.6.3 Europe
- 5.6.3.1 United Kingdom
- 5.6.3.2 Germany
- 5.6.3.3 France
- 5.6.3.4 Italy
- 5.6.3.5 Spain
- 5.6.3.6 Nordics
- 5.6.3.7 Russia
- 5.6.3.8 Rest of Europe
- 5.6.4 Asia-Pacific
- 5.6.4.1 China
- 5.6.4.2 Japan
- 5.6.4.3 India
- 5.6.4.4 South Korea
- 5.6.4.5 Australia and New Zealand
- 5.6.4.6 ASEAN
- 5.6.4.7 Rest of Asia-Pacific
- 5.6.5 Middle East
- 5.6.5.1 Saudi Arabia
- 5.6.5.2 United Arab Emirates
- 5.6.5.3 Israel
- 5.6.5.4 Turkey
- 5.6.5.5 Rest of Middle East
- 5.6.6 Africa
- 5.6.6.1 South Africa
- 5.6.6.2 Egypt
- 5.6.6.3 Nigeria
- 5.6.6.4 Rest of Africa
- 5.6.1 North America
6 COMPETITIVE LANDSCAPE
- 6.1 Market Concentration
- 6.2 Strategic Moves and Funding
- 6.3 Market Share Analysis
- 6.4 Company Profiles (includes Global Level Overview, Market Level Overview, Core Segments, Financials as available, Strategic Information, Market Rank/Share for Key Companies, Products and Services, and Recent Developments)
- 6.4.1 Oracle Corporation
- 6.4.2 IBM Corporation
- 6.4.3 Siemens AG
- 6.4.4 Schneider Electric SE
- 6.4.5 ABB Ltd.
- 6.4.6 General Electric Company
- 6.4.7 SAS Institute Inc.
- 6.4.8 SAP SE
- 6.4.9 Capgemini SE
- 6.4.10 Teradata Corporation
- 6.4.11 Hitachi Energy Ltd.
- 6.4.12 Landis+Gyr AG
- 6.4.13 Itron Inc.
- 6.4.14 AutoGrid Systems Inc.
- 6.4.15 Wipro Ltd.
- 6.4.16 Accenture plc
- 6.4.17 Amazon Web Services Utilities
- 6.4.18 Microsoft Azure Energy
- 6.4.19 Enel X
- 6.4.20 Nexant Inc.
- 6.4.21 OSIsoft (AVEVA)
- 6.4.22 Uptake Technologies
- 6.4.23 Bidgely Inc.
- 6.4.24 Smarter Grid Solutions
- 6.4.25 Energyworx
- 6.4.26 C3.ai Inc.
7 MARKET OPPORTUNITIES AND FUTURE OUTLOOK
- 7.1 White-Space and Unmet-Need Assessment
- 7.2 AI-Driven Predictive Maintenance for DER-Rich Grids
- 7.3 Grid-Edge Analytics Marketplaces
- 7.4 Green Hydrogen and Storage Optimization Analytics