

|
시장보고서
상품코드
2121649
중동 및 아프리카의 스마트 미터 : 시장 점유율 분석, 업계 동향과 통계, 성장 예측(2026-2031년)Middle East And Africa Smart Meters - Market Share Analysis, Industry Trends & Statistics, Growth Forecasts (2026 - 2031) |
||||||
 Mordor Intelligence
Mordor Intelligence에 의하면, 중동 및 아프리카의 스마트 미터 시장 규모는 2025년 254억 2,000만 달러에서 2026년에는 276억 1,000만 달러에 이르고, 2026-2031년 CAGR 8.62%로 성장을 지속하여 2031년에는 417억 6,000만 달러에 달할 것으로 예측됩니다.
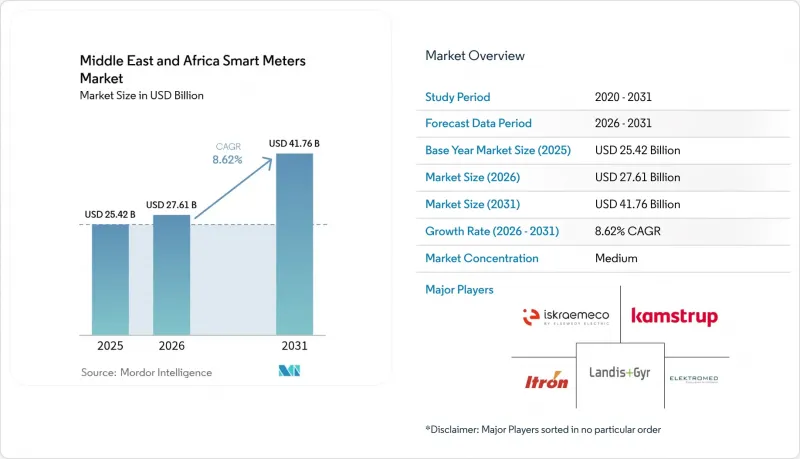
본 보고서는 최종 사용자별(주거용, 상업용, 산업용), 계량기 유형별(스마트 전력 계량기, 스마트 가스 계량기, 스마트 수도 계량기), 통신 기술별(RF 메쉬, 전력선 통신, 셀룰러), 상별(단상, 3상), 지역별(중동 및 아프리카)로 분류되어 있습니다. 시장 예측은 금액(달러)으로 표시되어 있습니다.
중동 및 아프리카 스마트 계량기 시장 동향 및 인사이트
AT 및 C 손실을 줄이기 위한 유틸리티체의 에너지 효율화 노력 가속화
중동 및 아프리카 전역의 전력 사업자들은 기술적 및 상업적 비효율성으로 인해 공급 전력의 15-25%를 손실하고 있습니다. 이는 용납할 수 없는 수익 유출이며, 스마트 계량기 도입 프로그램을 전략적 우선 과제로 자리매김하고 있습니다. 나이지리아의 배전 회사는 2024년, 전력 도난이 빈번한 지역을 대상으로 140만 대의 계량기 도입 이니셔티브를 시작한 반면, 짐바브웨는 청구 정확도를 높이기 위해 자국 내 도입을 가속화했습니다. 이와 병행하여, 걸프 국가들의 에너지 효율 라벨 규제에서는 상세한 소비량 증거가 요구되고 있기 때문에 전력 회사들은 스마트 계량기 데이터를 규정 준수의 기반으로 점점 더 중요하게 여기고 있습니다. 그 결과, 조달 수요가 급증하고 중동 및 아프리카의 스마트 계량기 시장이 확대됨에 따라 여러 공급업체 간의 입찰 경쟁이 촉진되었으며, 분석 서비스는 고부가가치 부가 서비스로 자리매김하고 있습니다. 손실 절감 효과를 가장 빠르게 수치화할 수 있는 전력 회사는 요금 개정에서 우위를 확보할 수 있으며, 지역 전체에서 선구자로서의 이점을 더욱 확대하게 될 것입니다.
스마트 계량기 도입에 관한 정부의 의무화 및 인센티브
도입 규제가 ‘선택’에서 ‘의무’로 전환됨에 따라 강력한 수요 하한선이 형성되고 있습니다. 남아프리카공화국의 국가 규제 시스템 049:2016은 선진적인 계량 사양을 규정하고 있으며, 케이프타운에서는 현재 신축 건물에 스마트 계량기 설치가 의무화되어 있습니다. 걸프협력회의(GCC)의 G-Mark 인증은 여러 국가의 기술 기준을 통일하여 공급업체의 규정 준수 비용을 대폭 절감하는 동시에 출하를 가속화하고 있습니다. 이집트의 개편된 IoT 프레임워크는 이전의 병목 현상이었던 셀룰러 계량기와 관련된 모호함을 해소했습니다. 도입 의무화 범위가 확대됨에 따라 중동 및 아프리카의 스마트 계량기 시장은 예측 가능성이 높아지고 있으며, 이로 인해 재정 상황이 어려운 유틸리티자라도 금융 기관이 장기적인 도입 계획을 지원하기가 더 쉬워졌습니다. 초기 단말기 비용을 충당하는 보조금 제도 덕분에 대상 고객 기반은 더욱 확대되고 있습니다.
높은 초기 장비 및 설치 비용
스마트 계량기의 하드웨어 가격은 대당 50-150달러이며, 설치에는 인건비 외에도 통신 네트워크 비용이 듭니다. 환율 변동에 취약한 사하라 이남 아프리카의 전력 회사는 예산을 압박하는 수입 가격 변동이라는 추가적인 과제에 직면해 있습니다. 대량 구매에 따른 구매력이 부족하기 때문에 GCC(걸프협력회의) 회원국의 동종 업계 경쟁사에 비해 협상력이 약화되고 있습니다. 표준 전송 사양 협회(STS)의 인증 수수료로 인해 선불형 솔루션의 규정 준수 관련 비용이 증가하고 있습니다. 원조 기관의 자금 지원 프로그램이 존재하지만, 자금 지급 일정이 계량기 교체 주기와 일치하는 경우는 거의 없어, 그 결과 구형 장비에 대한 의존이 장기화되면서 중동 및 아프리카의 저소득 지역에서 스마트 계량기 시장의 발전이 제약을 받고 있습니다.
부문 분석
산업용 분야는 연평균 성장률(CAGR) 12.22%의 성장 잠재력을 차지하고 있으며, 2026년부터 2031년에 걸쳐 중동 및 아프리카의 스마트 계량기 시장 규모에서 가장 빠르게 확대될 분야가 될 전망입니다. 사우디아라비아와 UAE에 위치한 해수 담수화 플랜트, 광산, 급성장 중인 제조 거점 등의 산업 시설에서는 생산 공정의 최적화 및 현장에서의 재생에너지 통합을 위해 세밀한 에너지 데이터가 필요합니다. 이러한 요건으로 인해 전력 품질 분석이 가능한 3상 양방향 계량기에 대한 수요가 촉진되고 있으며, 평균 판매 가격은 주거용 계량기의 가격대를 상회하여 전체 수익에 대한 기여도를 높이고 있습니다. 걸프 국가들의 ‘비전 2030’ 계획에 따라, 전력 회사가 산업단지 개발업자와 제휴하여 스마트 계량기 인프라를 사전 설치하는 움직임이 활발해지고 있어 수주 전망이 밝아지고 있습니다.
2025년에 46.31%의 점유율을 차지할 것으로 예상되는 주거용 도입은 중동 및 아프리카의 스마트 계량기 시장에서 출하량의 중심을 계속 차지하고 있습니다. 케이프타운 및 GCC 국가들의 도입 의무화 조치에 더해, 투명한 청구에 대한 소비자 수요가 꾸준한 출하량 증가를 뒷받침하고 있습니다. 그러나 저소득 시장에서의 가격에 대한 우려가 주거용 도입률을 억제하고 있어, 공급업체들은 기능을 축소한 선불형 모델의 도입을 추진하고 있습니다. 상업용 건물은 이 두 가지 극단적인 사례의 중간에 위치하며, 수요 반응(Demand Response) 참여 및 에너지 효율 인증 획득에 스마트 계량기를 활용하고 있습니다. 이 세 가지 사용자 범주가 결합되어 다양한 수요 구조를 형성하고 있으며, 이로 인해 시장 전체가 단일 부문의 경기 변동에 따른 영향을 덜 받게 되었습니다.
2025년, 중동 및 아프리카의 스마트 계량기 시장에서 스마트 전력 계량기는 60.85%의 점유율을 차지하며, 해당 지역 유틸리티 운영에서 전력의 우위를 더욱 공고히 했습니다. 이들은 기술적 기반으로 기능하며, 많은 경우 멀티 유틸리티 플랫폼의 핵심을 담당하고 있습니다. 한편, 2031년까지 연평균 성장률(CAGR) 10.35%를 나타낼 것으로 예측되는 스마트 수도 계량기는 해수 담수화에 대한 의존도가 높아지고, 미수금 문제가 수도 유틸리티자에게 가하는 재정적 압박이 커짐에 따라 성장세를 보이고 있습니다. 가혹한 염분 환경에도 견디는 초음파식 및 전자기식 모델은 특히 오만과 이스라엘에서 꾸준한 입찰 건수를 기록하고 있습니다.
가스 계량기의 도입은 대도시권 이외의 지역에서는 파이프라인 인프라가 여전히 제한적이기 때문에 틈새 분야에 그치고 있습니다. 그러나 전력·상수도·가스를 통합한 플랫폼은 라이프사이클 전반에 걸친 IT 비용을 절감하고, 여러 상품의 출시를 더욱 매력적으로 만들고 있습니다. 중동 및 아프리카의 상수도용 스마트 계량기 시장 규모는 현재로서는 작지만 가장 급격한 성장 궤도를 보이고 있어, 전문 벤더들을 지역 시스템 통합사업자와의 합작 투자로 이끌고 있습니다. 전력 계량기 수요는 진행 중인 송전망 현대화 의무화로 인해 줄어들 기미 없이 지속되고 있지만, 하드웨어의 상품화(commoditization)에 따라 경쟁 마진은 축소되고 있으며, 가치는 소프트웨어 분석으로 이동하고 있습니다.
기타 혜택:
- 엑셀 형식 시장 예측(ME) 시트
- 3개월간의 애널리스트 지원
자주 묻는 질문
목차
제1장 서론
제2장 조사 방법
제3장 주요 요약
제4장 시장 구도
제5장 시장 규모와 성장 예측
제6장 경쟁 구도
제7장 시장 기회와 향후 전망
LSH 26.09.09According to Mordor Intelligence, the Middle East and Africa smart meters market size is expected to grow from USD 25.42 billion in 2025 to USD 27.61 billion in 2026 and is forecast to reach USD 41.76 billion by 2031 at 8.62% CAGR over 2026-2031.
This report is Segmented by End User (Residential, Commercial, and Industrial), Meter Type (Smart Electricity Meters, Smart Gas Meters, and Smart Water Meters), Communication Technology (RF Mesh, Power Line Communication, and Cellular), Phase (Single-Phase, and Three-Phase), and Geography (Middle East, and Africa). The Market Forecasts are Provided in Terms of Value (USD).
Middle East And Africa Smart Meters Market Trends and Insights
Rapid utility push for energy efficiency to reduce AT and C losses
Utilities across the Middle East and Africa lose 15-25% of supplied electricity to technical and commercial inefficiencies, an unacceptable revenue drain that elevates smart-meter programs to strategic priority. Nigeria's distribution companies launched a 1.4-million-meter initiative in 2024 to target theft hotspots, while Zimbabwe accelerated its own installations to tighten billing accuracy. In parallel, Gulf efficiency-label regulations demand granular consumption evidence, so utilities increasingly treat smart-meter data as the compliance backbone. The resulting procurement surge enlarges the Middle East and Africa smart meters market, encourages multi-vendor tenders, and positions analytics services as high-value add-ons. Utilities that quantify loss reductions faster secure tariff-review advantages, amplifying first-mover benefits across the region.
Government mandates and incentives for smart-meter rollouts
Regulatory shifts from voluntary to mandatory deployments create a powerful demand floor. South Africa's National Regulatory System 049:2016 sets advanced-metering specifications, and Cape Town now requires smart meters in new buildings. The Gulf Cooperation Council's G-Mark certification aligns multi-country technical standards, slashing vendor compliance costs and accelerating shipments. Egypt's refreshed IoT framework clears cellular-meter ambiguity, a previous bottleneck. As mandates widen, the Middle East and Africa smart meters market gains predictability that helps financiers back long-term rollouts, even in utilities with constrained balance sheets. Subsidy schemes covering up-front device costs further widen the addressable customer base.
High upfront device and installation costs
Smart-meter hardware ranges from USD 50-150 per unit, and installation adds labour plus communication-network expenses. Sub-Saharan African utilities, often operating under currency volatility, face additional import-price swings that strain budgets. Lack of large-volume purchase power weakens their bargaining position relative to GCC peers. Certification fees from the Standard Transfer Specification Association raise compliance overheads for pre-paid solutions. Although donor-finance programs exist, disbursement timelines rarely align with meter-replacement cycles, prolonging reliance on legacy equipment and constraining the Middle East and Africa smart meters market in low-income regions.
Other drivers and restraints analyzed in the detailed report include:
- Smart city and IoT infrastructure investments
- Rising demand for precise billing and customer-engagement tools
- Limited utility CAPEX and financing constraints
For complete list of drivers and restraints, kindly check the Table Of Contents.
Segment Analysis
Industrial applications accounted for 12.22% CAGR growth potential, signalling the segment's role as the fastest-expanding component of the Middle East and Africa smart meters market size between 2026 and 2031. Industrial facilities including desalination plants, mines, and fast-growing manufacturing hubs in Saudi Arabia and the UAE require granular energy data to optimize production processes and integrate on-site renewables. These requirements stimulate demand for three-phase bi-directional meters capable of power-quality analytics, pushing average selling prices above the residential range and boosting overall revenue contribution. Vision 2030 agendas across Gulf economies strengthen the order pipeline as utilities partner with industrial-estate developers to pre-install smart-meter infrastructure.
Residential deployments, holding a 46.31% share in 2025, remain core to volume shipments within the Middle East and Africa smart meters market. Mandated rollouts in Cape Town and GCC states, coupled with consumer demand for transparent billing, sustain steady unit growth. Affordability concerns in lower-income markets, however, temper residential conversion rates, prompting suppliers to introduce stripped-down prepaid variants. Commercial buildings sit between the two extremes, leveraging meters for demand-response participation and energy-efficiency certification. Together, the three user categories form a diversified demand canvas that insulates the overall market from cyclical stocks in any single sector.
Smart electricity meters commanded 60.85% of Middle East and Africa smart meters market share in 2025, reinforcing electricity's primacy in regional utility operations. They serve as the technological baseline and often anchor multi-utility platforms. Yet, smart water meters, forecast to post a 10.35% CAGR through 2031, gain momentum as desalination reliance and non-revenue water issues intensify financial pressures on water utilities. Ultrasonic and electromagnetic models that withstand harsh saline environments register robust bid volumes, especially in Oman and Israel.
Gas-meter adoption stays niche because pipeline infrastructure remains limited outside metropolitan pockets. Nevertheless, integrated electricity-water-gas platforms lower lifetime IT costs and make multi-commodity rollouts more attractive. The Middle East and Africa smart meters market size for water applications, while smaller today, exhibits the steepest trajectory, drawing specialized vendors into joint ventures with regional system integrators. Electricity-meter demand continues unabated due to ongoing grid-modernization mandates, but competitive margins narrow as hardware commoditizes, and value migrates to software analytics.
Complete Report Scope:
- By End User
- Residential
- Commercial
- Industrial
- By Meter Type
- Smart Electricity Meters
- Smart Gas Meters
- Smart Water Meters
- By Communication Technology
- RF Mesh
- Power Line Communication
- Cellular
- By Phase
- Single-Phase
- Three-Phase
- By Geography
- Middle East
- Saudi Arabia
- United Arab Emirates
- Qatar
- Kuwait
- Oman
- Bahrain
- Turkey
- Israel
- Jordan
- Lebanon
- Africa
- South Africa
- Egypt
- Nigeria
- Kenya
- Morocco
- Algeria
- Ghana
- Ethiopia
- Tanzania
- Middle East
List of Companies Covered in this Report:
- Landis+Gyr Group AG
- Kamstrup A/S
- Itron Inc.
- Iskraemeco d.d.
- Electromed Termikel Group
- Holley Technology Ltd.
- Hexing Electrical Co. Ltd.
- Sensus - Xylem Inc.
- Diehl Metering GmbH - FZE
- Sagemcom SAS
- Elster Group GmbH - Honeywell
- ADD Grup
- Aclara Technologies LLC
- Apator SA
- ZIV Automation
- Wasion Group Holdings Ltd.
- EDMI Limited
- Gridspertise S.r.l.
- Neptune Technology Group Inc.
- Networked Energy Services Corporation
Additional Benefits:
- The market estimate (ME) sheet in Excel format
- 3 months of analyst support
TABLE OF CONTENTS
1 INTRODUCTION
- 1.1 Study Assumptions and Market Definition
- 1.2 Scope of the Study
2 RESEARCH METHODOLOGY
3 EXECUTIVE SUMMARY
4 MARKET LANDSCAPE
- 4.1 Market Overview
- 4.2 Market Drivers
- 4.2.1 Rapid utility push for energy efficiency to reduce AT and C losses
- 4.2.2 Government mandates and incentives for smart meter rollouts
- 4.2.3 Smart city and IoT infrastructure investments
- 4.2.4 Rising demand for precise billing and customer engagement tools
- 4.2.5 Surge in distributed solar rooftop connections necessitating bi-directional metering
- 4.2.6 Desalination plant electrification driving water meter digitization
- 4.3 Market Restraints
- 4.3.1 High upfront device and installation costs
- 4.3.2 Limited utility CAPEX and financing constraints
- 4.3.3 Cybersecurity skill gap within regional utilities
- 4.3.4 Interoperability challenges between legacy AMR and new AMI architectures
- 4.4 Industry Value-Chain Analysis
- 4.5 Regulatory Landscape
- 4.6 Technological Outlook
- 4.7 Porter's Five Forces Analysis
- 4.7.1 Threat of New Entrants
- 4.7.2 Bargaining Power of Buyers
- 4.7.3 Bargaining Power of Suppliers
- 4.7.4 Threat of Substitute Products
- 4.7.5 Intensity of Competitive Rivalry
- 4.8 Impact of Macroeconomic Factors
5 MARKET SIZE AND GROWTH FORECASTS (VALUE)
- 5.1 By End User
- 5.1.1 Residential
- 5.1.2 Commercial
- 5.1.3 Industrial
- 5.2 By Meter Type
- 5.2.1 Smart Electricity Meters
- 5.2.2 Smart Gas Meters
- 5.2.3 Smart Water Meters
- 5.3 By Communication Technology
- 5.3.1 RF Mesh
- 5.3.2 Power Line Communication
- 5.3.3 Cellular
- 5.4 By Phase
- 5.4.1 Single-Phase
- 5.4.2 Three-Phase
- 5.5 By Geography
- 5.5.1 Middle East
- 5.5.1.1 Saudi Arabia
- 5.5.1.2 United Arab Emirates
- 5.5.1.3 Qatar
- 5.5.1.4 Kuwait
- 5.5.1.5 Oman
- 5.5.1.6 Bahrain
- 5.5.1.7 Turkey
- 5.5.1.8 Israel
- 5.5.1.9 Jordan
- 5.5.1.10 Lebanon
- 5.5.2 Africa
- 5.5.2.1 South Africa
- 5.5.2.2 Egypt
- 5.5.2.3 Nigeria
- 5.5.2.4 Kenya
- 5.5.2.5 Morocco
- 5.5.2.6 Algeria
- 5.5.2.7 Ghana
- 5.5.2.8 Ethiopia
- 5.5.2.9 Tanzania
- 5.5.1 Middle East
6 COMPETITIVE LANDSCAPE
- 6.1 Market Concentration
- 6.2 Strategic Moves
- 6.3 Market Share Analysis
- 6.4 Company Profiles (includes Global level Overview, Market level overview, Core Segments, Financials as available, Strategic Information, Market Rank/Share for key companies, Products and Services, and Recent Developments)
- 6.4.1 Landis+Gyr Group AG
- 6.4.2 Kamstrup A/S
- 6.4.3 Itron Inc.
- 6.4.4 Iskraemeco d.d.
- 6.4.5 Electromed Termikel Group
- 6.4.6 Holley Technology Ltd.
- 6.4.7 Hexing Electrical Co. Ltd.
- 6.4.8 Sensus - Xylem Inc.
- 6.4.9 Diehl Metering GmbH - FZE
- 6.4.10 Sagemcom SAS
- 6.4.11 Elster Group GmbH - Honeywell
- 6.4.12 ADD Grup
- 6.4.13 Aclara Technologies LLC
- 6.4.14 Apator SA
- 6.4.15 ZIV Automation
- 6.4.16 Wasion Group Holdings Ltd.
- 6.4.17 EDMI Limited
- 6.4.18 Gridspertise S.r.l.
- 6.4.19 Neptune Technology Group Inc.
- 6.4.20 Networked Energy Services Corporation
7 MARKET OPPORTUNITIES AND FUTURE OUTLOOK
- 7.1 White-space and unmet-need assessment


