
|
시장보고서
상품코드
2121784
스포츠 애널리틱스 : 시장 점유율 분석, 업계 동향과 통계, 성장 예측(2026-2031년)Sports Analytics - Market Share Analysis, Industry Trends & Statistics, Growth Forecasts (2026 - 2031) |
||||||
 Mordor Intelligence
Mordor Intelligence에 의하면, 스포츠 애널리틱스 시장 규모는 2026년에 52억 8,000만 달러에 이르고, 2031년까지 178억 8,000만 달러에 이를 것으로 예측되며, 이 기간 CAGR은 27.63%를 기록할 전망입니다.
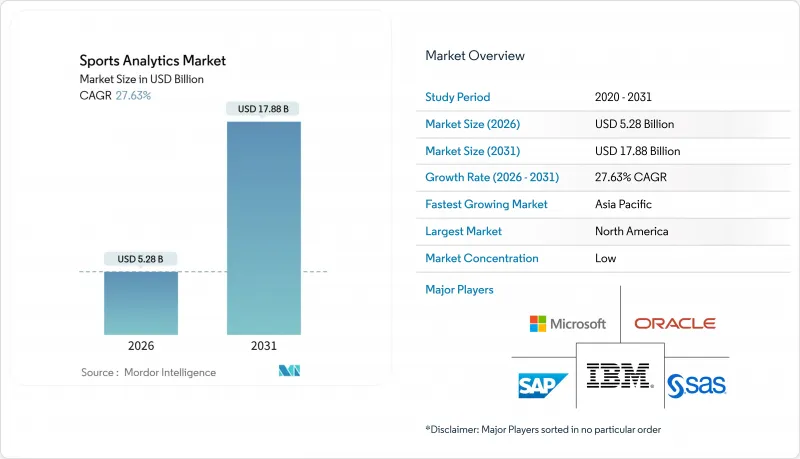
본 보고서는 스포츠 종목(축구, 크리켓, 농구, 하키, 미식축구,야구, 럭비, 기타 스포츠), 구성 요소(소프트웨어 및 서비스), 도입 형태(On-Premise 및 클라우드), 최종 사용자(스포츠 팀/클럽, 리그 및 연맹, 개인 선수, 스포츠 베팅 사업자, 기타 최종 사용자), 그리고 지역별로 분류되어 있습니다. 시장 전망은 금액(달러) 기준으로 제시되어 있습니다.
세계 스포츠 애널리틱스 시장 동향 및 인사이트
북미 프로 리그에서의 IoT 센서를 활용한 실시간 추적
NFL의 숄더 패드에 내장된 Zebra사의 RFID 칩과 NBA 경기장에 설치된 광학 카메라는 경기당 수백만 건의 좌표 데이터를 생성하여 분석 주기를 수 시간에서 수 초로 단축하고 있습니다. 2025년 8월 리그 전체에 도입된 Microsoft의 Copilot이 탑재된 사이드라인용 용도는 이러한 데이터 스트림을 4번째 다운 성공 확률이나 피로 경보로 변환하여 코치가 즉시 대응할 수 있도록 합니다. 따라서 팀은 5-10초의 왕복 지연을 허용할 수 없기 때문에 엣지 게이트웨이와 저지연 클라우드 존이 고정형 데이터센터를 대체하고 있습니다. 이 모델은 이미 잉글랜드 프리미어리그로도 확산되었으며, 해당 리그는 2025년 7월 마이크로소프트와 독자적인 5년간의 AI 파트너십을 체결했습니다.
이적 평가를 위한 유럽 축구 클럽의 통합 데이터 웨어하우징 의무화
프리미어리그와 유럽의 클럽들은 여러 시즌에 걸친 경기 기록 아카이브를 8자리 수의 이적료를 정당화하는 자본 자산으로 취급하는 경향이 강해지고 있습니다. 2021년에 처음 출시된 Oracle의 ‘Match Insights’ 플랫폼은 영상, 포지션, 생체 인식 기록을 통합하여 스카우트 팀이 유망주를 과거의 유사 사례와 비교 평가할 수 있도록 지원합니다. 아카데미 프로그램도 이러한 추세를 따르고 있으며, Kitman Labs는 현재 프리미어리그의 모든 유스 조직에서 장기적인 추적 분석을 지원하고 있어, 판매 측에 협상 시 데이터 기반의 우위를 제공합니다. 그 결과, 구매 측은 동등하게 충실한 데이터 세트로 대응해야 하며, 그렇지 않을 경우 과도한 비용을 지불해야 할 위험에 처할 수 있습니다.
남미 및 아프리카 2부 리그 구단의 제한된 기술 예산
많은 2부 리그 축구 클럽은 연간 예산이 1,000만 달러 미만으로 운영되고 있어, 데이터 파이프라인보다 선수들의 급여를 우선시할 수밖에 없습니다. 또한, 광섬유 회선 연결 상태가 불안정하여 실시간 업로드가 더욱 방해받고 있어, 코치들은 자동 센서 데이터 대신 수동 태깅에 의존할 수밖에 없는 상황입니다. 이러한 격차로 인해, 데이터 자원이 풍부한 구단은 저평가된 유망주로부터 이익을 얻는 반면, 자금 부족 구단은 뒤처지게 되어 전 세계 인재 시장의 양극화가 고착화될 위험이 있습니다.
부문 분석
2025년에는 축구가 수익의 39.78%를 차지했지만, 2031년까지 연평균 성장률(CAGR) 29.23%로 가장 빠르게 성장하고 있는 종목은 럭비입니다. 이는 Sportable사의 센서 내장형 ‘길버트 볼’이 심판 판정 및 방송용 오버레이를 위해 초당 20회 위치 정보를 제공하기 때문입니다. 이 데이터가 풍부한 공은 라인아웃이나 포워드 패스를 실시간으로 검증하여 심판과 방송사 양측의 요구를 충족시키고 있습니다. 크리켓은 인도와 호주에서 호크아이의 압도적인 보급에 힘입어 여전히 두 번째로 큰 점유율을 유지하고 있습니다. 한편, 농구에서는 공간 추적 기술에 관한 파트너십이 분석 기반을 강화하고 있습니다.
럭비에서 나타나는 이러한 추세는 판정의 모호성에 직면한 스포츠일수록, 이미 확립된 리플레이 시스템을 갖춘 스포츠보다 더 빨리 내장형 센서를 채택하는 경향이 있음을 보여줍니다. 2023년 U-20 월드 챔피언십에서의 시범 운영이 성공을 거둔 데 이어, 식스 네이션스 주최 측은 2029년까지 스마트 볼 도입을 결정했으며, 하드웨어 및 소프트웨어 수요가 꾸준히 증가할 것으로 확실시되고 있습니다. 따라서 기술이 심판의 과제를 해결하고 팬들을 위한 스토리텔링을 풍요롭게 할 때, 스포츠 분석 시장은 그 혜택을 누리게 될 것입니다.
2025년 시점에서도 소프트웨어 라이선스는 여전히 시장 가치의 64.89%를 차지했지만, 통합, 데이터 품질, 모델 훈련 서비스는 연평균 성장률(CAGR) 28.11%로 확대되고 있습니다. 딜로이트의 ‘Converge for Sports’는 팬 데이터 레이크, 로열티 기능, 실시간 대시보드를 단일 관리형 서비스로 통합하여, 구단들이 툴킷보다 성과 기반 계약을 선호하는 이유를 여실히 보여주고 있습니다. 컨설팅 부서는 자체 개발한 웨어러블 기기와 퍼블릭 클라우드 API 사이를 중개하여 전체 스택에 걸친 개인정보 보호 관리 및 싱글 사인온(SSO) 기능을 보장하고 있습니다.
서비스에 부과되는 프리미엄은 아키텍처의 복잡성을 반영합니다. 최신 도입 환경에서는 광학 카메라, RFID 칩, 티켓 판매 로그, 베팅 데이터가 클라우드 웨어하우스 내에서 통합되어 있습니다. 통합 파트너가 없다면, 구단은 스키마 일관성 유지나 머신러닝 모델의 안전한 도입에 어려움을 겪게 될 것입니다. 제품 라이선스와 자문 프로그램을 결합한 벤더는 교차 판매에서 우위를 점하고 있으며, 사모펀드 투자자들은 안정적인 서비스 수익을 창출하는 기업을 높이 평가했습니다.
지역별 분석
2025년에는 NFL 리그 전반에 걸친 IoT 스택과 1초 미만의 데이터 피드를 중시하는 합법 도박의 보급에 힘입어 북미가 매출의 42.76%를 차지했습니다. 메이저리그 야구(MLB)와 Sportradar 간의 2032년까지의 계약 갱신에는 지분 보유 요소도 포함되어 있어, 장기적인 데이터 계약이 권리 보유자와 벤더 양측의 현금 흐름을 어떻게 뒷받침하고 있는지를 보여줍니다. 성숙한 광대역 인프라, 대규모 미디어 권리, 그리고 정량적 의사결정 문화가 지출의 모멘텀을 유지하고 있습니다.
유럽은 통합된 축구 데이터 전략과 Oracle이 제공하는 방송용 오버레이에 힘입어 2위를 차지했습니다. 성장은 견조하지만, GDPR(EU 개인정보보호규정)로 인해 생체 인식 데이터 수집에 대한 동의와 관련된 장벽이 발생하고 있어 세계 평균보다 낮은 수치를 기록하고 있습니다. 그럼에도 불구하고, 2025년 7월 프리미어리그와 마이크로소프트의 제휴는 규정 준수 워크플로가 표준화된다면 구단들이 적극적으로 투자할 것임을 보여줍니다. 중동은 확장 시장으로서의 역할을 수행하고 있습니다. 사우디아라비아는 ‘비전 2030’ 자금을 크리켓 및 축구 분석 시범 사업에 투입하고 있는 반면, 아랍에미리트는 자유무역지대에 스타트업 기업을 유치하고 있습니다.
아시아태평양은 크리켓 프랜차이즈 경제와 데이터 인프라를 공유하는 급성장 중인 e스포츠 부문의 견인 아래, 2031년까지 연평균 성장률(CAGR) 28.69%로 가장 빠르게 성장하고 있습니다. 인도 프리미어 리그(IPL)는 모든 구단에 호크아이 및 캐터펄트 시스템 도입을 의무화하고 있으며, 이를 통해 매 시즌 지속적인 소프트웨어 업그레이드가 보장되고 있습니다. 중국, 한국, 일본은 기존 스포츠 데이터와 e스포츠 텔레메트리 데이터를 융합하여 코치와 중계 해설자가 모두 의존하는 하이브리드형 대시보드를 구축하고 있습니다. 2030년대 초반까지 누적 지출액은 북미와 어깨를 나란히할 것이며, 이후 이를 넘어설 전망입니다.
남미와 아프리카는 기반이 작음에도 불구하고 여전히 두 자릿수의 성장률을 유지하고 있습니다. 2부 리그 클럽들은 예산 제약으로 인해 도입이 늦어지고 있지만, 상파울루, 부에노스아이레스, 요하네스버그의 엘리트 팀들은 이미 유럽의 동급 팀들에 필적하는 웨어러블 기기와 클라우드 분석 기술을 도입하고 있습니다. 2030년 월드컵 유치 및 지역 방송 계약과 관련된 인프라 투자로 인해 이러한 격차는 점차 좁혀질 것으로 예측됩니다.
기타 혜택:
- 엑셀 형식 시장 예측(ME) 시트
- 3개월간의 애널리스트 지원
자주 묻는 질문
목차
제1장 서론
제2장 조사 방법
제3장 주요 요약
제4장 시장 구도
제5장 시장 규모와 성장 예측
제6장 경쟁 구도
제7장 시장 기회와 향후 전망
LSH 26.09.09According to Mordor Intelligence, the sports analytics market size stood at USD 5.28 billion in 2026 and is forecast to reach USD 17.88 billion by 2031, corresponding to a 27.63% CAGR over the period.
This report is Segmented by Sport (Football, Cricket, Basketball, Hockey, American Football, Baseball, Rugby, Other Sports), Component (Software, and Services), Deployment (On-Premise, and Cloud), End User (Sports Teams/Clubs, Leagues and Federations, Individual Athletes, Sports Betting Operators, Other End User), and Geography. The Market Forecasts are Provided in Terms of Value (USD).
Global Sports Analytics Market Trends and Insights
Real-Time Tracking Enabled by IoT Sensors in North American Professional Leagues
Zebra RFID chips in NFL shoulder pads and optical cameras in NBA arenas generate millions of coordinates each game, compressing the analysis loop from hours to seconds. Microsoft's Copilot-enabled sideline application, rolled out league-wide in August 2025, converts those streams into fourth-down probabilities and fatigue alerts that coaches can act on instantly. Edge gateways and low-latency cloud zones are therefore replacing fixed data centers because teams cannot tolerate 5-10 second round-trip delays. The model is already diffusing to the English Premier League, which signed its own five-year AI partnership with Microsoft in July 2025.
Centralised Data-Warehousing Mandates from European Football Clubs for Transfer Valuation
Premier League and continental clubs increasingly treat multi-season performance archives as capital assets that justify eight-figure transfer fees. Oracle's Match Insights platform, first launched in 2021, collates video, positional, and biometric records so recruitment teams can benchmark prospects against historical comparables. Academy programs follow suit: Kitman Labs now underpins longitudinal tracking across every Premier League youth setup, giving sellers data-backed leverage in negotiations. As a result, buyers must counter with equally rich datasets or risk overpaying.
Limited Technology Budgets of Tier-2 Clubs in South America and Africa
Many second-division football organizations operate on annual budgets under USD 10 million and must choose salaries over data pipelines. Patchy fiber backhaul further hampers live uploads, forcing coaches to rely on manual tagging rather than automated sensor feeds. The gap risks locking in a two-tier global talent market where data-rich clubs monetize undervalued prospects, while cash-strapped peers fall behind.
Other drivers and restraints analyzed in the detailed report include:
- Sports Betting Data Partnerships Post-Legalization in the United States
- Franchise-Driven Analytics Adoption in Indian and Australian Cricket Leagues
- GDPR and CCPA Constraints on Biometric Data Collection
For complete list of drivers and restraints, kindly check the Table Of Contents.
Segment Analysis
Football generated 39.78% revenue in 2025, yet rugby is expanding fastest at a 29.23% CAGR through 2031 as Sportable's sensor-embedded Gilbert ball delivers 20 positional updates per second for officiating and broadcast overlays. This data-rich object verifies lineouts and forward passes in real time, satisfying both referees and broadcasters. Cricket retains the second-largest slice, propelled by Hawk-Eye dominance in India and Australia, while basketball's spatial-tracking partnerships fortify its analytics baseline.
Rugby's momentum demonstrates that sports confronting officiating ambiguity adopt embedded sensors sooner than those with established replay systems. Successful trials at the 2023 Under-20 World Championship convinced Six Nations organizers to roll out smart balls through 2029, guaranteeing a steady uptick in hardware and software demand. The sports analytics market, therefore, benefits when technology solves officiating pain points and enriches fan storytelling.
Software licenses still accounted for 64.89% of value in 2025, but integration, data quality, and model-training services are expanding at a 28.11% CAGR. Deloitte's Converge for Sports bundles a fan data lake, loyalty functions, and real-time dashboards into a single managed service, underscoring why clubs prefer outcome-based contracts over toolkits. Consulting arms also mediate between proprietary wearables and public-cloud APIs, ensuring privacy controls and single-sign-on function across the stack.
The premium on services reflects rising architectural complexity. Modern deployments connect optical cameras, RFID chips, ticketing logs, and betting feeds inside a cloud warehouse. Without integration partners, clubs struggle to harmonize schemas or deploy machine-learning models safely. Vendors that pair product licenses with advisory programs have a cross-sell edge, and private equity investors reward those with steady services annuities.
Complete Report Scope:
- By Sport
- Football
- Cricket
- Basketball
- Hockey
- American Football
- Baseball
- Rugby
- Other Sports
- By Component
- Software
- Services
- By Deployment
- On-Premise
- Cloud
- By End User
- Sports Teams/Clubs
- Leagues and Federations
- Individual Athletes
- Sports Betting Operators
- Other End Users
- By Geography
- North America
- United States
- Canada
- Mexico
- Europe
- Germany
- United Kingdom
- France
- Russia
- Rest of Europe
- Asia-Pacific
- China
- Japan
- India
- South Korea
- Australia
- Rest of Asia-Pacific
- Middle East and Africa
- Middle East
- Saudi Arabia
- United Arab Emirates
- Rest of Middle East
- Africa
- South Africa
- Egypt
- Rest of Africa
- Middle East
- South America
- Brazil
- Argentina
- Rest of South America
- North America
Geography Analysis
North America controlled 42.76% of revenue in 2025, aided by the NFL's league-wide IoT stack and widespread legal wagering that values sub-second data feeds. Major League Baseball's 2032 renewal with Sportradar, including an equity component, illustrates how long-term data contracts anchor cash flows for both rights holders and vendors. Mature broadband infrastructure, large media rights, and a culture of quantitative decision-making sustain spending momentum.
Europe ranked second, propelled by unified football data strategies and Oracle-powered broadcast overlays. Growth remains healthy but sits beneath global averages because GDPR introduces consent hurdles for biometric capture. Nevertheless, the July 2025 Premier League-Microsoft pact shows clubs will invest heavily once compliance workflows are standardized. The Middle East acts as an extension market: Saudi Arabia channels Vision 2030 capital into analytics pilots across cricket and football, while the United Arab Emirates recruits startups to its free zones.
Asia Pacific is advancing fastest at a 28.69% CAGR through 2031, led by cricket's franchise economics and a booming esports sector that shares data infrastructure. The Indian Premier League forces every club to maintain Hawk-Eye and Catapult systems, locking in recurrent software upgrades each season. China, South Korea, and Japan fuse traditional sports data with esports telemetry to build hybrid dashboards that coaches and shout-casters both rely on. By the early 2030s, cumulative spend is on track to match, then surpass, North America.
South America and Africa remain double-digit growth regions despite smaller bases. Budget limitations among tier-2 clubs slow adoption, but elite sides in Sao Paulo, Buenos Aires, and Johannesburg are already deploying wearables and cloud analytics on par with European counterparts. Infrastructure investments tied to 2030 World Cup bids and regional broadcasting deals are expected to gradually narrow the gap.
- IBM Corporation
- SAP SE
- SAS Institute Inc.
- Oracle Corporation
- Microsoft Corporation
- Stats Perform (Opta)
- Catapult Group International Ltd
- Sportradar AG
- Genius Sports Group
- Zebra Technologies Corp.
- Kinexon GmbH
- Second Spectrum Inc.
- Hudl (Agile Sports)
- Wyscout Srl
- Zelus Analytics
- ChyronHego Corp.
- Hawk-Eye Innovations Ltd
- Tableau Software LLC
- Sportlogiq
- Strivr Labs Inc.
- Zone7 AI Ltd
- Synergy Sports Technology
- Kitman Labs
- Orreco Ltd
Additional Benefits:
- The market estimate (ME) sheet in Excel format
- 3 months of analyst support
TABLE OF CONTENTS
1 INTRODUCTION
- 1.1 Study Assumptions and Market Definition
- 1.2 Scope of the Study
2 RESEARCH METHODOLOGY
3 EXECUTIVE SUMMARY
4 MARKET LANDSCAPE
- 4.1 Market Overview
- 4.2 Market Drivers
- 4.2.1 Real-Time Tracking Enabled by IoT Sensors in North-American Professional Leagues
- 4.2.2 Centralised Data Warehousing Mandates from European Football Clubs for Transfer Valuation
- 4.2.3 Sports-Betting Data Partnerships Post-Legalisation in the United States
- 4.2.4 Franchise-Driven Analytics Adoption in Indian and Australian Cricket Leagues
- 4.2.5 AI-Powered Injury Prediction Models Reducing Player Downtime
- 4.2.6 Integration of Esports Performance Data with Traditional Sports Analytics
- 4.3 Market Restraints
- 4.3.1 Limited Technology Budgets of Tier-2 Clubs in South America and Africa
- 4.3.2 GDPR and CCPA Constraints on Biometric Data Collection
- 4.3.3 Data-Ownership Disputes Between Leagues and Betting Operators
- 4.3.4 Lack of Standardised Performance Metrics Across Women's Sports
- 4.4 Industry Value Chain Analysis
- 4.5 Impact of Macroeconomic Factors on the Market
- 4.6 Regulatory Outlook
- 4.7 Technology Outlook
- 4.8 Porter's Five Forces Analysis
- 4.8.1 Bargaining Power of Suppliers
- 4.8.2 Bargaining Power of Consumers
- 4.8.3 Threat of New Entrants
- 4.8.4 Intensity of Competitive Rivalry
- 4.8.5 Threat of Substitutes
5 MARKET SIZE AND GROWTH FORECASTS (VALUE)
- 5.1 By Sport
- 5.1.1 Football
- 5.1.2 Cricket
- 5.1.3 Basketball
- 5.1.4 Hockey
- 5.1.5 American Football
- 5.1.6 Baseball
- 5.1.7 Rugby
- 5.1.8 Other Sports
- 5.2 By Component
- 5.2.1 Software
- 5.2.2 Services
- 5.3 By Deployment
- 5.3.1 On-Premise
- 5.3.2 Cloud
- 5.4 By End User
- 5.4.1 Sports Teams/Clubs
- 5.4.2 Leagues and Federations
- 5.4.3 Individual Athletes
- 5.4.4 Sports Betting Operators
- 5.4.5 Other End Users
- 5.5 By Geography
- 5.5.1 North America
- 5.5.1.1 United States
- 5.5.1.2 Canada
- 5.5.1.3 Mexico
- 5.5.2 Europe
- 5.5.2.1 Germany
- 5.5.2.2 United Kingdom
- 5.5.2.3 France
- 5.5.2.4 Russia
- 5.5.2.5 Rest of Europe
- 5.5.3 Asia-Pacific
- 5.5.3.1 China
- 5.5.3.2 Japan
- 5.5.3.3 India
- 5.5.3.4 South Korea
- 5.5.3.5 Australia
- 5.5.3.6 Rest of Asia-Pacific
- 5.5.4 Middle East and Africa
- 5.5.4.1 Middle East
- 5.5.4.1.1 Saudi Arabia
- 5.5.4.1.2 United Arab Emirates
- 5.5.4.1.3 Rest of Middle East
- 5.5.4.2 Africa
- 5.5.4.2.1 South Africa
- 5.5.4.2.2 Egypt
- 5.5.4.2.3 Rest of Africa
- 5.5.4.1 Middle East
- 5.5.5 South America
- 5.5.5.1 Brazil
- 5.5.5.2 Argentina
- 5.5.5.3 Rest of South America
- 5.5.1 North America
6 COMPETITIVE LANDSCAPE
- 6.1 Market Concentration
- 6.2 Strategic Moves
- 6.3 Market Share Analysis
- 6.4 Company Profiles (includes Global Level Overview, Market Level Overview, Core Segments, Financials as Available, Strategic Information, Market Rank/Share for Key Companies, Products and Services, and Recent Developments)
- 6.4.1 IBM Corporation
- 6.4.2 SAP SE
- 6.4.3 SAS Institute Inc.
- 6.4.4 Oracle Corporation
- 6.4.5 Microsoft Corporation
- 6.4.6 Stats Perform (Opta)
- 6.4.7 Catapult Group International Ltd
- 6.4.8 Sportradar AG
- 6.4.9 Genius Sports Group
- 6.4.10 Zebra Technologies Corp.
- 6.4.11 Kinexon GmbH
- 6.4.12 Second Spectrum Inc.
- 6.4.13 Hudl (Agile Sports)
- 6.4.14 Wyscout Srl
- 6.4.15 Zelus Analytics
- 6.4.16 ChyronHego Corp.
- 6.4.17 Hawk-Eye Innovations Ltd
- 6.4.18 Tableau Software LLC
- 6.4.19 Sportlogiq
- 6.4.20 Strivr Labs Inc.
- 6.4.21 Zone7 AI Ltd
- 6.4.22 Synergy Sports Technology
- 6.4.23 Kitman Labs
- 6.4.24 Orreco Ltd
7 MARKET OPPORTUNITIES AND FUTURE OUTLOOK
- 7.1 White-Space and Unmet-Need Assessment