|
시장보고서
상품코드
2121800
보안 분석 시장 : 시장 점유율 분석, 업계 동향 및 통계, 성장 예측(2026-2031년)Security Analytics - Market Share Analysis, Industry Trends & Statistics, Growth Forecasts (2026 - 2031) |
||||||
 Mordor Intelligence
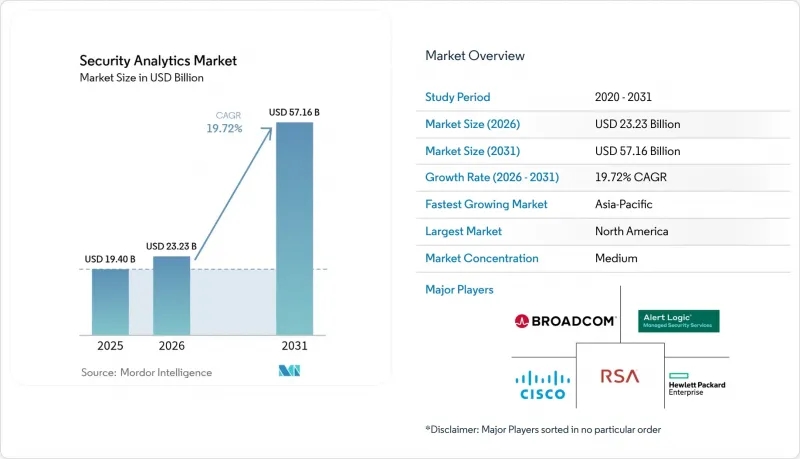
Mordor Intelligence에 의하면, 2026년 보안 분석 시장 규모는 232억 3,000만 달러로 추정되고, 2025년 194억 달러에서 확대해, 2031년에는 571억 6,000만 달러에 이를 것으로 예측됩니다.
2026-2031년 연평균 성장률(CAGR) 19.72%로 성장할 것으로 전망됩니다.
본 보고서는 용도별(네트워크 보안 분석, 용도 보안 분석 등), 배포 방식별(온프레미스, 클라우드, 하이브리드), 조직 규모별(대기업, 중소기업), 최종 사용자 산업별(은행 및 금융 서비스, 의료 등), 그리고 지역별로 분류되어 있습니다. 시장 전망은 금액(달러) 단위로 제시되어 있습니다.
세계의 보안 분석 시장 동향 및 인사이트
사이버 위협의 고도화
국가 주도의 공격자들은 현재 시그니처 기반 방어를 회피하는 자동화된 툴 체인을 전개하고 있으며, 이로 인해 기업들은 횡방향 이동 및 제로데이 공격을 감지하는 행동 분석 도입을 서둘러야 하는 상황에 처해 있습니다. FBI는 감시 및 데이터 유출을 목적으로 한 통신 사업자에 대한 국가 지원형 공격이 급증하고 있다고 지적하고 있습니다. 이에 따라 보안 팀은 네트워크의 기준선을 자체 학습하고, 비정상적인 경로를 밀리초 단위로 감지하는 머신러닝 모델이 탑재된 플랫폼을 선호하여 채택하고 있습니다. 각 벤더는 UEBA 및 위협 인텔리전스 피드를 SIEM 엔진에 직접 통합함으로써 공격자의 잠복 시간을 단축하고 감지까지 걸리는 평균 시간을 줄이고 있습니다. 이 ‘군비 경쟁’에서 우위를 점할 수 있는 것은 수동적인 특징량 엔지니어링 없이도 모델을 지속적으로 재학습시킬 수 있는 공급업체입니다.
IoT 및 BYOD 엔드포인트의 폭발적인 증가
산업용 센서, 의료기기, 원격 근무용 노트북으로 인해 공격 표면이 확대되면서 경계 방어는 효과를 잃어가고 있습니다. 『Scientific Reports』의 조사에 따르면, 60% 이상의 조직이 관리 대상 외 기기와 관련된 내부자 위협에 직면하고 있는 것으로 나타났습니다. 최신 분석 도구는 OT 게이트웨이, 모바일 EDR 에이전트, 엣지 노드에서 수집된 텔레메트리 데이터를 활용하여 비지도 학습을 적용해 기기의 동작을 분류합니다. 엣지 처리를 통해 지연 시간이 단축되어, 연결이 끊긴 경우에도 운영을 지속할 수 있습니다. 각 벤더는 현재 펌웨어에 경량 에이전트를 내장하고, 클라우드 측의 그래프 분석과 결합함으로써 수백만 대에 달하는 엔드포인트 전체에 걸친 이상 현상의 상관관계를 분석했습니다.
데이터 통합과 도구의 난립이라는 과제
대부분의 기업은 25-50유형의 보안 도구를 병용하고 있으며, 이들 도구는 서로 일관성이 없는 로그 스키마를 출력하기 때문에 맞춤형 파서(parser)를 사용해야만 하여 상관 관계 분석이 지연되고 있습니다. 『CSO Online』의 보고에 따르면, 통합에 따른 오버헤드가 분석가의 처리 능력을 압박하여 여러 공격 벡터에 걸친 공격 감지를 어렵게 만들고 있습니다. 구매 기업들은 독립형 솔루션을 통합형 분석 제품군으로 대체하고 있지만, 벤더 종속성에 대한 우려로 인해 기존 시스템을 전면 교체하는 프로젝트의 진척은 더딘 상황입니다. 클라우드 전환으로 인해 복잡성이 증가하는 가운데, 플랫폼은 온프레미스 Syslog, 클라우드 API 메타데이터, SaaS 감사 추적을 단일 데이터 레이크 내에서 표준화해야 하며, 그렇지 않을 경우 사일로화가 영구화될 위험이 있습니다.
부문 분석
네트워크 보안 분석은 2025년 매출의 37.40%를 차지했으며, 보안 분석 시장에서 딥 패킷 인스펙션(DPI) 및 NetFlow 분석의 지속적인 중요성을 부각시키고 있습니다. 기업들이 워크로드를 온프레미스 외부로 이전하고 크로스 클라우드 가시성을 추구함에 따라, 클라우드 보안 분석은 2031년까지 연평균 성장률(CAGR) 16.85%로 확대되고 있습니다. 애플리케이션, 웹, 엔드포인트 분석을 결합함으로써 감지 범위가 확대되는 한편, 내부 위협 대응 모듈에서는 UEBA를 활용하여 사용자 행동 프로파일을 구축하고 있습니다.
이러한 하위 부문의 융합으로 인해 각 벤더는 다양한 텔레메트리 데이터를 통합된 데이터 패브릭으로 가져오는 마이크로서비스 기반 수집기를 도입해야 하는 상황에 직면해 있습니다. AI를 활용한 정책 권장 및 자동 복구 기능을 제공하는 플랫폼은 기존 규칙 엔진에 비해 오탐을 59% 줄이는 데 성공했습니다. 그 결과, 통합 제품군은 단일 콘솔에서 네트워크, 용도 및 ID 계층을 보호하면서 경보 노이즈를 대폭 줄이는 것을 목표로 하는 보안 책임자들로부터 지지를 받고 있습니다.
2025년 매출 중 온프레미스 도입이 53.60%를 차지했으며, 이는 이미 이루어진 투자와 기밀성이 높은 로그를 방화벽 내에 보관해야 하는 데이터 주권 관련 규제를 반영한 것입니다. 그러나 기업들이 SASE 및 제로 트러스트 요구 사항을 채택함에 따라, 클라우드 배포용 보안 분석 시장 규모는 2031년까지 연평균 성장률(CAGR) 20.45%로 확대될 것으로 예측됩니다. 중요한 로그를 온프레미스에 보관하면서, 버스트 분석은 보안이 보장된 클라우드에서 수행하는 실용적인 해결책으로서 하이브리드 모델이 부상하고 있습니다.
미국 국방부의 ‘제로 트러스트 아키텍처 2.0’은 2027년까지 전면적인 적용을 목표로 하고 있으며, 확장성을 확보하기 위해 상용 클라우드 분석을 활용하고 있습니다. 사용량 기반 라이선싱 및 관리형 수집 파이프라인을 통해 자본 지출의 장벽이 해소됨에 따라, 규제가 엄격한 산업 분야에서도 계산 부하가 높은 상관 분석 작업을 외부에 위탁하고 있습니다. 또한, 각 벤더들은 분석의 깊이를 저해하지 않으면서 데이터 상주 요건을 충족하기 위해 지역별 클라우드 ‘셀’을 구축하고 있습니다.
지역별 분석
북미는 2025년에 매출의 41.50%를 차지한 것으로 평가되었으며, 막대한 사이버 보안 예산과 AI 강화형 SIEM의 조기 도입의 혜택을 받고 있습니다. 대통령령 14028호 등 연방 정부의 지침에 따라 지속적인 진단 및 공개가 의무화되어 있으며, 이는 지출을 더욱 촉진하고 있습니다.
아시아태평양은 클라우드 전환, 사이버 보험 보급률의 급증, 그리고 정부 주도의 디지털 프로그램에 힘입어 연평균 성장률(CAGR) 13.25%를 나타낼 것으로 예측됩니다. Gallagher Re의 보고서에 따르면, 아시아태평양의 사이버 보험료는 연간 50% 가까이 증가하고 있습니다. 호주, 싱가포르, 일본, 한국이 지출을 주도하고 있지만, 인도와 중국에서는 국내 대형 기술 기업들이 세계로 사업을 확장함에 따라 신규 도입 건수가 가장 많이 증가하고 있습니다.
라틴아메리카에서는 2025년까지 IT 예산을 64% 확대되었으며, 지역 전체적으로 초당 평균 1,600건의 공격을 대응하기 위한 분석 기능을 우선시하고 있습니다. EMEA 지역의 성장은 견조한 추세를 보이고 있으며, 유럽에서는 GDPR(EU 개인정보보호규정) 및 향후 시행될 사이버 복원력 법이 성장 동력이 되고 있습니다. 한편, 중동·북아프리카의 보안 지출은 석유 및 가스 및 정부 부문의 AI 도입을 계기로 2025년에는 30억 달러를 넘어설 전망입니다.
기타 혜택 :
- 엑셀 형식 시장 예측(ME) 시트
- 3개월간의 애널리스트 지원
자주 묻는 질문
목차
제1장 서론
제2장 조사 방법
제3장 주요 요약
제4장 시장 구도
제5장 시장 규모 및 성장 예측
제6장 경쟁 구도
제7장 시장 기회 및 향후 전망
AJY 26.09.09According to Mordor Intelligence, security analytics market size in 2026 is estimated at USD 23.23 billion, growing from 2025 value of USD 19.40 billion with 2031 projections showing USD 57.16 billion, growing at 19.72% CAGR over 2026-2031.
This report is Segmented by Application (Network Security Analytics, Application Security Analytics, and More), Deployment Mode (On-Premise, Cloud, Hybrid), Organization Size (Large Enterprises, Small and Medium Enterprises), End-User Industry (Banking and Financial Services, Healthcare, and More), and Geography. The Market Forecasts are Provided in Terms of Value (USD).
Global Security Analytics Market Trends and Insights
Sophistication of cyber-threat landscape
Nation-state actors now deploy automated toolchains that evade signature-based defenses, pushing enterprises toward behavioral analytics that detect lateral movement and zero-day exploits. The FBI cited a spike in state-sponsored attacks on telecom carriers aimed at surveillance and data exfiltration. Security teams therefore favor platforms with machine-learning models that self-learn network baselines and flag anomalous paths in milliseconds. Vendors integrate UEBA and threat-intel feeds directly into SIEM engines, shrinking dwell time and improving mean time to detect. This arms race rewards suppliers able to retrain models continuously without manual feature engineering.
Explosive growth of IoT and BYOD endpoints
Industrial sensors, medical devices, and remote-work laptops have swollen the attack surface, leaving perimeter controls ineffective. Research in Scientific Reports found that more than 60% of organizations suffered insider threats tied to unmanaged devices. Modern analytics ingest telemetry from OT gateways, mobile EDR agents, and edge nodes, applying unsupervised learning to classify device behaviors. Edge processing cuts latency and keeps operations running when connectivity drops. Vendors now embed lightweight agents in firmware and combine them with cloud-side graph analytics to correlate anomalies across fleets of millions of endpoints.
Data-integration and tool-sprawl challenges
Most enterprises juggle 25-50 security tools that emit disjointed log schemas, forcing custom parsers and delaying correlation. CSO Online reports that integration overhead drains analyst capacity and obscures cross-vector attacks. Buyers are replacing point solutions with converged analytics suites, yet fear of vendor lock-in slows rip-and-replace projects. As cloud migration compounds complexity, platforms must normalize on-prem Syslog, cloud API metadata, and SaaS audit trails within a single data lake, or risk perpetuating silos.
Other drivers and restraints analyzed in the detailed report include:
- Cloud-first digital-transformation programs
- Expanding global cybersecurity-compliance regimes
- Global shortage of SOC analysts
For complete list of drivers and restraints, kindly check the Table Of Contents.
Segment Analysis
Network security analytics generated 37.40% of 2025 revenue, underscoring the enduring role of deep-packet inspection and NetFlow analysis in the security analytics market. Cloud security analytics is advancing at 16.85% CAGR to 2031 as enterprises shift workloads off-premises and seek cross-cloud visibility. Application, web, and endpoint analytics together broaden detection coverage, while insider-threat modules employ UEBA to profile user behavior.
The convergence of these sub-segments pushes vendors to embed microservices-based collectors that ingest diverse telemetry into unified data fabrics. Platforms offering AI-driven policy recommendations and automated remediation now achieve a 59% drop in false positives versus legacy rule engines. Integrated suites therefore appeal to security leaders aiming to slash alert noise while protecting network, application, and identity layers in one console.
On-premise implementations held 53.60% revenue in 2025, reflecting sunk investments and sovereign-data rules that keep sensitive logs inside firewalls. Yet the security analytics market size for cloud deployments is forecast to expand at a 20.45% CAGR through 2031 as firms adopt SASE and zero-trust mandates. Hybrid models are emerging as a pragmatic bridge-critical logs remain local while burst analysis occurs in secure clouds.
The U.S. Department of Defense's Zero Trust Architecture 2.0 targets full coverage by 2027, leaning on commercial cloud analytics for scalability. Consumption-based licensing and managed ingestion pipelines erase capital expenditure hurdles, enticing even regulated industries to offload compute-intensive correlation tasks. Vendors also deploy regional cloud "cells" to meet data-residency directives without sacrificing analytic depth.
Complete Report Scope:
- By Application
- Network Security Analytics
- Application Security Analytics
- Web Security Analytics
- Endpoint Security Analytics
- Cloud Security Analytics
- Insider Threat Analytics
- By Deployment Mode
- On-Premise
- Cloud
- Hybrid
- By Organization Size
- Large Enterprises
- Small and Medium Enterprises
- By End-user Industry
- Banking and Financial Services
- Healthcare
- Defense and Security
- Telecom and IT
- Retail and E-Commerce
- Manufacturing
- Government
- By Geography
- North America
- United States
- Canada
- Mexico
- Europe
- United Kingdom
- Germany
- France
- Italy
- Spain
- Russia
- Rest of Europe
- Asia-Pacific
- China
- India
- Japan
- South Korea
- Australia
- Rest of Asia-Pacific
- South America
- Brazil
- Argentina
- Rest of South America
- Middle East and Africa
- Middle East
- Saudi Arabia
- United Arab Emirates
- Turkey
- Rest of Middle East
- Africa
- South Africa
- Nigeria
- Rest of Africa
- Middle East
- North America
Geography Analysis
North America commanded 41.50% revenue in 2025, benefitting from sizable cyber-budgets and early uptake of AI-enhanced SIEM. Federal directives such as Executive Order 14028 force continuous diagnostics and disclosure, further fueling spend.
Asia-Pacific is projected to grow at 13.25% CAGR, propelled by cloud migrations, cyber-insurance penetration jumps, and government-backed digital programs. Gallagher Re reports Asia-Pacific cyber-insurance premiums climbing nearly 50% annually. Australia, Singapore, Japan, and South Korea spearhead spending, yet India and China add the largest volume of new deployments as domestic tech champions scale globally.
Latin America eyes 64% IT-budget expansion for 2025, prioritizing analytics that handle a region-wide average of 1,600 attacks per second. EMEA growth remains steady; Europe leans on GDPR and the forthcoming Cyber Resilience Act, while Middle East and North Africa security outlays are set to exceed USD 3 billion in 2025, spurred by AI adoption in oil, gas, and government sectors.
- Alert Logic, Inc.
- Arbor Networks, Inc. (NETSCOUT Systems, Inc.)
- Broadcom Inc. (Symantec Enterprise Division)
- Cisco Systems, Inc.
- RSA Security LLC
- Hewlett Packard Enterprise Company
- International Business Machines Corporation
- LogRhythm, Inc.
- Mandiant, Inc.
- Splunk Inc.
- Fortinet, Inc.
- McAfee, LLC
- Micro Focus International plc
- Securonix, Inc.
- Exabeam, Inc.
- Devo Technology, Inc.
- Microsoft Corporation
- Palo Alto Networks, Inc.
- CrowdStrike Holdings, Inc.
- Elastic N.V.
Additional Benefits:
- The market estimate (ME) sheet in Excel format
- 3 months of analyst support
TABLE OF CONTENTS
1 INTRODUCTION
- 1.1 Study Assumptions and Market Definition
- 1.2 Scope of the Study
2 RESEARCH METHODOLOGY
3 EXECUTIVE SUMMARY
4 MARKET LANDSCAPE
- 4.1 Market Overview
- 4.2 Market Drivers
- 4.2.1 Sophistication of cyber-threat landscape
- 4.2.2 Explosive growth of IoT and BYOD endpoints
- 4.2.3 Cloud-first digital-transformation programs
- 4.2.4 Expanding global cybersecurity-compliance regimes
- 4.2.5 AI-driven polymorphic malware emergence
- 4.2.6 Surge in unmanaged machine-to-machine identities
- 4.3 Market Restraints
- 4.3.1 Data-integration and tool-sprawl challenges
- 4.3.2 Global shortage of SOC analysts
- 4.3.3 High alert-fatigue and false-positive rates
- 4.3.4 Data-sovereignty rules restricting analytics
- 4.4 Value / Supply-Chain Analysis
- 4.5 Regulatory Landscape
- 4.6 Technological Outlook
- 4.7 Porter?s Five Forces
- 4.7.1 Threat of New Entrants
- 4.7.2 Bargaining Power of Buyers/Consumers
- 4.7.3 Bargaining Power of Suppliers
- 4.7.4 Threat of Substitute Products
- 4.7.5 Intensity of Competitive Rivalry
5 MARKET SIZE AND GROWTH FORECASTS
- 5.1 By Application
- 5.1.1 Network Security Analytics
- 5.1.2 Application Security Analytics
- 5.1.3 Web Security Analytics
- 5.1.4 Endpoint Security Analytics
- 5.1.5 Cloud Security Analytics
- 5.1.6 Insider Threat Analytics
- 5.2 By Deployment Mode
- 5.2.1 On-Premise
- 5.2.2 Cloud
- 5.2.3 Hybrid
- 5.3 By Organization Size
- 5.3.1 Large Enterprises
- 5.3.2 Small and Medium Enterprises
- 5.4 By End-user Industry
- 5.4.1 Banking and Financial Services
- 5.4.2 Healthcare
- 5.4.3 Defense and Security
- 5.4.4 Telecom and IT
- 5.4.5 Retail and E-Commerce
- 5.4.6 Manufacturing
- 5.4.7 Government
- 5.5 By Geography
- 5.5.1 North America
- 5.5.1.1 United States
- 5.5.1.2 Canada
- 5.5.1.3 Mexico
- 5.5.2 Europe
- 5.5.2.1 United Kingdom
- 5.5.2.2 Germany
- 5.5.2.3 France
- 5.5.2.4 Italy
- 5.5.2.5 Spain
- 5.5.2.6 Russia
- 5.5.2.7 Rest of Europe
- 5.5.3 Asia-Pacific
- 5.5.3.1 China
- 5.5.3.2 India
- 5.5.3.3 Japan
- 5.5.3.4 South Korea
- 5.5.3.5 Australia
- 5.5.3.6 Rest of Asia-Pacific
- 5.5.4 South America
- 5.5.4.1 Brazil
- 5.5.4.2 Argentina
- 5.5.4.3 Rest of South America
- 5.5.5 Middle East and Africa
- 5.5.5.1 Middle East
- 5.5.5.1.1 Saudi Arabia
- 5.5.5.1.2 United Arab Emirates
- 5.5.5.1.3 Turkey
- 5.5.5.1.4 Rest of Middle East
- 5.5.5.2 Africa
- 5.5.5.2.1 South Africa
- 5.5.5.2.2 Nigeria
- 5.5.5.2.3 Rest of Africa
- 5.5.5.1 Middle East
- 5.5.1 North America
6 COMPETITIVE LANDSCAPE
- 6.1 Market Concentration
- 6.2 Strategic Moves
- 6.3 Market Share Analysis
- 6.4 Company Profiles (includes Global level Overview, Market level overview, Core Segments, Financials as available, Strategic Information, Market Rank/Share for key companies, Products and Services, and Recent Developments)
- 6.4.1 Alert Logic, Inc.
- 6.4.2 Arbor Networks, Inc. (NETSCOUT Systems, Inc.)
- 6.4.3 Broadcom Inc. (Symantec Enterprise Division)
- 6.4.4 Cisco Systems, Inc.
- 6.4.5 RSA Security LLC
- 6.4.6 Hewlett Packard Enterprise Company
- 6.4.7 International Business Machines Corporation
- 6.4.8 LogRhythm, Inc.
- 6.4.9 Mandiant, Inc.
- 6.4.10 Splunk Inc.
- 6.4.11 Fortinet, Inc.
- 6.4.12 McAfee, LLC
- 6.4.13 Micro Focus International plc
- 6.4.14 Securonix, Inc.
- 6.4.15 Exabeam, Inc.
- 6.4.16 Devo Technology, Inc.
- 6.4.17 Microsoft Corporation
- 6.4.18 Palo Alto Networks, Inc.
- 6.4.19 CrowdStrike Holdings, Inc.
- 6.4.20 Elastic N.V.
7 MARKET OPPORTUNITIES AND FUTURE OUTLOOK
- 7.1 White-space and Unmet-need Assessment