
|
시장보고서
상품코드
2121842
복합 이벤트 처리 : 시장 점유율 분석, 업계 동향과 통계, 성장 예측(2026-2031년)Complex Event Processing - Market Share Analysis, Industry Trends & Statistics, Growth Forecasts (2026 - 2031) |
||||||
 Mordor Intelligence
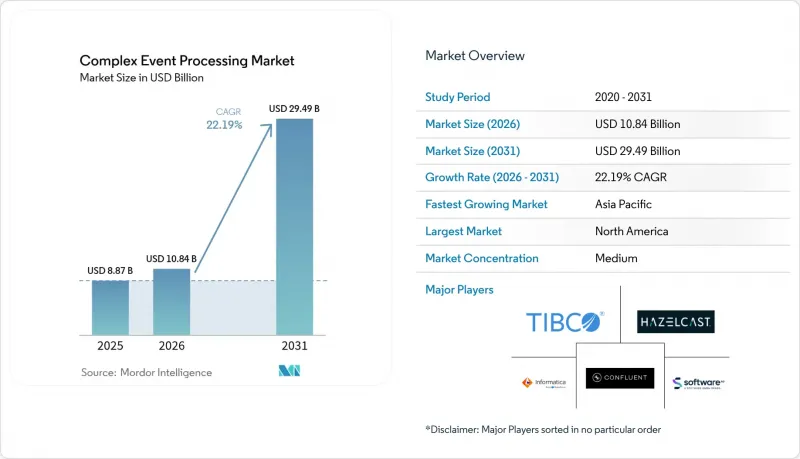
Mordor Intelligence에 따르면 복합 이벤트 처리(CEP) 시장 규모는 2025년 88억 7,000만 달러에서 2026년에는 108억 4,000만 달러로 확대하며, 2026-2031년에 CAGR 22.19%로 추이하며, 2031년에는 294억 9,000만 달러에 달할 것으로 예측됩니다.
이 보고서는 구성 요소(플랫폼, 소프트웨어 툴, 서비스), 배포 방식(클라우드, 온프레미스, 하이브리드), 용도(사기 탐지, 네트워크 모니터링,알고리즘 트레이딩, 예측 유지보수, 기타), 산업 부문(은행·금융 서비스·보험, 통신, 기타), 지역별로 분류되어 있습니다. 시장 전망은 금액(달러) 기준으로 제시되어 있습니다.
글로벌 복합 이벤트 처리 시장의 동향 및 인사이트
이벤트 주도형 마이크로서비스 아키텍처 채택 확대
모놀리식 시스템을 컨테이너화된 워크로드로 분해하고 있는 기업은 동기식 REST 호출이 지연이나 연쇄적인 장애를 유발한다는 사실을 깨닫고 있습니다. 이벤트를 내구성 있는 로그에 공개함으로써, 하류 서비스는 복구 후 놓친 데이터를 재현할 수 있으며, 평균 복구 시간(MTTR)을 단축하고 복원력을 높일 수 있습니다. 골드만삭스는 자사의 이벤트 주도형 결제 플랫폼을 통해 기존 메시지 큐 기반 시스템에 비해 주식 거래 청산 시간을 40% 단축했다고 밝혔습니다. Strimzi와 같은 쿠버네티스 네이티브 제공업체는 클러스터 배포를 자동화하지만, 파티션, 복제 계수, 컨슈머 오프셋을 조정하는 데에는 여전히 희소한 분산 시스템에 대한 전문 지식이 필요합니다. 점점 더 많은 산업이 마이크로서비스를 채택함에 따라 탄력적이고 정확하게 한 번만 처리되는 파이프라인에 대한 안정적인 수요가 복합 이벤트 처리 시장의 성장을 지원하고 있습니다.
산업 현장에서 IoT 생성 데이터량의 급증
현대 자동차 공장에서는 하루에 약 2테라바이트의 실시간 텔레메트리 데이터가 생성되어, 야간 ETL 처리 창을 압도하고 있습니다. 경량 엣지 프로세서는 로봇 용접기의 온도가 사양보다 3℃ 높은 것을 감지하여, 결함이 확대되기 전에 시정 조치를 취할 수 있게 해줍니다. 지멘스(Siemens)는 진동 데이터 스트림을 예측 알고리즘에 통합한 결과, 예기치 않은 가동 중지 시간을 25% 줄이고 1,800만 유로(1,940만 달러)의 비용 절감을 달성했다고 보고했습니다. 엣지 게이트웨이는 노이즈를 필터링하고 비정상 데이터만 전송함으로써 대역폭을 절약하는 동시에 응답 시간을 100밀리초 이하로 억제하고 있습니다. 센서 설치 대수가 급증하고 있는 것이 복합 이벤트 처리 시장의 장기적인 성장 동력이 되고 있습니다.
숙련된 스트림 처리 엔지니어의 부족
대학에서는 이벤트 시간 의미론, 워터마크 전략, 파티션 재조정 이론 등이 거의 가르쳐지지 않기 때문에 기업은 컨설턴트에 의존하거나 사내에서 장기적인 교육 프로그램을 실시할 수밖에 없습니다. 2024년 Confluent의 조사에 따르면 데이터 책임자의 68%가 인재 부족을 도입의 가장 큰 장벽으로 꼽았습니다. 많은 대도시권에서는 채용 공고가 6개월 이상 채워지지 않는 상태가 지속되고 있으며, 프로젝트 예산의 팽창과本番 가동 일정의 지연을 초래하고 있습니다. 매니지드 서비스는 복잡성을 어느 정도 가려주지만, 이사회는 미션 크리티컬한 이벤트 흐름의 아웃소싱에 대해 여전히 신중한 태도를 보이고 있으며, 이러한 제약이 장기화되고 있습니다.
부문 분석
2025년에는 서비스가 매출의 36.28%를 차지하며, 이는 아키텍처 설계, 쿠버네티스 튜닝, 스키마 거버넌스에 전문가의 지원이 필요함을 여실히 보여줍니다. 기업이 SCADA 피드, IoT 텔레메트리, 트랜잭션 데이터베이스를 통합하기 위해 시스템 통합 업체를 활용함에 따라 서비스 부문의 복합 이벤트 처리 시장 규모는 2031년까지 연평균 성장률(CAGR) 23.08%로 확대될 전망입니다. 일반적인 계약 기간은 6-12개월이며, 계약 금액은 50만 달러를 초과하고, 청구 금액은 라이선스 비용을 훨씬 상회합니다. 상용 Kafka, Flink, 벤더 고유의 엔진과 같은 플랫폼은 여전히 견고한 점유율을 유지하고 있지만, 하이퍼스케일러가 관리형 스트리밍을 더 광범위한 클라우드 번들에 통합함에 따라 상품화가 진행되고 있습니다. 오픈소스 대시보드와 CLI가 핵심 기능을 재현함에 따라 부수적인 개발자용 툴은 더욱 강력한 가격 압박에 직면하고 있습니다.
이익률 압박에도 불구하고 플랫폼의 중요성은 여전히 변함없습니다. Apache Kafka나 Pulsar를 표준화하고 있는 기업은 이벤트 백본을 기반으로 삼아, 글로벌 복제, 재해 복구, ‘exactly-once’ 보장을 위해 수년에 걸친 예산을 배정하고 있습니다. 소프트웨어 툴은 개발자 생산성, 스키마 레지스트리, IDE 플러그인, 리니지 추적기에 중점을 두고 있지만, 연간 지출의 10%를 초과하는 경우는 드뭅니다. 따라서 서비스의 방어력은 강화되고 있습니다. 규정 준수 감사, 제로 트러스트 보안 검토, 확장 부하 하에서의 성능 조정에는 모두 인적 모니터링이 필요하며, 그 결과 이 서비스는 복합 이벤트 처리 시장에서 가장 신뢰할 수 있는 기여 요소로 남아 있습니다.
2025년에는 AWS Managed Streaming for Apache Kafka, Azure Event Hubs, Google Pub/Sub이 클러스터 프로비저닝이라는 번거로운 작업을 해소함에 따라 클라우드가 수익의 55.62%를 차지하게 되었습니다. 사용량 기반 과금제는 제품 출시나 플래시 세일시 급증하는 워크로드에 유리하며, 자동 스케일링을 통해 유휴시 비용을 절감합니다. 그러나 안정적인 고처리량을 유지해야 하는 통신 사업자나 자본 시장의 경우, 월간 클라우드 이용료가 5만 달러를 초과하는 것으로 보고되어 온프레미스 쿠버네티스로의 복귀가 진행되고 있습니다. 규제 산업에서는 자율적인 관리와 유연한 분석이 모두 요구되므로 하이브리드 아키텍처의 복합 이벤트 처리 시장 점유율은 23.10%로 가장 빠르게 확대될 전망입니다.
하이브리드 설계는 복잡성을 초래합니다. 기업은 제조 현장의 클러스터와 클라우드 데이터 레이크 간에 ACL, 보안 토큰, 스키마를 동기화해야 합니다. 유럽의 NIS2 사이버 보안 규정에 따라 중요 인프라 사업자는 원시 이벤트 데이터를 국경 내에 보관해야 합니다. 이에 대응하여 각 벤더는 관할 구역 경계를 넘어 전송되는 데이터가 정제된 집계 데이터로만 제한되도록 하는 클러스터 지원 커넥터를 제공하고 있습니다. 예측 기간 중 복합 이벤트 처리 시장에서는 클라우드 제공업체들이 하이브리드 환경의 오케스트레이션을 용이하게 하는 관리형 커넥터에 대한 투자를 강화하는 한편,하드웨어 OEM 업체들은 엣지에서 10밀리초 이하의 지연 시간을 보장하기 위해 경량 Kafka 노드를 산업용 게이트웨이에 통합해 나갈 것으로 예상됩니다.
지역별 분석
북미는 알고리즘 트레이딩, 사기 탐지, 클릭스트림을 통한 개인화 분야의 선구자인 월스트리트 거래 회사와 실리콘밸리의 기술 대기업 덕분에 2025년 매출의 37.62%를 차지했습니다. 벤처 캐피털은 Confluent, Imply, Materialize에 수십억을 투자하여 고도로 숙련된 엔지니어 인재 풀을 구축했습니다. 캘리포니아주 소비자 개인정보 보호법(CCPA)에 따라 실시간 익명화 파이프라인 도입이 촉진되면서 관련 수요가 확대되고 있습니다. 그러나 분산 시스템 엔지니어 부족은 여전히 심각하여 급여 급등과 프로젝트 시작일 지연을 초래하고 있습니다. 중견 기업 도입 업체들은 인력 부족을 피하기 위해 매니지드 서비스를 선택하는 경우가 많으며, 이로 인해 복합 이벤트 처리 시장에서 서비스 제공업체의 성장이 촉진되고 있습니다.
아시아태평양은 2031년까지 연평균 성장률(CAGR) 23.48%를 기록하며 가장 빠른 성장세를 보이고 있습니다. 중국의 스마트 시티 프로그램에서는 신호등, 공공요금 계량기, 감시 카메라에 센서가 설치되어 페타바이트 규모의 이벤트 데이터가 지휘 센터로 스트리밍되고 있습니다. 인도의 통합 결제 인터페이스(UPI)는 2024년 10월 114억 건의 거래를 처리했으며, 1초 이내의 결제 처리와 부정 행위 탐지가 요구되고 있습니다. 일본의 공장에서는 노동력 고령화를 보완하기 위해 예측 유지보수의 자동화가 진행되고 있으며, 한국의 통신 사업자는 실시간 자원 할당에 의존하는 5G 네트워크 슬라이싱을 도입하고 있습니다. 중국의 ‘개인정보보호법(PIPL)’ 등 주권 데이터법에 따라 국내 클러스터화가 의무화되면서 인프라 중복 비용은 증가하는 반면, 현지 벤더의 수익도 증가하여 복합 이벤트 처리 시장을 더욱 확대시키고 있습니다.
유럽에서는 독일, 프랑스, 스웨덴의 자동차 텔레매틱스 및 산업용 IoT 도입이 시장을 주도하고 있습니다. GDPR, NIS2, 제정이 예정된 AI법은 엄격한 데이터 계보 및 동의 의무를 부과하고 있으며, 모든 이벤트의 변환을 정확하게 추적할 수 있는 플랫폼이 유리합니다. 두바이와 사우디아라비아를 비롯한 중동의 스마트 시티 메가 프로젝트에서는 교통 흐름을 유도하고 에너지 그리드를 최적화하기 위해 스트리밍 분석이 활용되고 있습니다. 아프리카의 시장은 아직 초기 단계이지만, 마이크로페이먼트를 거의 실시간으로 송금하는 모바일 머니 생태계를 통해 미래성이 기대되고 있습니다. 남미에서는 브라질에 활동이 집중되어 있으며, 해당 국가의 은행들은 Pix 결제 부정 사용 방지 대책으로 CEP 엔진을 도입하고 있습니다. 전반적으로 규제, 통신 환경, 산업의 성숙도 측면에서 지역별 차이가 다양한 수요 구조를 만들어내며, 복합 이벤트 처리 시장을 활성화시키고 있습니다.
기타 혜택
- 엑셀 형식의 시장 예측(ME) 시트
- 3개월간의 애널리스트 지원
자주 묻는 질문
목차
제1장 서론
제2장 조사 방법
제3장 개요
제4장 시장 구도
제5장 시장 규모와 성장 예측
제6장 경쟁 구도
제7장 시장 기회와 향후 전망
KSA 26.09.03According to Mordor Intelligence, the complex event processing market size is expected to grow from USD 8.87 billion in 2025 to USD 10.84 billion in 2026 and is forecast to reach USD 29.49 billion by 2031 at 22.19% CAGR over 2026-2031.
This report is Segmented by Component (Platforms, Software Tools, and Services), Deployment Mode (Cloud, On-Premises, and Hybrid), Application (Fraud Detection, Network Monitoring, Algorithmic Trading, Predictive Maintenance, and More), Industry Vertical (Banking Financial Services and Insurance, Telecommunications, and More), and Geography. The Market Forecasts are Provided in Terms of Value (USD).
Global Complex Event Processing Market Trends and Insights
Rising Adoption of Event-Driven Microservices Architectures
Firms decomposing monoliths into containerized workloads notice that synchronous REST calls propagate latency and cascading failure. Publishing events to durable logs lets downstream services replay missed data after recovery, trimming mean time to recovery and boosting resilience. Goldman Sachs disclosed that its event-driven settlement platform shortened equity trade clearance time by 40% compared with message-queue predecessors. Kubernetes-native operators such as Strimzi automate cluster rollout, yet tuning partitions, replication factors and consumer offsets still demands scarce distributed-systems expertise. As additional industries embrace microservices, steady demand for elastic, exactly-once pipelines sustains growth in the complex event processing market.
Escalating IoT-Generated Data Volumes in Industrial Settings
A modern automotive plant emits nearly 2 terabytes of real-time telemetry per day, overwhelming nightly ETL windows. Lightweight edge processors detect robotic welder temperatures that drift 3 °C above spec, enabling corrections before defects propagate. Siemens reported a 25% cut in unplanned downtime and EUR 18 million (USD 19.4 million) cost avoidance once vibration streams flowed into predictive algorithms. Edge gateways filter noise and forward only anomalies, conserving bandwidth and keeping response below 100 milliseconds. The surging sensor footprint anchors long-run momentum for the complex event processing market.
Shortage of Skilled Stream-Processing Engineers
Universities rarely teach event-time semantics, watermark strategies or partition-rebalance theory, forcing firms to rely on consultants or lengthy internal boot camps. A 2024 Confluent survey found 68% of data leaders citing talent scarcity as the top adoption barrier. Roles stay unfilled for six months or longer in many metros, inflating project budgets and delaying production timelines. Managed services partly mask complexity, yet boards remain cautious about outsourcing mission-critical event flows, prolonging the constraint.
Other drivers and restraints analyzed in the detailed report include:
- Integration of AI and ML for Real-Time Predictive Analytics
- Surge in Instant Fraud Detection Requirements Across BFSI
- Legacy System Integration Complexity in Large Enterprises
For complete list of drivers and restraints, kindly check the Table Of Contents.
Segment Analysis
Services generated 36.28% revenue in 2025, underscoring that architecture design, Kubernetes tuning and schema governance require expert support. Complex event processing market size for services is set to climb at a 23.08% CAGR through 2031 as enterprises engage system integrators to unify SCADA feeds, IoT telemetry and transactional databases. Typical engagements last 6-12 months and exceed USD 500,000, a billable base that dwarfs license fees. Platforms, including commercial Kafka, Flink, and vendor-specific engines, retain a healthy share; however, commoditization rises as hyperscalers integrate managed streaming into broader cloud bundles. Ancillary developer tools face even stronger price pressure because open-source dashboards and CLIs replicate core functionality.
Despite margin compression, platforms still matter. Enterprises standardizing on Apache Kafka or Pulsar treat the event backbone as foundational, allocating multiyear budgets for global replication, disaster recovery and exactly-once guarantees. Software tooling focuses on developer productivity, schema registries, IDE plugins, lineage trackers, but seldom represents more than 10% of annual spend. The defensibility of services therefore strengthens. Compliance audits, zero-trust security reviews and performance retuning under scaling load all demand human oversight, keeping services as the most reliable contributor to the complex event processing market.
Cloud accounted for 55.62% revenue in 2025 as AWS Managed Streaming for Apache Kafka, Azure Event Hubs and Google Pub/Sub removed the toil of provisioning clusters. Usage-based pricing benefits spiky workloads that spike during product launches or flash sales, and auto-scaling curbs idle spend. Yet telecom operators and capital-market venues with steady high throughput report monthly cloud bills topping USD 50,000, nudging repatriation to on-premises Kubernetes. Complex event processing market share for hybrid architectures will expand fastest at 23.10% because regulated industries need both sovereign control and elastic analytics.
Hybrid design creates complexity. Enterprises must synchronize ACLs, security tokens and schemas between plant-floor clusters and cloud data lakes. European NIS2 cybersecurity rules push critical-infrastructure operators to keep raw events inside national borders. Vendors respond by shipping cluster-aware connectors that propagate only sanitized aggregates across jurisdictional boundaries. Over the forecast horizon, the complex event processing market will witness cloud providers doubling down on managed connectors that ease hybrid orchestration, while hardware OEMs integrate lightweight Kafka nodes into industrial gateways to guarantee sub-10-millisecond latency at the edge.
Complete Report Scope:
- By Component
- Platforms
- Software Tools
- Services
- By Deployment Mode
- Cloud
- On-Premises
- Hybrid
- By Application
- Fraud Detection
- Network Monitoring
- Algorithmic Trading
- Predictive Maintenance
- Sales and Marketing
- Other Application
- By Industry Vertical
- Banking, Financial Services and Insurance
- Telecommunications
- Retail and E-Commerce
- Manufacturing
- Healthcare
- Government and Defense
- Energy and Utilities
- Other Industry Vertical
- By Geography
- North America
- United States
- Canada
- Mexico
- Europe
- Germany
- United Kingdom
- France
- Italy
- Rest of Europe
- Asia-Pacific
- China
- Japan
- India
- South Korea
- Australia
- Rest of Asia-Pacific
- Middle East and Africa
- Middle East
- Saudi Arabia
- United Arab Emirates
- Rest of Middle East
- Africa
- South Africa
- Egypt
- Rest of Africa
- Middle East
- South America
- Brazil
- Argentina
- Rest of South America
- North America
Geography Analysis
North America controlled 37.62% revenue in 2025 thanks to Wall Street trading firms and Silicon Valley technology giants that pioneered algorithmic trading, fraud detection and clickstream personalization. Venture investors funneled billions into Confluent, Imply and Materialize, building a deep engineering talent pool. The California Consumer Privacy Act pushes real-time anonymization pipelines, expanding addressable demand. Yet a shortage of distributed-systems engineers remains acute, inflating salaries and delaying project start dates. Mid-market adopters often choose managed services to sidestep the talent gap, fueling service-provider growth inside the complex event processing market.
Asia Pacific registers the fastest growth at 23.48% CAGR through 2031. Chinese smart-city programs instrument traffic lights, utility meters and surveillance cameras, streaming petabytes of events to command centers. India's Unified Payments Interface processed 11.4 billion transactions in October 2024, requiring sub-second clearing and fraud detection. Japanese factories automate predictive maintenance to offset workforce aging, and South Korean carriers use 5G network slicing that depends on real-time resource allocation. Sovereign data laws such as China's PIPL force in-country clusters, raising duplicate infrastructure costs but simultaneously boosting local vendor revenues, further enlarging the complex event processing market.
Europe benefits from automotive telematics and industrial IoT rollouts in Germany, France and Sweden. GDPR, NIS2 and the pending AI Act impose strict lineage and consent obligations that favor platforms capably tracking every event transformation. Middle East smart-city megaprojects in Dubai and Saudi Arabia rely on streaming analytics to route traffic and optimize energy grids. Africa remains nascent yet shows promise through mobile-money ecosystems that transfer micro-payments in near real time. South America concentrates activity in Brazil, where banks deploy CEP engines to combat Pix payment fraud. Overall, regional variances in regulation, connectivity and industrial maturity ensure a diverse demand landscape that enriches the complex event processing market.
- Confluent, Inc.
- TIBCO Software Inc.
- Software AG
- Informatica Inc.
- Hazelcast, Inc.
- SAS Institute Inc.
- EsperTech, Inc.
- Striim, Inc.
- StreamSets, Inc.
- Impetus Technologies, Inc.
- Nastel Technologies, Inc.
- WSO2 LLC
- Red Hat, Inc.
- Cloudera, Inc.
- Amazon Web Services, Inc.
- IBM Corporation
- Oracle Corporation
- Google LLC
- Hitachi Vantara LLC
- Imply Data, Inc.
- Kafkaesque Technologies Ltd.
- Bentley Systems, Incorporated
Additional Benefits:
- The market estimate (ME) sheet in Excel format
- 3 months of analyst support
TABLE OF CONTENTS
1 INTRODUCTION
- 1.1 Study Assumptions and Market Definition
- 1.2 Scope of the Study
2 RESEARCH METHODOLOGY
3 EXECUTIVE SUMMARY
4 MARKET LANDSCAPE
- 4.1 Market Overview
- 4.2 Market Drivers
- 4.2.1 Rising Adoption of Event-Driven Microservices Architectures
- 4.2.2 Escalating IoT-Generated Data Volumes in Industrial Settings
- 4.2.3 Integration of AI and ML for Real-Time Predictive Analytics
- 4.2.4 Surge in Instant Fraud Detection Requirements Across BFSI
- 4.2.5 Expansion of Edge Computing for Ultra-Low Latency Processing
- 4.2.6 Venture Capital Inflows into Pure-Play Stream Processing Start-Ups
- 4.3 Market Restraints
- 4.3.1 Shortage of Skilled Stream-Processing Engineers
- 4.3.2 Legacy System Integration Complexity in Large Enterprises
- 4.3.3 Data Sovereignty and Privacy Compliance Hurdles
- 4.3.4 High Cloud Consumption Costs for High-Throughput Workloads
- 4.4 Industry Value Chain Analysis
- 4.5 Regulatory Landscape
- 4.6 Technological Outlook
- 4.7 Porter's Five Forces Analysis
- 4.7.1 Threat of New Entrants
- 4.7.2 Bargaining Power of Suppliers
- 4.7.3 Bargaining Power of Buyers
- 4.7.4 Threat of Substitutes
- 4.7.5 Competitive Rivalry
- 4.8 Impact of Macroeconomic Factors
5 MARKET SIZE AND GROWTH FORECASTS (VALUE)
- 5.1 By Component
- 5.1.1 Platforms
- 5.1.2 Software Tools
- 5.1.3 Services
- 5.2 By Deployment Mode
- 5.2.1 Cloud
- 5.2.2 On-Premises
- 5.2.3 Hybrid
- 5.3 By Application
- 5.3.1 Fraud Detection
- 5.3.2 Network Monitoring
- 5.3.3 Algorithmic Trading
- 5.3.4 Predictive Maintenance
- 5.3.5 Sales and Marketing
- 5.3.6 Other Application
- 5.4 By Industry Vertical
- 5.4.1 Banking, Financial Services and Insurance
- 5.4.2 Telecommunications
- 5.4.3 Retail and E-Commerce
- 5.4.4 Manufacturing
- 5.4.5 Healthcare
- 5.4.6 Government and Defense
- 5.4.7 Energy and Utilities
- 5.4.8 Other Industry Vertical
- 5.5 By Geography
- 5.5.1 North America
- 5.5.1.1 United States
- 5.5.1.2 Canada
- 5.5.1.3 Mexico
- 5.5.2 Europe
- 5.5.2.1 Germany
- 5.5.2.2 United Kingdom
- 5.5.2.3 France
- 5.5.2.4 Italy
- 5.5.2.5 Rest of Europe
- 5.5.3 Asia-Pacific
- 5.5.3.1 China
- 5.5.3.2 Japan
- 5.5.3.3 India
- 5.5.3.4 South Korea
- 5.5.3.5 Australia
- 5.5.3.6 Rest of Asia-Pacific
- 5.5.4 Middle East and Africa
- 5.5.4.1 Middle East
- 5.5.4.1.1 Saudi Arabia
- 5.5.4.1.2 United Arab Emirates
- 5.5.4.1.3 Rest of Middle East
- 5.5.4.2 Africa
- 5.5.4.2.1 South Africa
- 5.5.4.2.2 Egypt
- 5.5.4.2.3 Rest of Africa
- 5.5.4.1 Middle East
- 5.5.5 South America
- 5.5.5.1 Brazil
- 5.5.5.2 Argentina
- 5.5.5.3 Rest of South America
- 5.5.1 North America
6 COMPETITIVE LANDSCAPE
- 6.1 Market Concentration
- 6.2 Strategic Moves
- 6.3 Market Share Analysis
- 6.4 Company Profiles (includes Global Level Overview, Market Level Overview, Core Segments, Financials as Available, Strategic Information, Market Rank/Share for Key Companies, Products and Services, and Recent Developments)
- 6.4.1 Confluent, Inc.
- 6.4.2 TIBCO Software Inc.
- 6.4.3 Software AG
- 6.4.4 Informatica Inc.
- 6.4.5 Hazelcast, Inc.
- 6.4.6 SAS Institute Inc.
- 6.4.7 EsperTech, Inc.
- 6.4.8 Striim, Inc.
- 6.4.9 StreamSets, Inc.
- 6.4.10 Impetus Technologies, Inc.
- 6.4.11 Nastel Technologies, Inc.
- 6.4.12 WSO2 LLC
- 6.4.13 Red Hat, Inc.
- 6.4.14 Cloudera, Inc.
- 6.4.15 Amazon Web Services, Inc.
- 6.4.16 IBM Corporation
- 6.4.17 Oracle Corporation
- 6.4.18 Google LLC
- 6.4.19 Hitachi Vantara LLC
- 6.4.20 Imply Data, Inc.
- 6.4.21 Kafkaesque Technologies Ltd.
- 6.4.22 Bentley Systems, Incorporated
7 MARKET OPPORTUNITIES AND FUTURE OUTLOOK
- 7.1 White-Space and Unmet-Need Assessment