

|
시장보고서
상품코드
2121848
약물감시 및 약물 안전 소프트웨어 : 시장 점유율 분석, 업계 동향과 통계, 성장 예측(2026-2031년)Pharmacovigilance And Drug Safety Software - Market Share Analysis, Industry Trends & Statistics, Growth Forecasts (2026 - 2031) |
||||||
 Mordor Intelligence
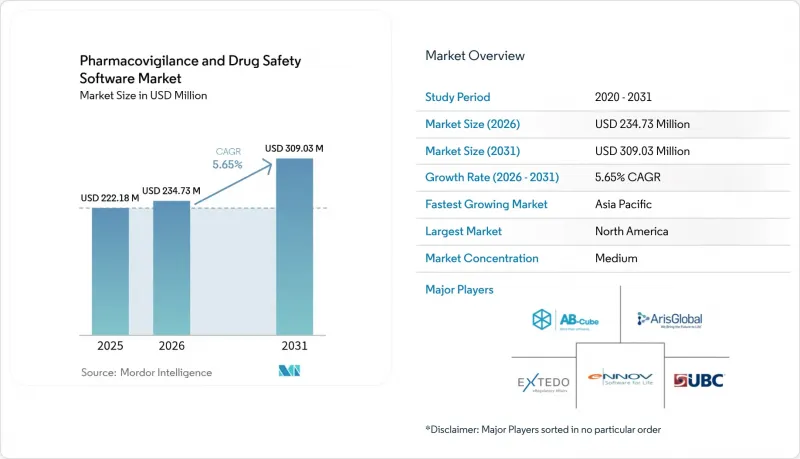
Mordor Intelligence에 따르면 2026년 약물감시 소프트웨어 시장의 규모는 2억 3,473만 달러로 추정되고 있으며, 2025년 2억 2,218만 달러에서 확대하며, 2031년에는 3억 903만 달러에 달할 것으로 예측됩니다.
2026-2031년까지 연평균 성장률(CAGR) 5.65%로 성장할 것으로 전망됩니다.
이 보고서는 기능별(유해사건 보고 소프트웨어, 의약품 안전성 감사 소프트웨어, 기타), 제공 형태별(온프레미스, 클라우드/SaaS, 기타), 최종사용자별(제약·바이오기술 기업, 수탁 연구 기관, 기타), 지역별(북미, 유럽, 아시아태평양, 기타)로 분류되어 있습니다. 시장 규모와 전망은 금액(달러) 기준으로 제시되어 있습니다.
전 세계 약물감시 및 약물 안전 소프트웨어 시장의 동향과 인사이트
약물 이상반응(ADR) 발생률 증가
신규 분자 실체의 사용이 확대됨에 따라 ADR 발생률이 높아지면서, 정밀 모니터링에 대한 수요가 재편되고 있습니다. Cureus Journal의 데이터에 따르면 현재 21-40세 연령대에서 ADR 발생 빈도가 가장 높은데, 이는 다제 병용 및 병원내 접촉 증가를 반영한 것입니다. FDA가 2024년에 50건의 신규 분자 실체를 승인함에 따라 후원 기업은 이전에 볼 수 없었던 안전성 신호를 탐지하기 위해 다양한 환자 하위 집단을 모니터링해야 합니다. 생물제제나 유전자 치료는 유전적 배경에 따라 반응이 달라질 수 있으며, 상황을 더욱 복잡하게 만들고 있습니다. 따라서 약물감시 소프트웨어 시장은 정적인 보고서 저장소에서 이질적인 종단적 데이터세트를 분석할 수 있는 RWE(Real World Evidence) 엔진으로 전환되고 있습니다. 수동 방식으로는 처리량과 복잡성을 감당할 수 없기 때문에 AI를 활용한 패턴 인식을 보고 워크플로우에 통합한 벤더들의 입지가 강화되고 있습니다.
전 세계 E2B(R3)/IDMP 규정 준수를 위한 엄격한 기한
2026년 4월은 FDA의 E2B(R3) 제출 마감일이며, 스폰서는 기존의 R2 형식을 폐지하고 업그레이드된 플랫폼에 투자할 수밖에 없습니다. 동시에, 유럽의약품청(EMA)의 IDMP 도입으로 의약품 데이터 요건이 엄격해짐에 따라 이벤트 식별자와 제품 식별자를 모두 단일 스키마로 관리할 수 있는 소프트웨어가 요구되고 있습니다. 이중 시스템을 유지하는 것은 위험과 간접비를 증가시키기 때문에 각 기업은 법규 시행에 앞서 전환을 가속화하고 있습니다. 이러한 규제의 동기화로 인해 규정 준수 강화를 위한 지출은 재량적 예산 항목이 아닌 확실한 지출이 되었으며, 이는 약물감시 소프트웨어 시장의 예측 가능한 성장을 지원하고 있습니다.
데이터 주권 및 국경 간 데이터 이전 제한
2025년 5월에 시행될 ‘유럽 건강 데이터 공간 규정(European Health Data Space Regulation)’은 2차 건강 데이터 이용에 관한 새로운 기준을 정하고, 소프트웨어가 준수해야 할 동의 단계를 도입하고 있습니다. GDPR은 이미 외부 처리를 제한하고 있으며, 아시아와 라틴아메리카에서도 유사한 프레임워크가 등장하고 있습니다. 따라서 벤더는 데이터를 국내에 보관하면서도 익명화된 신호를 전 세계에서 공유할 수 있는 연합형(federated) 모델을 설계해야 합니다. 이러한 아키텍처는 비용을 증가시키고 도입 주기를 장기화시키므로, 약물감시 소프트웨어 시장의 확장을 부분적으로 억제하는 요인이 되고 있습니다.
부문 분석
2025년, 이상반응 보고 소프트웨어는 약물감시 소프트웨어 시장에서 40.22%라는 압도적인 점유율을 유지하며, 규정 준수의 필수적인 축으로서의 위상을 입증했습니다. 그러나 신호 탐지 및 위험 관리 모듈은 연평균 성장률(CAGR) 17.5%로 성장할 것으로 예측되며, 이는 규제 당국이 개입하기 전에 이상 징후를 감지하는 예방적 분석으로의 전환이 진행되고 있음을 보여줍니다. 현재 많은 스폰서들은 접수, 분류, 분석, 제출을 하나의 워크플로로 통합한 통합 플랫폼을 선호하고 있습니다. 오라클은 2024년에 ‘Argus’에 AI를 활용한 조건부 비접촉 처리 기능을 추가함으로써, 내장형 인텔리전스가 레거시 솔루션을 어떻게 개선할 수 있는지 보여주었습니다. 생물제제의 승인 건수가 지속적으로 증가하고 다양한 RWD(Real World Data) 피드가 결합됨에 따라 인종, 유전체, 건강의 사회적 결정 요인에 관한 데이터세트 간의 상관관계를 도출해 낼 수 있는 플랫폼의 기회가 확대되고 있습니다.
통합 제품군은 단일 품질관리 시스템으로 여러 모듈을 포괄할 수 있으므로 검증에 드는 부담도 줄여줍니다. 그 결과, 포인트 솔루션을 엔드투엔드 아키텍처에 통합할 수 있는 벤더는 틈새 시장 경쟁사보다 빠른 속도로 도입 기반을 확대하고 있습니다. 신호 탐지 유닛의 수익은 궁극적으로 이벤트 보고 수익을 능가할 가능성이 있지만, 규제 당국에 대한 신청은 여전히 소스 케이스 데이터를 기반으로 하므로 두 모듈은 상호 보완적인 관계를 유지하고 있습니다. 따라서 보고 기능은 여전히 기초적인 중요성을 유지하고 있지만, 고도화된 분석에 기인한 약물감시 소프트웨어 시장 규모는 전체 시장보다 빠르게 확대될 전망입니다.
지역별 분석
2025년에는 북미가 매출 점유율 35.55%로 1위를 차지했습니다. 이는 FDA의 엄격한 감독과 상위 20개 제약사가 고밀도로 집중되어 있는 것이 요인으로 작용했습니다. 많은 지역 후원사들은 2020년 이전에 클라우드 기반 안전성 관리 시스템을 선구적으로 도입했으며, 화이자의 COVAES 플랫폼은 자동 분류 및 중복 제거 기능을 활용하여 150만 건 이상의 COVID-19 백신 사례를 처리했습니다. FDA가 2025년에 최고 AI 책임자(CIO) 직책을 신설한 것은 해당 규제 당국이 알고리즘을 통한 신청서를 평가할 준비가 되어 있음을 나타내며, AI를 광범위하게 활용한 시스템으로의 업그레이드에 대한 지역내 수요를 지원하고 있습니다. 인력 부족은 여전히 장벽으로 작용하고 있으며, 데이터 과학 전문가의 급여를 상승시키고, 중소기업이 아웃소싱을 선택할 수밖에 없게 만들고 있습니다.
아시아태평양은 한국, 대만, 싱가포르로의 임상 시험 이전을 배경으로 13.9%라는 가장 높은 연평균 성장률(CAGR)을 기록하고 있으며, 이 지역들은 윤리위원회의 심사 기간이 짧아 피험자 모집이 가속화되고 있습니다. 우시 앱텍(Wuxi AppTec)이 주도하는 중국의 확대되는 계약연구기관(CRO) 시장은 국가의약품감독관리국(NMPA) 규정을 준수하는 현지 약물감시(PV) 역량을 필요로 하는 전 세계 고객들을 유치하고 있습니다. 일본 AMED의 AI를 활용한 의약품 안전성 연구에 대한 보조금 등 정부 투자 프로그램은 국내 소프트웨어 도입을 더욱 촉진하고 있습니다. 법제도는 다양하지만, 아시아태평양의 많은 규제 당국이 현재 ICH E2B(R3) XML을 수용하고 있으며, 현지화 장벽이 낮아지고 있습니다.
유럽에서는 성숙한 의약품 모니터링(PV) 의무와 GDPR(일반 데이터 보호 규정)로 인해 설정 변경이 가능하고 감사에 대응할 수 있는 플랫폼에 대한 수요가 높아지고 있으며, 여전히 큰 시장 규모를 유지하고 있습니다. ‘유럽 건강 데이터 스페이스 규정’에 따라 2차 건강 데이터의 활용이 공식적으로 허용됨에 따라 스폰서는 세밀한 동의 관리가 가능한 소프트웨어 도입을 서둘러야 하는 상황입니다. 독일의 새로운 ‘디지털법’은 조사 목적을 위한 비식별화된 청구 데이터세트의 이용을 허용함으로써, 그동안 이용이 제한되었던 국내 저장소에서 안전성 알고리즘을 통한 데이터 추출을 가능하게 하고 있습니다. 그러나 엄격한 데이터 주권 조항에 따라 EU내 호스팅이 의무화됨에 따라 지역별 전용 클라우드 영역에 대한 수요가 증가하고 있습니다. 이러한 동향이 맞물리면서 성장률은 아시아태평양에 미치지 못하지만, 유럽은 여전히 기능이 풍부한 플랫폼에게 중요한 시장으로 남아 있습니다.
기타 혜택
- 엑셀 형식의 시장 예측(ME) 시트
- 3개월간의 애널리스트 지원
자주 묻는 질문
목차
제1장 서론
제2장 조사 방법
제3장 개요
제4장 시장 구도
제5장 시장 규모와 성장 예측
제6장 경쟁 구도
제7장 시장 기회와 향후 전망
KSA 26.09.03According to Mordor Intelligence, the pharmacovigilance software market size in 2026 is estimated at USD 234.73 million, growing from 2025 value of USD 222.18 million with 2031 projections showing USD 309.03 million, growing at 5.65% CAGR over 2026-2031.
This report is Segmented by Functionality (Adverse Event Reporting, Drug Safety Audit Software, and More), Mode of Delivery (On-Premise, Cloud/SaaS, and More), End User (Pharmaceutical & Biotechnology Companies, Contract Research Organizations, and More), and Geography (North America, Europe, Asia-Pacific, and More). The Market Sizes and Forecasts are Provided in Terms of Value (USD).
Global Pharmacovigilance And Drug Safety Software Market Trends and Insights
Rising Incidence of Adverse Drug Reactions (ADRs)
Escalating ADR prevalence reshapes demand for advanced monitoring as new molecular entities enter wider use. Cureus Journal data show the 21-40 age group now reports the highest ADR frequencies, reflecting greater polypharmacy and increased hospital interactions. With the FDA approving 50 new molecular entities in 2024, sponsors must surveil diverse patient sub-populations for previously unseen safety signals. Biologics and gene therapies add complexity because reactions can vary across genetic backgrounds. Accordingly, the pharmacovigilance software market shifts from static report repositories toward real-world evidence engines capable of analyzing heterogeneous longitudinal datasets. Vendors that embed AI-powered pattern recognition into reporting workflows gain relevance because manual methods cannot keep pace with volume and complexity.
Stringent Global E2B(R3)/IDMP Compliance Deadlines
April 2026 marks the FDA's cut-off for E2B(R3) submissions, forcing sponsors to abandon legacy R2 formats and invest in upgraded platforms. Simultaneously, the European Medicines Agency's IDMP roll-out tightens medicinal-product data requirements, compelling software to manage both event and product identifiers in one schema. Dual-system maintenance inflates risk and overhead, so firms accelerate migration ahead of statute. This regulatory synchrony turns spending on compliance upgrades into a certainty rather than a discretionary budget item, underpinning predictable growth for the pharmacovigilance software market.
Data-Sovereignty & Cross-Border-Transfer Restrictions
The European Health Data Space Regulation, effective May 2025, sets new standards for secondary health-data use and introduces consent layers that software must honor. GDPR already limits external processing, and similar frameworks are emerging in Asia and Latin America. Vendors must therefore design federated models that keep data in the country while sharing de-identified signals globally. This architecture raises costs and elongates deployment cycles, damping part of the pharmacovigilance software market's expansion.
Other drivers and restraints analyzed in the detailed report include:
- Cloud-First Migration of Safety Databases
- Explainable-AI Modules Slash Case-Processing Costs
- Shortage of PV Data-Science Talent
For complete list of drivers and restraints, kindly check the Table Of Contents.
Segment Analysis
Adverse events reporting software retained a commanding 40.22% share of the pharmacovigilance software market in 2025, underscoring its status as a non-negotiable compliance pillar. Yet signal detection and risk-management modules are forecast to grow at an 17.5% CAGR, demonstrating the pivot toward preventive analytics that flag anomalies before regulators intervene. Many sponsors now favor unified platforms that merge intake, triage, analytics, and submission into one workflow. Oracle added AI-powered conditional touchless processing to Argus in 2024, illustrating how embedded intelligence elevates legacy solutions. Continuous rise in biological approvals coupled with diverse real-world data feeds widens the opportunity for platforms that draw correlations across ethnic, genomic, and social determinants of health datasets.
Integrated suites also reduce validation overhead because a single quality-management system covers multiple modules. As a result, vendors capable of harmonizing point solutions into end-to-end architecture are expanding their installed bases faster than niche competitors. Signal detection units may ultimately outpace event-reporting revenue, yet both modules remain symbiotic because regulatory filings still stem from source case data. The pharmacovigilance software market size attributable to advanced analytics is therefore set to climb more rapidly than the aggregate market, even as reporting retains foundational relevance.
Complete Report Scope:
- By Functionality
- Adverse Event Reporting Software
- Drug Safety Audit Software
- Issue Tracking Software
- Fully Integrated Safety Suites
- Signal Detection & Risk-Management Tools
- By Mode of Delivery
- On-premise
- Cloud / SaaS
- Hybrid Deployment
- By End User
- Pharmaceutical & Biotechnology Companies
- Contract Research Organizations (CROs)
- Business-Process-Outsourcing (BPO) Firms
- Medical-Device Manufacturers
- Other PV Service Providers
- Geography
- North America
- United States
- Canada
- Mexico
- Europe
- Germany
- United Kingdom
- France
- Italy
- Spain
- Rest of Europe
- Asia Pacific
- China
- Japan
- India
- South Korea
- Australia
- Rest of Asia Pacific
- Middle East and Africa
- GCC
- South Africa
- Rest of Middle East and Africa
- South America
- Brazil
- Argentina
- Rest of South America
- North America
Geography Analysis
North America led with 35.55% revenue share in 2025, anchored by stringent FDA oversight and a dense concentration of top 20 pharmaceutical companies. Many regional sponsors pioneered cloud-based safety systems before 2020; Pfizer's COVAES platform processed more than 1.5 million COVID-19 vaccine cases using automated triage and de-duplication. The FDA's 2025 creation of a chief AI officer underscores the regulator's readiness to evaluate algorithmic submissions, reinforcing regional appetite for AI-rich upgrades. Talent shortages remain a hurdle, inflating salaries for data-science specialists and pressuring smaller firms to outsource.
Asia Pacific records the fastest 13.9% CAGR on the back of clinical-trial migration to South Korea, Taiwan and Singapore, where shorter ethics-committee timelines accelerate recruitment. China's expanding contract research landscape, led by Wuxi AppTec, pulls in global clients that need local PV capacity aligned with National Medical Products Administration rules. Government investment programs, such as Japan's AMED grants for AI drug-safety research, further stimulate domestic software adoption. Despite diverse legal frameworks, many Asia-Pacific regulators now accept ICH E2B(R3) XML, reducing localization barriers.
Europe maintains significant scale because mature pharmacovigilance obligations and GDPR heightens the need for configurable, audit-ready platforms. The European Health Data Space Regulation formalizes secondary health-data use, prompting sponsors to adopt software capable of granular consent management. Germany's new Digital Act unlocks de-identified claims datasets for research, enabling safety algorithms to mine national repositories once off-limits. However, strict data-sovereignty clauses require EU-based hosting, spurring demand for region-specific cloud zones. Collectively, these dynamics keep Europe a premium market for feature-rich platforms even though growth trails Asia Pacific.
- Oracle
- Aris Global
- Veeva Systems
- Sparta Systems
- IQVIA
- Ennov Solutions
- Extedo
- AB Cube
- Anju Software
- Sarjen Systems
- United BioSource Corp.
- Accenture
- Cognizant
- Tata Consultancy Services (TCS ADD)
- Parexel International
- Medidata Solutions
- Saama Technologies
- Intellimed (Vigilance 360)
Additional Benefits:
- The market estimate (ME) sheet in Excel format
- 3 months of analyst support
TABLE OF CONTENTS
1 Introduction
- 1.1 Study Assumptions & Market Definition
- 1.2 Scope of the Study
2 Research Methodology
3 Executive Summary
4 Market Landscape
- 4.1 Market Overview
- 4.2 Market Drivers
- 4.2.1 Rising Incidence Of Adverse Drug Reactions (ADRs)
- 4.2.2 Stringent Global E2B(R3)/IDMP Compliance Deadlines
- 4.2.3 Cloud-First Migration Of Safety Databases
- 4.2.4 Explainable-AI Modules Slash Case-Processing Costs
- 4.2.5 Real-World-Evidence (RWE) Integration For Early Signals
- 4.2.6 Low-Code Localisation For Emerging-Market Forms
- 4.3 Market Restraints
- 4.3.1 Data-Sovereignty & Cross-Border-Transfer Restrictions
- 4.3.2 Shortage Of PV Data-Science Talent
- 4.3.3 Algorithmic-Bias Scrutiny Delaying AI Approvals
- 4.3.4 Escalating API Pricing From Dominant DB Vendors
- 4.4 Supply-Chain Analysis
- 4.5 Regulatory Landscape
- 4.6 Technological Outlook
- 4.7 Porter's Five Forces Analysis
- 4.7.1 Threat of New Entrants
- 4.7.2 Bargaining Power of Buyers
- 4.7.3 Bargaining Power of Suppliers
- 4.7.4 Threat of Substitutes
- 4.7.5 Intensity of Rivalry
5 Market Size & Growth Forecasts (Value)
- 5.1 By Functionality
- 5.1.1 Adverse Event Reporting Software
- 5.1.2 Drug Safety Audit Software
- 5.1.3 Issue Tracking Software
- 5.1.4 Fully Integrated Safety Suites
- 5.1.5 Signal Detection & Risk-Management Tools
- 5.2 By Mode of Delivery
- 5.2.1 On-premise
- 5.2.2 Cloud / SaaS
- 5.2.3 Hybrid Deployment
- 5.3 By End User
- 5.3.1 Pharmaceutical & Biotechnology Companies
- 5.3.2 Contract Research Organizations (CROs)
- 5.3.3 Business-Process-Outsourcing (BPO) Firms
- 5.3.4 Medical-Device Manufacturers
- 5.3.5 Other PV Service Providers
- 5.4 Geography
- 5.4.1 North America
- 5.4.1.1 United States
- 5.4.1.2 Canada
- 5.4.1.3 Mexico
- 5.4.2 Europe
- 5.4.2.1 Germany
- 5.4.2.2 United Kingdom
- 5.4.2.3 France
- 5.4.2.4 Italy
- 5.4.2.5 Spain
- 5.4.2.6 Rest of Europe
- 5.4.3 Asia Pacific
- 5.4.3.1 China
- 5.4.3.2 Japan
- 5.4.3.3 India
- 5.4.3.4 South Korea
- 5.4.3.5 Australia
- 5.4.3.6 Rest of Asia Pacific
- 5.4.4 Middle East and Africa
- 5.4.4.1 GCC
- 5.4.4.2 South Africa
- 5.4.4.3 Rest of Middle East and Africa
- 5.4.5 South America
- 5.4.5.1 Brazil
- 5.4.5.2 Argentina
- 5.4.5.3 Rest of South America
- 5.4.1 North America
6 Competitive Landscape
- 6.1 Market Concentration
- 6.2 Market Share Analysis
- 6.3 Company Profiles (includes Global level Overview, Market level overview, Core Segments, Financials as available, Strategic Information, Market Rank/Share for key companies, Products & Services, and Recent Developments)
- 6.3.1 Oracle Corporation
- 6.3.2 ArisGlobal
- 6.3.3 Veeva Systems
- 6.3.4 Sparta Systems
- 6.3.5 IQVIA
- 6.3.6 Ennov Solutions
- 6.3.7 Extedo GmbH
- 6.3.8 AB Cube
- 6.3.9 Anju Software
- 6.3.10 Sarjen Systems
- 6.3.11 United BioSource Corp.
- 6.3.12 Accenture
- 6.3.13 Cognizant
- 6.3.14 Tata Consultancy Services (TCS ADD)
- 6.3.15 Parexel International
- 6.3.16 Medidata Solutions
- 6.3.17 Saama Technologies
- 6.3.18 Intellimed (Vigilance 360)
7 Market Opportunities & Future Outlook
- 7.1 White-Space & Unmet-Need Assessment


