

|
시장보고서
상품코드
2121952
네트워크 연결 스토리지(NAS) 시장 : 시장 점유율 분석, 업계 동향 및 통계, 성장 예측(2026-2031년)Network Attached Storage (NAS) - Market Share Analysis, Industry Trends & Statistics, Growth Forecasts (2026 - 2031) |
||||||
 Mordor Intelligence
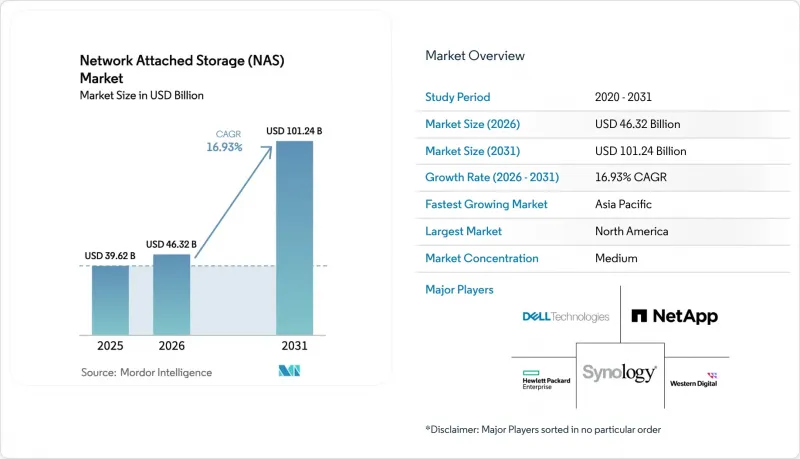
Mordor Intelligence에 의하면, 네트워크 연결 스토리지(NAS) 시장 규모는 2025년에 396억 2,000만 달러로 평가되었고, 2026년 463억 2,000만 달러에서 2031년까지 1,012억 4,000만 달러에 이를 것으로 예측되며, 예측 기간(2026-2031년) CAGR은 16.93%를 나타낼 전망입니다.

본 보고서는 유형별(스케일업, 스케일아웃), 최종 사용자 산업별(은행, 금융서비스 및 보험(BFSI), IT 및 통신, 의료, 소매 및 전자상거래, 미디어 및 엔터테인먼트, 정부·공공 부문 등), 배포 방식별(온프레미스, 클라우드, 하이브리드), 제품 등급별(하이엔드/엔터프라이즈, 미드마켓, 로우엔드/SOHO), 그리고 지역별로 분류되어 있습니다. 시장 예측은 금액(달러) 기준으로 제시되어 있습니다.
세계의 네트워크 연결 스토리지(NAS) 시장 동향 및 인사이트
비정형 데이터의 폭발적인 증가
현재 기업 정보의 최대 80%가 비정형 형식으로 생성되고 있으며, 연간 성장률이 50%에 육박함에 따라 파일 기반 플랫폼의 용량 확대가 시급한 과제가 되고 있습니다. 비디오 감시, IoT 텔레메트리 및 협업 컨텐츠 증가로 인해 기존의 스케일업형 컨트롤러로는 대응하기 어려워졌으며, 구매자들은 서비스 중단 없이 노드를 추가할 수 있는 확장 가능한 클러스터로 전환하고 있습니다. 이와 동시에, 데이터 레이크 프로젝트에서는 파일을 데이터 웨어하우스에 임시로 저장하는 대신 NAS를 이용하여 직접 쿼리를 실행하게 되었기 때문에 백업 중심의 사고방식이 분석 중심의 전략으로 전환되고 있습니다. 증권사를 대상으로 하는 SEC 17a-4와 같은 법적 파일 보관 규정에 따라 온프레미스 스토리지의 수명 주기가 길어지고 있습니다. 이는 클라우드 데이터 전송 비용 및 법적 관할권상의 위험으로 인해 오브젝트 스토리지에 데이터를 저장하는 것이 복잡해지고 있기 때문입니다. 마찬가지로 소매업체들도 POS 로그 및 옴니채널 거래 기록을 중복 제거된 NAS 볼륨에 통합하여 페타바이트 규모의 데이터를 합리적인 용량으로 압축하고 있습니다.
원격 및 하이브리드 근무로 인한 데이터 급증
영구적인 하이브리드 근무 방식의 보급으로 홈 디렉터리 생성률이 2배로 증가했고, 지점의 스토리지 트래픽이 증가함에 따라 사용자당에 파일을 캐시하는 엣지 NAS 어플라이언스에 대한 수요가 높아지고 있습니다. VPN과 통합된 NAS 장치는 야간 동안 코어 데이터센터와 동기화를 수행함으로써 WAN 대역폭 수요를 40% 이상 줄이고 있습니다. 2025년 원격 의료 도입으로 진료 기록이 지속적으로 업로드됨에 따라, 병원에서는 이를 HIPAA 준수 어플라이언스에 저장하여 역할 기반 액세스 제어와 변조 불가능한 로그를 유지하고 있습니다. 대학에서는 클라우드 리전에서 스트리밍 아카이브에 기가바이트당 0.09달러의 아웃바운드 요금이 발생하며, 이는 테라바이트 규모에서는 감당할 수 없는 비용임이 밝혀져 강의 동영상을 로컬 어레이로 이전했습니다.
클라우드 스토리지의 대안
하이퍼스케일러의 오브젝트 스토리지는 콜드 아카이브 측면에서 NAS보다 비용 면에서 유리하여, 일부 팀은 백업 볼륨을 종량제 버킷으로 이전하기 시작했습니다. 그러나 페타바이트당 약 9만 달러에 달하는 아웃바운드 요금이 데이터 검색을 방해하고, 데이터를 클라우드 사일로에 가두어 로컬에서의 근접성이 필요한 분석을 복잡하게 만들고 있습니다. 미디어 스튜디오는 4K 마스터 편집 시 이 문제에 직면했으며, 많은 스튜디오가 핫 컨텐츠를 온사이트에 보관하면서 오래된 자산은 Glacier나 아카이브 클래스로 계층화하는 하이브리드 어플라이언스를 도입하여 대응했습니다.
부문 분석
스케일 아웃형 플랫폼은 네트워크 연결 스토리지(NAS) 시장의 2025년 매출의 53.81%를 차지한 것으로 평가되었으며, 2031년까지 연평균 성장률(CAGR) 17.33%로 성장할 전망입니다. 노드 수준의 확장성을 통해 운영 담당자는 예측할 수 없는 AI 훈련의 급증에 맞추어 용량과 처리량을 조정할 수 있으며, GPU 클러스터를 위해 200 GB/s의 총 대역폭을 실현합니다. 그 결과, 표준 NFS 및 SMB를 통해 애플리케이션 통합이 간소화됨에 따라 스케일아웃형 클러스터가 Hadoop 분산 파일 시스템(HDFS) 도입을 대체하는 사례가 늘어나고 있습니다. 스케일업형 시스템은 페타바이트 규모의 확장보다 관리의 간편성을 중시하는 중견 기업들 사이에서 일정한 입지를 유지하고 있지만, 파일 수가 1억 세션을 초과하면 컨트롤러의 처리 능력 한계가 드러납니다.
스케일업형 어플라이언스는 1만 달러 미만의 가격대에서는 여전히 매력적이며, 소규모 부서를 위한 Synology나 QNAP의 제품이 주류를 이루고 있습니다. 그러나 클라이언트 수가 증가함에 따라 듀얼 컨트롤러 아키텍처에서는 CPU나 RAM의 병목 현상이 발생하여, 하이퍼스케일 AI 환경에서의 실용성이 제한됩니다. 그 결과, 스케일업형 플랫폼용 네트워크 연결 스토리지(NAS) 시장 규모는 전체적인 16.93%라는 성장 속도보다 완만한 확대에 그칠 전망입니다.
의료 분야는 매일 테라바이트 규모의 DICOM 스캔 데이터와 유전체 서열이 수집되는 것을 배경으로, 연평균 성장률(CAGR) 18.47%로 성장을 주도하고 있습니다. 전자건강기록(EHR) 벤더들은 NAS 어레이와 직접 연동되어 있어, HIPAA 및 GDPR(EU 개인정보보호규정)을 준수하는 온프레미스형 파일 스토리지에 대한 수요를 뒷받침하고 있습니다. 2025년 NAS 시장 점유율의 28.61%를 차지한 IT 및 통신 기업은 가상화의 선구자 역할을 했으며, 현재도 최대 지출 주체이지만 시장의 성숙에 따라 그 확대 속도는 둔화되고 있습니다.
BFSI(은행 및 금융 및 보험) 업계의 사업자들은 규제 준수를 위한 통신 로그를 저장하기 위해 변조 방지 기능을 갖춘 NAS 아카이브에 의존하고 있는 반면, 소매 및 전자상거래 사업자들은 옴니채널 트랜스크립트를 효율적으로 저장하기 위해 중복 제거 기술을 활용하고 있습니다. 미디어 스튜디오는 방대한 병렬 워크플로우 수요에 대응하기 위해 올플래시 NAS 도입을 추진하고 있습니다. 반면, 정부, 교육, 제조업 분야에서는 자국 데이터 관리 및 예측 유지보수 등의 요인으로 인해 완만한 성장이 예상됩니다. 의료 워크로드로 인한 네트워크 연결 스토리지(NAS) 시장 규모는 2031년까지 200억 달러를 넘어설 것으로 예측됩니다.
지역별 분석
북미는 2025년 네트워크 연결 스토리지 시장 매출의 39.66%를 차지했습니다. 이는 1,200억 달러를 넘는 하이퍼스케일러의 데이터센터 투자와, 변조 방지 기능을 갖춘 온프레미스 스토리지 사용을 의무화하는 규제에 힘입은 결과입니다. 미국의 연방 기관은 기밀 워크로드를 위해 FedRAMP 인증을 받은 에어 갭형 어플라이언스를 도입하고 있는 반면, 캐나다의 은행들은 국경을 넘는 PIPEDA(개인정보보호법) 위반을 피하기 위해 로컬 어레이에 의존하고 있습니다. 멕시코의 자동차 공장에서는 클라우드 지연 없이 실시간 품질 검사를 수행하는 엣지 NAS 노드가 도입되고 있습니다.
아시아태평양은 중국의 500억 달러 규모 데이터센터 건설과 인도의 ‘디지털 인디아(Digital India)’ 거주 규정의 뒷받침을 받아 연평균 성장률(CAGR) 17.91%로 가장 빠르게 성장하고 있는 지역입니다. 일본의 자율주행차 실증 실험과 한국의 5G 엣지 구축에서는 10밀리초 미만의 로컬 스토리지가 필수적이며, 이로 인해 견고한 어플라이언스에 대한 수요가 촉진되고 있습니다. 인도에서는 HIPAA에 상응하는 의료 규제로 인해 병원이 소버린 NAS 클러스터를 채택하도록 유도되고 있으며, 이로 인해 해당 지역의 네트워크 연결 스토리지(NAS) 시장 점유율이 확대되고 있습니다.
유럽에서는 멀티 리전 클라우드 아키텍처를 복잡하게 만드는 GDPR(EU 개인정보보호규정) 및 DORA 요건에 대응하기 위해 하이브리드 배포가 채택되고 있습니다. 독일의 인더스트리 4.0 공장에서는 예측 분석을 위해 센서의 원격 측정 데이터를 로컬에 저장하고 있는 반면, 영국의 MiFID II 규제로 인해 테이프 교체 주기가 연장되어 아카이브용 NAS에 대한 예산이 유지되고 있습니다. 프랑스에서 HDS 의무화로 인해 환자 데이터는 인증된 온프레미스 인프라 내에 보관되게 되어, 어플라이언스 판매를 더욱 촉진하고 있습니다.
중동 및 아프리카에서는 스마트 시티 메가 프로젝트를 배경으로 두 자릿수 성장이 예상됩니다. 사우디아라비아의 ‘비전 2030’ 자금을 통해 NEOM에 대규모 엣지 NAS 도입이 지원되고 있으며, 수만 대의 카메라에서 전송되는 8K 영상 피드가 캐시되고 있습니다. UAE의 소매업체들은 쇼핑몰 내에 유사한 아키텍처를 구축하고 있으며, 이스라엘에서는 국방 분석을 위해 에어 갭형 클러스터를 도입하고 있습니다. 남아프리카의 금융 업계와 이집트의 지방 정부 IT 부서도 데이터 보호법 준수를 위해 마찬가지로 투자하고 있지만, 전력망의 불안정성이 사하라 이남 지역 전체로의 보급을 방해하고 있습니다.
기타 혜택 :
- 엑셀 형식 시장 예측(ME) 시트
- 3개월간의 애널리스트 지원
자주 묻는 질문
목차
제1장 서론
제2장 조사 방법
제3장 주요 요약
제4장 시장 구도
제5장 시장 규모 및 성장 예측
제6장 경쟁 구도
제7장 시장 기회 및 향후 전망
AJY 26.09.09According to Mordor Intelligence, the network attached storage market size was valued at USD 39.62 billion in 2025 and is estimated to grow from USD 46.32 billion in 2026 to reach USD 101.24 billion by 2031, at a CAGR of 16.93% during the forecast period (2026-2031).
This report is Segmented by Type (Scale-Up, and Scale-Out), End-User Industry (BFSI, IT and Telecom, Healthcare, Retail and E-Commerce, Media and Entertainment, Government and Public Sector, and More), Deployment (On-Premise, Cloud, and Hybrid), Product Tier (High-End/Enterprise, Mid-Market, and Low-End/SOHO), and Geography. The Market Forecasts are Provided in Terms of Value (USD).
Global Network Attached Storage (NAS) Market Trends and Insights
Explosion of Unstructured Data
Up to 80% of enterprise information now arrives in unstructured form, and annual growth rates near 50% drive urgent capacity expansion on file-based platforms. Video surveillance, IoT telemetry, and collaborative content overwhelm legacy scale-up controllers, pushing buyers toward scalable clusters that add nodes without disrupting service. A parallel shift replaces backup-centric thinking with analytics-centric strategies, as data-lake projects rely on NAS to query files directly instead of staging them in data warehouses. Regulatory file-retention rules, such as SEC 17a-4 for broker-dealers, prolong on-premise storage lifecycles because cloud egress costs and jurisdictional risks complicate retention in object stores. Retailers likewise consolidate point-of-sale logs and omnichannel transcripts onto deduplicated NAS volumes that compress petabyte estates into affordable footprints.
Remote and Hybrid-Work Data Surge
Permanent hybrid work doubled home-directory creation rates, magnifying branch-office storage traffic and fueling demand for edge-NAS appliances that cache files close to users. VPN-integrated NAS devices synchronize with core data centers overnight, cutting WAN bandwidth needs by more than 40%. Telehealth rollouts during 2025 generated persistent uploads of consultation recordings that hospitals store on HIPAA-compliant appliances, maintaining role-based access and immutable logs. Universities moved lecture videos onto local arrays after discovering that streaming archives from cloud regions incurred USD 0.09 per gigabyte in egress fees, a cost unsustainable at multi-terabyte scales.
Cloud-Storage Substitution
Hyperscaler object stores undercut NAS for cold archives, prompting some teams to offload backup volumes to pay-as-you-go buckets. However, egress charges near USD 90,000 per petabyte discourage retrieval, locking data in cloud silos and complicating analytics that require local proximity. Media studios confronted this when editing 4K masters, and many responded by adopting hybrid appliances that pin hot content on-site while tiering aged assets to Glacier or Archive classes.
Other drivers and restraints analyzed in the detailed report include:
- Data-Center Virtualization And Software-Defined NAS
- AI/ML Training Workloads Need Parallel File Access
- Performance Bottlenecks at Petabyte Scale
For complete list of drivers and restraints, kindly check the Table Of Contents.
Segment Analysis
Scale-out platforms captured 53.81% of 2025 revenue in the network attached storage market and will grow at a 17.33% CAGR through 2031. Their node-level elasticity lets operators align capacity and throughput with unpredictable AI training surges, enabling 200 GB/s aggregate bandwidth for GPU clusters. In turn, scale-out clusters often replace Hadoop Distributed File System deployments because standard NFS and SMB simplify application integration. Scale-up systems maintain a foothold among midsize firms that prize management simplicity over petabyte ambitions, but controller ceilings appear once file counts push beyond 100 million sessions.
Scale-up appliances remain attractive at price points below USD 10,000, dominated by Synology and QNAP units that address small departments. Yet their dual-controller architectures face CPU and RAM bottlenecks as clients proliferate, limiting viability in hyperscale AI environments. Consequently, the network attached storage market size for scale-up platforms is likely to expand more slowly than the overall 16.93% pace.
Healthcare leads growth at an 18.47% CAGR, driven by daily ingestion of terabytes of DICOM scans and genomic sequences. Electronic-health-record vendors integrate directly with NAS arrays, reinforcing demand for on-premise file stores that satisfy HIPAA and GDPR. IT and telecom firms, which held 28.61% network attached storage market share in 2025, spearheaded early virtualization and remain the largest spender, but maturation tempers their expansion rate.
BFSI players rely on tamper-proof NAS archives for regulatory communication logs, while retail and e-commerce operators use deduplication to store omnichannel transcripts efficiently. Media studios sustain heavy parallel-workflow demands, pushing all-flash NAS adoption, whereas government, education, and manufacturing accelerate modestly on sovereign-data and predictive-maintenance drivers. The network attached storage market size attributable to healthcare workloads is projected to eclipse USD 20 billion by 2031.
Complete Report Scope:
- By Type
- Scale-Up
- Scale-Out
- By End-User Industry
- BFSI
- IT and Telecom
- Healthcare
- Retail and E-Commerce
- Media and Entertainment
- Government and Public Sector
- Education and Manufacturing
- Other End-User Industries
- By Deployment
- On-Premise
- Cloud
- Hybrid
- By Product Tier
- High-End / Enterprise
- Mid-Market
- Low-End / SOHO
- By Geography
- North America
- United States
- Canada
- Mexico
- South America
- Brazil
- Argentina
- Rest of South America
- Europe
- United Kingdom
- Germany
- France
- Italy
- Spain
- Rest of Europe
- Asia-Pacific
- China
- Japan
- India
- South Korea
- Rest of Asia-Pacific
- Middle East and Africa
- Middle East
- Israel
- Saudi Arabia
- United Arab Emirates
- Turkey
- Rest of Middle East
- Africa
- South Africa
- Egypt
- Rest of Africa
- Middle East
- North America
Geography Analysis
North America accounted for 39.66% of network attached storage market revenue in 2025, supported by USD 120 billion-plus hyperscaler data-center spending and regulations that mandate tamper-proof on-premise storage. U.S. federal agencies deploy FedRAMP-authorized, air-gapped appliances for classified workloads, while Canadian banks rely on local arrays to avoid cross-border PIPEDA conflicts. Mexico's automotive factories add edge-NAS nodes that perform real-time quality inspections without cloud latency.
Asia-Pacific is the fastest-growing region at 17.91% CAGR, propelled by China's USD 50 billion data-center build-out and India's Digital India residency rules. Japanese autonomous-vehicle pilots and South Korean 5G edge rollouts depend on sub-10 ms local storage, catalyzing demand for ruggedized appliances. In India, HIPAA-equivalent health regulations steer hospitals toward sovereign NAS clusters, boosting the region's share of the network attached storage market.
Europe embraces hybrid deployments to navigate GDPR and DORA requirements that complicate multi-region cloud architectures. German Industry 4.0 plants store sensor telemetry locally for predictive analytics, while the United Kingdom's MiFID II rules extend tape-replacement cycles and sustain archive NAS budgets. France's HDS mandate keeps patient data inside certified on-premise infrastructure, driving further appliance sales.
Middle East and Africa experience double-digit growth on the back of smart-city mega-projects. Saudi Arabia's Vision 2030 funding underwrites NEOM's massive edge-NAS rollout, caching 8K video feeds at tens of thousands of cameras. UAE retailers replicate similar architectures inside malls, and Israel deploys air-gapped clusters for defense analytics. South African finance and Egyptian municipal IT likewise invest to comply with data-protection statutes, although unreliable power grids impede broader adoption across sub-Saharan regions.
- Dell Technologies Inc.
- NetApp Inc.
- Hewlett Packard Enterprise Co.
- Synology Inc.
- Western Digital Corp.
- Seagate Technology Holdings PLC
- QNAP Systems Inc.
- IBM Corp.
- Hitachi Vantara LLC
- Cisco Systems Inc.
- Huawei Technologies Co. Ltd.
- Lenovo Group Ltd.
- Super Micro Computer Inc.
- Buffalo Inc.
- Zyxel Communications Corp.
- Asustor Inc.
- TerraMaster Technology Co. Ltd.
- Thecus Technology Corp.
- Promise Technology Inc.
- Infortrend Technology Inc.
- Netgear Inc.
- Pure Storage Inc.
- Fujitsu Ltd.
- NEC Corp.
Additional Benefits:
- The market estimate (ME) sheet in Excel format
- 3 months of analyst support
TABLE OF CONTENTS
1 INTRODUCTION
- 1.1 Study Assumptions and Market Definition
- 1.2 Scope of the Study
2 RESEARCH METHODOLOGY
3 EXECUTIVE SUMMARY
4 MARKET LANDSCAPE
- 4.1 Market Overview
- 4.2 Market Drivers
- 4.2.1 Explosion of Unstructured Data
- 4.2.2 Remote and Hybrid-Work Data Surge
- 4.2.3 Data-Center Virtualization and Software-Defined NAS
- 4.2.4 AI/ML Training Workloads Need Parallel File Access
- 4.2.5 5G Edge Build-Out Boosts On-Prem NAS
- 4.2.6 Tariff-Driven Reshoring of NAS Production
- 4.3 Market Restraints
- 4.3.1 Cloud-Storage Substitution
- 4.3.2 Performance Bottlenecks at Petabyte Scale
- 4.3.3 Rising Cyber-Insurance Premiums for On-Prem File Systems
- 4.3.4 Power-Density Caps in Urban Data Centers
- 4.4 Industry Value Chain Analysis
- 4.5 Regulatory Landscape
- 4.6 Technological Outlook
- 4.7 Impact of Macroeconomic Factors on the Market
- 4.8 Porter's Five Forces Analysis
- 4.8.1 Bargaining Power of Suppliers
- 4.8.2 Bargaining Power of Buyers
- 4.8.3 Threat of New Entrants
- 4.8.4 Threat of Substitutes
- 4.8.5 Intensity of Competitive Rivalry
5 MARKET SIZE AND GROWTH FORECASTS (VALUE)
- 5.1 By Type
- 5.1.1 Scale-Up
- 5.1.2 Scale-Out
- 5.2 By End-User Industry
- 5.2.1 BFSI
- 5.2.2 IT and Telecom
- 5.2.3 Healthcare
- 5.2.4 Retail and E-Commerce
- 5.2.5 Media and Entertainment
- 5.2.6 Government and Public Sector
- 5.2.7 Education and Manufacturing
- 5.2.8 Other End-User Industries
- 5.3 By Deployment
- 5.3.1 On-Premise
- 5.3.2 Cloud
- 5.3.3 Hybrid
- 5.4 By Product Tier
- 5.4.1 High-End / Enterprise
- 5.4.2 Mid-Market
- 5.4.3 Low-End / SOHO
- 5.5 By Geography
- 5.5.1 North America
- 5.5.1.1 United States
- 5.5.1.2 Canada
- 5.5.1.3 Mexico
- 5.5.2 South America
- 5.5.2.1 Brazil
- 5.5.2.2 Argentina
- 5.5.2.3 Rest of South America
- 5.5.3 Europe
- 5.5.3.1 United Kingdom
- 5.5.3.2 Germany
- 5.5.3.3 France
- 5.5.3.4 Italy
- 5.5.3.5 Spain
- 5.5.3.6 Rest of Europe
- 5.5.4 Asia-Pacific
- 5.5.4.1 China
- 5.5.4.2 Japan
- 5.5.4.3 India
- 5.5.4.4 South Korea
- 5.5.4.5 Rest of Asia-Pacific
- 5.5.5 Middle East and Africa
- 5.5.5.1 Middle East
- 5.5.5.1.1 Israel
- 5.5.5.1.2 Saudi Arabia
- 5.5.5.1.3 United Arab Emirates
- 5.5.5.1.4 Turkey
- 5.5.5.1.5 Rest of Middle East
- 5.5.5.2 Africa
- 5.5.5.2.1 South Africa
- 5.5.5.2.2 Egypt
- 5.5.5.2.3 Rest of Africa
- 5.5.5.1 Middle East
- 5.5.1 North America
6 COMPETITIVE LANDSCAPE
- 6.1 Market Concentration
- 6.2 Strategic Moves
- 6.3 Market Share Analysis
- 6.4 Company Profiles (includes Global level Overview, Market level overview, Core Segments, Financials as available, Strategic Information, Market Rank/Share for key companies, Products and Services, and Recent Developments)
- 6.4.1 Dell Technologies Inc.
- 6.4.2 NetApp Inc.
- 6.4.3 Hewlett Packard Enterprise Co.
- 6.4.4 Synology Inc.
- 6.4.5 Western Digital Corp.
- 6.4.6 Seagate Technology Holdings PLC
- 6.4.7 QNAP Systems Inc.
- 6.4.8 IBM Corp.
- 6.4.9 Hitachi Vantara LLC
- 6.4.10 Cisco Systems Inc.
- 6.4.11 Huawei Technologies Co. Ltd.
- 6.4.12 Lenovo Group Ltd.
- 6.4.13 Super Micro Computer Inc.
- 6.4.14 Buffalo Inc.
- 6.4.15 Zyxel Communications Corp.
- 6.4.16 Asustor Inc.
- 6.4.17 TerraMaster Technology Co. Ltd.
- 6.4.18 Thecus Technology Corp.
- 6.4.19 Promise Technology Inc.
- 6.4.20 Infortrend Technology Inc.
- 6.4.21 Netgear Inc.
- 6.4.22 Pure Storage Inc.
- 6.4.23 Fujitsu Ltd.
- 6.4.24 NEC Corp.
7 MARKET OPPORTUNITIES AND FUTURE OUTLOOK
- 7.1 White-Space and Unmet-Need Assessment


