|
시장보고서
상품코드
2122219
조력발전 시장 : 시장 점유율 분석, 업계 동향 및 통계, 성장 예측(2026-2031년)Tidal Power - Market Share Analysis, Industry Trends & Statistics, Growth Forecasts (2026 - 2031) |
||||||
 Mordor Intelligence
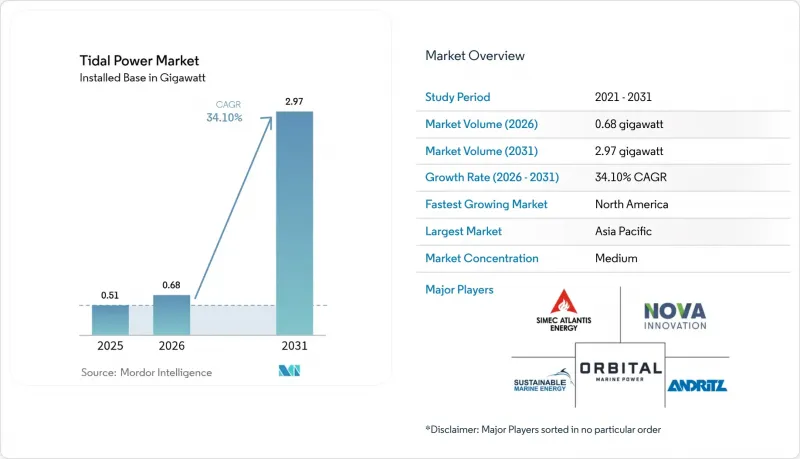
Mordor Intelligence에 의하면, 2026년 조력발전 시장 규모는 0.68기가와트로 추정되고, 2025년 0.51기가와트에서 확대해, 2031년에는 2.97기가와트에 이를 것으로 예측됩니다.
2026-2031년 연평균 성장률(CAGR) 34.10%로 성장할 것으로 전망됩니다.
본 보고서는 발전 방식별(조석 제방, 부유식 조력 발전 플랫폼, 조류 발전, 동적 조력 발전), 조력 에너지 변환 장치별(횡축 터빈 등), 용도별(발전, 해수 담수화, 선박 추진 등), 최종 사용자별(유틸리티·독립발전사업자(IPP), 산업, 상업), 지역별(북미, 유럽, 아시아태평양 등)로 분류되어 있습니다.
세계의 조력 발전 시장 동향 및 인사이트
전 세계 탈탄소화 및 넷제로 목표
정부와 기업들은 간헐적인 풍력 및 태양광을 보완하기 위해, 보다 예측 가능한 청정 에너지원을 모색하고 있습니다. 중국이 저우산 제도에 건설한 플래그십급 발전 시설은 국가의 의지를 보여주는 반면, 미국의 계획 담당자들은 2035년까지 쿡 인렛이 지역 수요의 최대 20%를 충당할 것으로 전망하고 있습니다. G20 데이터에 따르면, 재생에너지 자금 패키지의 약 10%가 현재 해양 에너지 기술에 할당되고 있습니다. 일관되게 높은 설비 가동률은 생산 중단이 허용되지 않는 연안 공장에 있어 조력 발전 시장의 가치 제안을 공고히 하고 있습니다.
조위 차가 큰 지점에서의 예측 가능한 발전
조석 주기는 수 세기 앞까지 예측할 수 있으므로, 사업자는 풍력이나 태양광 발전에 문제가 되는 예측 오차를 피할 수 있습니다. 쿡 인렛의 이론상 80 TWh에 달하는 자원량은 그 규모를 여실히 보여줍니다. 중국의 8기가와트에 달하는 연안 잠재력 또한 유사한 가능성을 내포하고 있습니다. 이러한 높은 정확도 덕분에 예비율 요건이 대폭 줄어들고, 계통 연계 비용이 경감될 뿐만 아니라, 발전과 해수 담수화를 결합한 프로젝트가 촉진됩니다.
다른 재생에너지에 비해 높은 설비 투자액
자본 비용은 1kW당 6,244달러에서 1만 8,700달러 사이인 반면, 전력 회사용 태양광 발전은 1kW당 1,000달러 미만입니다. 이로 인해 뛰어난 설비 가동률에도 불구하고 자금 조달 옵션이 제한되고 있습니다. 중량물 운반선의 수가 제한적이어서 동원 비용이 급등하고 있으며, 또한 복합재 블레이드 제조는 여전히 맞춤형 설비에 의존하고 있어 리드타임이 길어지고 있습니다. 현재 균등화 발전 비용은 0.12-0.40달러/kWh로, 현행 시장 가격을 크게 상회하고 있습니다. 그러나 학습 곡선 예측에 따르면, 유럽 집행위원회가 권장하는 모듈식 설계 및 표준화된 설치 절차를 통해 비용이 29% 감소할 가능성이 있습니다.
부문별 분석
2025년에는 라 랑스(La Lance)나 한국의 254 MW 시파 호수 등 실적이 입증된 댐 덕분에 조력 발전소가 발전 용량의 44.12%를 차지했으며, 이를 합치면 연간 550 GWh를 발전하고 있습니다. 수심 제한을 받지 않는 부유식 플랫폼은 2031년까지 연평균 성장률(CAGR) 35.30%로 성장할 전망입니다. 스코틀랜드의 메이젠(MeyGen) 어레이와 같은 조류 발전 장치는 매년 새로운 발전 용량을 추가하고 있지만, 동적 조류 발전 개념은 여전히 연구 개발 단계에 있습니다. 두 기술의 융합은 가능할 것입니다. 수문 기술을 갖춘 모듈식 플로트는 둑식 발전의 효율성과 심해에서의 유연성을 결합하여, 하구가 없는 해안선에서도 조력 발전 시장 규모를 확대할 가능성이 있습니다.
이와 병행하여 플랫폼 OEM 각사는 해상 작업 시간을 40% 단축하기 위해 바지선 상에서의 사전 조립으로 전환하고 있습니다. 이러한 노력을 통해 가장 큰 비용 항목 중 하나인 선박 임대 비용을 절감할 수 있어, 자본 비용이 감소하는 상황에서도 조력 발전 시장의 경쟁력을 유지할 수 있을 것으로 전망됩니다.
2025년에는 수평축 터빈이 설치 대수의 62.05%를 차지했습니다. 이는 주로 풍력 발전 분야에서 기어박스, 베어링, SCADA 로직을 전용하고 있기 때문입니다. 최근의 개량을 통해 로터 직경은 20m를 넘어서는 추세이며, 나셀의 무게도 경감되고 있습니다. 수직축형 유닛은 양방향 수로에 대응하며, 요(yaw) 제어의 복잡성을 최소화하고 있습니다. 또한, 수중 카이트는 유속이 느린 해역의 조류를 이용하여 낙차가 낮은 입지에서도 발전이 가능하게 합니다. 양산이 확대됨에 따라 케이블, 커넥터, 제어 소프트웨어와 같은 부품 간의 표준화가 진행되어 조달 리드타임이 단축될 전망입니다. 이를 통해 비용을 증가시키지 않으면서도 조류 발전 시장은 컨버터의 라인업을 확충할 수 있게 될 것입니다.
지역별 분석
2025년에는 아시아태평양이 총 발전 용량의 50.35%를 차지한 것으로 평가되었으며, 중국의 산업 주도와 한국에 위치한 동남아시아 최초의 계통 연계 발전소가 이를 견인하는 역할을 했습니다. 일본과 인도네시아의 프로그램은 향후 실증 설비의 규모 확대에 주력하는 한편, 호주는 Minesto사와 제휴하여 고립된 광산 기지에 전력 공급을 추진하고 있습니다.
북미는 연평균 성장률(CAGR) 49.80%를 기록하며 성장의 견인차 역할을 할 전망입니다. 알래스카주 쿡 인렛의 자원은 연간 80 TWh를 공급할 수 있으며, 해상 풍력 발전과의 세액 공제 균형이 프로젝트 자금 제공업체들을 이 지역으로 다시 불러모으고 있습니다. 노바스코샤주의 개정 임대차법에 따라 펀디 만에서의 인허가 절차가 신속화되었으며, 서부 해안 전력망에서는 향후 태평양 연안 건설을 위한 해저 케이블 검토가 진행되고 있습니다.
유럽은 계속해서 정책 동향을 주도하는 존재로서의 위상을 유지하고 있습니다. 영국의 최신 CfD(차액결제계약) 입찰에서는 조력 발전용 예산이 확보되었으며, 240 MW 규모의 몰레 지역에서는 2025년에 초기 공사가 시작되었습니다. 프랑스에 위치한 건설 후 수십 년이 지난 라 랑스 댐은 여전히 40% 이상의 설비 가동률을 유지하고 있으며, O&M(운영 및 유지보수) 모범 사례 데이터의 기반이 되고 있습니다. 북유럽의 조선소에서는 현재 앵커 핸들링 예인선을 설치용 선박으로 개조하고 있어, 조력 발전 시장 동향에 현지 일자리 창출 요소가 더해지고 있습니다.
기타 혜택 :
- 엑셀 형식 시장 예측(ME) 시트
- 3개월간의 애널리스트 지원
자주 묻는 질문
목차
제1장 서론
제2장 조사 방법
제3장 주요 요약
제4장 시장 구도
제5장 시장 규모 및 성장 예측
제6장 경쟁 구도
제7장 시장 기회 및 향후 전망
AJY 26.09.07According to Mordor Intelligence, tidal power market size in 2026 is estimated at 0.68 gigawatt, growing from 2025 value of 0.51 gigawatt with 2031 projections showing 2.97 gigawatt, growing at 34.10% CAGR over 2026-2031.
This report is Segmented by Power Generation Method (Tidal Barrage, Floating Tidal Power Platform, Tidal Stream Generation, and Dynamic Tidal Power), Tidal Energy Converters (Horizontal Axis Turbine, and More), Application (Power Generation, Desalination, Marine Propulsion, and More), End-User (Utilities and IPPs, Industrial, and Commercial), and Geography (North America, Europe, Asia Pacific, and More).
Global Tidal Power Market Trends and Insights
Global Decarbonization and Net-Zero Targets
Governments and corporations are chasing more predictable clean-power sources to backfill intermittent wind and solar. China's flagship array in the Zhoushan archipelago signals national intent, while U.S. planners see Cook Inlet covering up to 20% of regional demand by 2035. G-20 data show roughly 10% of renewable-finance packages are now directed to ocean-energy technology. Consistently high capacity factors strengthen the tidal power market value proposition for coastal factories that cannot afford production lapses.
Predictable Generation from High-Tidal-Range Sites
Because tidal cycles can be forecast centuries ahead, operators avoid the forecasting errors that plague wind and solar. Cook Inlet's theoretical 80 TWh resource illustrates the scale; China's eight-gigawatt coastal potential offers similar promise. Such precision slashes reserve-margin requirements, easing grid integration costs and supporting power-plus-desalination projects.
High CAPEX versus Other Renewables
Capital requirements range between USD 6,244/kW and USD 18,700/kW, compared to sub-USD 1,000/kW for utility solar, which restricts financing options despite superior capacity factors. Limited fleets of heavy-lift vessels inflate mobilization expenses, while composite-blade fabrication still depends on bespoke facilities, elongating lead times. Current levelized energy costs sit at USD 0.12-0.40/kWh-well above prevailing market rates. Nonetheless, learning-curve projections show potential cost declines of 29% through modular designs and standardized installation sequences endorsed by the European Commission.
Other drivers and restraints analyzed in the detailed report include:
- Government Subsidies and Feed-in Tariffs
- Advancements in Turbine and Floating-Platform Technology
- Marine-Ecosystem Impact Concerns
For complete list of drivers and restraints, kindly check the Table Of Contents.
Segment Analysis
Tidal-barrage plants held 44.12% of capacity in 2025 thanks to proven dams like La Rance and South Korea's 254 MW Sihwa Lake, which together produce 550 GWh a year. Floating platforms, free of depth limits, are on track for a 35.30% CAGR to 2031. Stream devices such as Scotland's MeyGen array add new megawatts yearly, while dynamic-tidal concepts remain in R&D. Convergence is likely: modular floats equipped with sluice-gate technology could merge barrage efficiency with deep-water flexibility, enriching the tidal power market size even where shorelines lack estuaries.
In parallel, platform OEMs are switching to barge-mounted pre-assembly to cut offshore time by 40%. Such tweaks trim vessel rental costs-one of the steepest expense lines-and should keep the tidal power market competitive as capital costs slide.
Horizontal-axis turbines controlled 62.05% of installations in 2025, largely because they borrow gearboxes, bearings, and SCADA logic from the wind sector. Upgrades now push rotor diameters past 20 m while shaving nacelle weight. Vertical-axis units serve bi-directional channels, minimizing yaw complexity, and underwater kites harvest slower currents to unlock low-head sites. As serial production ramps up, cross-item standardization-cables, connectors, control software-should shrink procurement lead times, helping the tidal power market broaden its converter mix without escalating costs.
Complete Report Scope:
- By Power Generation Method
- Tidal Barrage
- Floating Tidal Power Platform
- Tidal Stream Generation
- Dynamic Tidal Power
- By Tidal Energy Converters
- Horizontal Axis Turbine
- Vertical Axis Turbine
- Other Tidal Energy Converters
- By Application
- Power Generation
- Desalination
- Marine Propulsion
- Data and Telecom Platforms
- By End-User
- Utilities and IPPs
- Industrial
- Commercial
- By Geography
- North America
- United States
- Canada
- Mexico
- Europe
- United Kingdom
- France
- Spain
- Netherlands
- Denmark
- Russia
- Rest of Europe
- Asia Pacific
- China
- India
- Japan
- South Korea
- ASEAN Countries
- Australia and New Zealand
- Rest of Asia Pacific
- South America
- Brazil
- Argentina
- Colombia
- Rest of South America
- Middle East and Africa
- Saudi Arabia
- United Arab Emirates
- South Africa
- Egypt
- Rest of Middle East and Africa
- North America
Geography Analysis
Asia-Pacific held 50.35% of capacity in 2025, led by China's industrial drive and Southeast Asia's first grid-connected plant in South Korea. Japanese and Indonesian programs next focus on upscaling pilot devices, while Australia partners with Minesto to electrify isolated mining hubs.
North America is projected to be the growth champion at 49.80% CAGR. Alaska's Cook Inlet resource could feed 80 TWh a year, and tax-credit parity with offshore wind is drawing project financiers back to the region. Nova Scotia's revised leasing act speeds permitting in the Bay of Fundy, and West Coast grids study subsea cables for future Pacific builds.
Europe remains the policy trend-setter. The U.K.'s latest CfD round reserved a tidal budget, and the 240 MW Morlais zone entered early works in 2025. France's decades-old La Rance barrage still runs at more than 40% capacity factor, anchoring O&M best-practice data. Nordic yards now retrofit anchor-handling tugs into installation craft, adding local content jobs to the tidal power market narrative.
- Andritz AG
- Nova Innovation Ltd
- Orbital Marine Power Ltd
- MAKO Turbines Pty Ltd
- SIMEC Atlantis Energy Ltd
- HydroQuest SAS
- Sustainable Marine Energy Ltd
- Lockheed Martin Corporation
- Verdant Power Inc
- Minesto AB
- Voith Hydro GmbH & Co KG
- Sabella SA
- Carnegie Clean Energy Ltd
- Blue Energy Canada Inc
- Instream Energy Systems Corp
- Kepler Energy Ltd
- Water Wall Turbine Inc
- Seaflow Marine Ltd
- Ocean Renewable Power Company (ORPC)
- GCK Energy SAS
Additional Benefits:
- The market estimate (ME) sheet in Excel format
- 3 months of analyst support
TABLE OF CONTENTS
1 Introduction
- 1.1 Study Assumptions & Market Definition
- 1.2 Scope of the Study
2 Research Methodology
3 Executive Summary
4 Market Landscape
- 4.1 Market Overview
- 4.2 Market Drivers
- 4.2.1 Global decarbonization & net-zero targets
- 4.2.2 Predictable generation from high-tidal-range sites
- 4.2.3 Government subsidies & feed-in tariffs
- 4.2.4 Advancements in turbine & floating-platform tech
- 4.2.5 Co-location with coastal hydrogen hubs
- 4.2.6 Coastal-protection & climate-resilience applications
- 4.3 Market Restraints
- 4.3.1 High CAPEX versus other renewables
- 4.3.2 Marine-ecosystem impact concerns
- 4.3.3 Supply-chain bottlenecks for composite blades
- 4.3.4 Limited grid capacity in remote coastlines
- 4.4 Supply-Chain Analysis
- 4.5 Regulatory Landscape
- 4.6 Technological Outlook
- 4.7 Existing and Key Upcoming Projects
- 4.8 Porter's Five Forces
- 4.8.1 Bargaining Power of Suppliers
- 4.8.2 Bargaining Power of Buyers
- 4.8.3 Threat of New Entrants
- 4.8.4 Threat of Substitute Products
- 4.8.5 Intensity of Competitive Rivalry
5 Market Size & Growth Forecasts
- 5.1 By Power Generation Method
- 5.1.1 Tidal Barrage
- 5.1.2 Floating Tidal Power Platform
- 5.1.3 Tidal Stream Generation
- 5.1.4 Dynamic Tidal Power
- 5.2 By Tidal Energy Converters
- 5.2.1 Horizontal Axis Turbine
- 5.2.2 Vertical Axis Turbine
- 5.2.3 Other Tidal Energy Converters
- 5.3 By Application
- 5.3.1 Power Generation
- 5.3.2 Desalination
- 5.3.3 Marine Propulsion
- 5.3.4 Data and Telecom Platforms
- 5.4 By End-User
- 5.4.1 Utilities and IPPs
- 5.4.2 Industrial
- 5.4.3 Commercial
- 5.5 By Geography
- 5.5.1 North America
- 5.5.1.1 United States
- 5.5.1.2 Canada
- 5.5.1.3 Mexico
- 5.5.2 Europe
- 5.5.2.1 United Kingdom
- 5.5.2.2 France
- 5.5.2.3 Spain
- 5.5.2.4 Netherlands
- 5.5.2.5 Denmark
- 5.5.2.6 Russia
- 5.5.2.7 Rest of Europe
- 5.5.3 Asia Pacific
- 5.5.3.1 China
- 5.5.3.2 India
- 5.5.3.3 Japan
- 5.5.3.4 South Korea
- 5.5.3.5 ASEAN Countries
- 5.5.3.6 Australia and New Zealand
- 5.5.3.7 Rest of Asia Pacific
- 5.5.4 South America
- 5.5.4.1 Brazil
- 5.5.4.2 Argentina
- 5.5.4.3 Colombia
- 5.5.4.4 Rest of South America
- 5.5.5 Middle East and Africa
- 5.5.5.1 Saudi Arabia
- 5.5.5.2 United Arab Emirates
- 5.5.5.3 South Africa
- 5.5.5.4 Egypt
- 5.5.5.5 Rest of Middle East and Africa
- 5.5.1 North America
6 Competitive Landscape
- 6.1 Market Concentration
- 6.2 Strategic Moves (M&A, Partnerships, PPAs)
- 6.3 Market Share Analysis (Market Rank/Share for key companies)
- 6.4 Company Profiles (includes Global level Overview, Market level overview, Core Segments, Financials as available, Strategic Information, Products & Services, and Recent Developments)
- 6.4.1 Andritz AG
- 6.4.2 Nova Innovation Ltd
- 6.4.3 Orbital Marine Power Ltd
- 6.4.4 MAKO Turbines Pty Ltd
- 6.4.5 SIMEC Atlantis Energy Ltd
- 6.4.6 HydroQuest SAS
- 6.4.7 Sustainable Marine Energy Ltd
- 6.4.8 Lockheed Martin Corporation
- 6.4.9 Verdant Power Inc
- 6.4.10 Minesto AB
- 6.4.11 Voith Hydro GmbH & Co KG
- 6.4.12 Sabella SA
- 6.4.13 Carnegie Clean Energy Ltd
- 6.4.14 Blue Energy Canada Inc
- 6.4.15 Instream Energy Systems Corp
- 6.4.16 Kepler Energy Ltd
- 6.4.17 Water Wall Turbine Inc
- 6.4.18 Seaflow Marine Ltd
- 6.4.19 Ocean Renewable Power Company (ORPC)
- 6.4.20 GCK Energy SAS
7 Market Opportunities & Future Outlook
- 7.1 White-space & Unmet-Need Assessment
- 7.2 Emerging Blue-Economy Synergies
- 7.3 Coastal-Infrastructure Integration Projects