

|
시장보고서
상품코드
2122274
해저 광케이블 : 시장 점유율 분석, 업계 동향과 통계, 성장 예측(2026-2031년)Submarine Optical Fiber Cable - Market Share Analysis, Industry Trends & Statistics, Growth Forecasts (2026 - 2031) |
||||||
 Mordor Intelligence
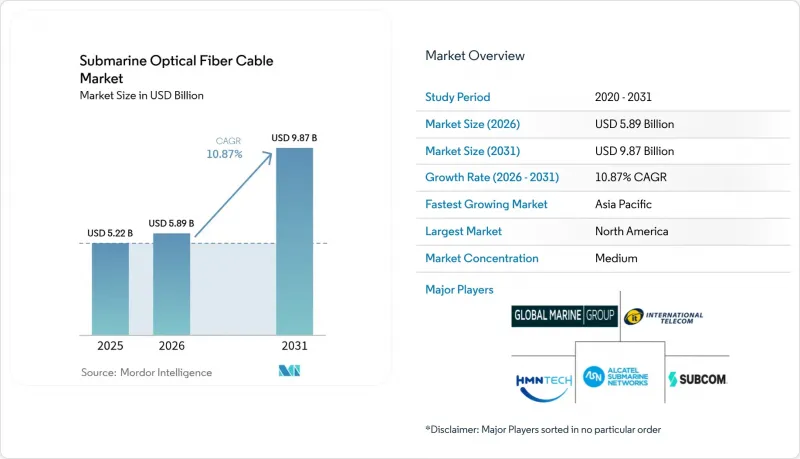
Mordor Intelligence에 의하면, 해저 광케이블 시장 규모는 2025년에 52억 2,000만 달러, 2026년에 58억 9,000만 달러에 이르고, 2031년까지 98억 7,000만 달러에 이를 것으로 예측되며, 2026-2031년 CAGR 10.87%를 기록할 전망입니다.
본 보고서는 구성 요소별(습식 플랜트 설비, 건식 플랜트 설비, 기타), 케이블 유형별(단일 모드 광섬유, 다중 모드 광섬유, 기타), 클라이언트 유형별(통신 사업자, 컨텐츠·하이퍼스케일 클라우드 제공업체, 기타),용량 설계별(16Tbps 이하 시스템, 16-60Tbps 시스템, 기타), 지역별로 분류되어 있습니다. 시장 예측은 금액(달러) 기준으로 제시되어 있습니다.
전 세계 해저 광케이블 시장 동향 및 인사이트
하이퍼스케일 클라우드 및 OTT의 전용 케이블 투자
현재, 신규 대양 횡단 시스템의 대부분은 컨텐츠 플랫폼에 의해 발주되고 있습니다. 메타(Meta)의 ‘2Africa’와 ‘Waterworth’ 프로그램은 총 90,000km가 넘는 노선 길이를 보유하고 있으며, 종단 간 소유권을 확보하고 있어 대역폭 임대 협상이 필요하지 않습니다. 구글은 AI 모델 훈련을 위한 저지연 복제를 확보하기 위해 2025년에 싱가포르와 몰디브를 연결하는 ‘Dhivaru’ 링크를 가동했습니다. 아마존은 2027년 가동을 예정하고 있는 100Tbit/s 대서양 횡단 노선에 대해 아일랜드에서의 상륙권을 확보했습니다. 이러한 움직임으로 인해 수십억 달러 규모의 자금이 광섬유 제조업체로 직접 유입되면서, 공급업체 간의 힘의 균형이 재편되고 있습니다. 이에 대응하여 통신 그룹들은 종단 간 소유자가 아닌 도매 공급자라는 입장으로 재포지셔닝하고 있습니다.
통신 사업자의 400GbE·800GbE로의 급속한 업그레이드 사이클
코히런트 플러그인형 광 모듈을 통해 통신 사업자는 기존 케이블에서 파장당 처리량을 4배로 늘릴 수 있게 됩니다. 오만텔(Omantel)은 2025년, Ciena의 WaveLogic 6을 사용하여 각 채널을 800Gbps로 끌어올리고, 2억 달러 규모의 케이블 교체 프로젝트를 최소 5년간 연기함으로써 그 경제성을 입증했습니다. Altibox는 이미 1.6Tbit/s 단일 파장 테스트를 검증했으며, 2028년 이전에 상용화될 것으로 예측됩니다. 2025년 입찰 프로젝트의 60%에서 ITU-T G.654.E 저감쇠 광섬유가 채택됨에 따라 전송 거리가 더욱 연장되고, 증폭기 대수와 작동 전력 예산이 절감됩니다.
높은 유지보수 및 수리 선박 비용
심해에서의 수리 비용은 보통 100만-300만 달러 범위입니다. 이 비용은 하루당 10만-30만 달러 범위에서 변동하는 선박 용선료와, 수 주간에 걸친 기상 조건 호전 기간의 예측 불가능성에 영향을 받습니다. 전 세계에서 이용 가능한 전용 수리선은 불과 60척에 불과하며, 특히 여러 선박이 동시에 고장을 겪을 경우 업계는 심각한 병목 현상에 직면하게 됩니다. 2025년, 보험사들은 이러한 과제에 대응하여 고위험으로 간주되는 항로의 보험료를 최대 30% 인상했습니다. 이러한 비용 상승과 잠재적인 가동 중단 시간을 고려하여, 각 운영사는 대기 계약을 사전에 예약하기 시작했습니다. 이 전략으로 인해 프로젝트 예산은 5-8% 증가하지만, 장기적인 가동 중단 위험을 크게 줄일 수 있습니다.
부문 분석
2025년 해저 광케이블 시장에서 웨트 플랜트 장비 시장 규모는 26억 7,000만 달러에 달하여 총 매출의 51.32%를 차지했습니다. 이는 리피터와 분기 장치가 여전히 가장 큰 비용 요인이기 때문입니다. 그러나 분쟁이 발생하기 쉬운 항로의 통신 사업자들이 24시간 수리 서비스와 해저 경로 감사를 구매하고 있기 때문에 보조 서비스와 해양 서비스는 연평균 11.69%의 속도로 성장하고 있습니다. 이러한 서비스 중심의 전환으로 인해 지속적인 수익이 증가하여 턴키 방식의 하드웨어 계약에 따른 수익 변동으로부터 공급업체를 보호하고 있습니다.
육상 설비, 즉 광회선 단말기나 모니터링 플랫폼은 하이퍼스케일러 각사가 ? 플랜트 벤더로부터 전송용 전자기기를 분리하는 개방형 아키텍처를 요구하고 있기 때문에 상품화 압력에 직면해 있습니다. 내셔널 그리드(National Grid)의 2024년 도입을 통해 해상 풍력 발전 프로젝트에서 터빈 가동 중단 시간을 15% 줄일 수 있음이 입증됨에 따라, 광섬유 자체를 진동 센서로 재사용하는 분산형 음향 감지 장치(DAS) 등 보다 소규모의 틈새 시장이 등장하고 있습니다. 부품 전반에 걸쳐, 각 공급업체들은 2030년까지 5억 달러 규모로 성장할 것으로 예상되는 인접 시장을 개척하기 위해 하이브리드 전력 데이터 케이블로 사업을 다각화하고 있습니다.
2025년 매출액 중 싱글 모드 설계가 66.32%를 차지했으나, NEC의 22코어 실증 실험에서 단일 광섬유 쌍으로 680Tbit/s를 달성함에 따라 멀티코어 및 SDM 광섬유가 11.43%라는 가장 높은 성장률을 기록했습니다. 초기 도입은 여전히 데이터센터 구내로 한정되어 있지만, 2027년까지 1접합당 1만 달러 미만으로 연결 비용이 하락할 것으로 예상되며, 이에 따라 장거리 도입이 본격화될 것으로 보입니다. ITU-T G.654.E의 저감쇠 사양은 대부분의 새로운 입찰 문서의 기반이 되고 있으며, 기존 G.652.D와 비교하여 증폭기 간격을 400km로 확대하고 리피터 수를 40% 줄일 수 있게 해줍니다.
10km 이하의 단거리 해양 플랫폼 간 연결에서는 여전히 멀티모드 광섬유가 사용되고 있지만, 싱글모드 가격 하락에 따라 그 점유율은 계속 줄어들고 있습니다. 각 공급업체들은 저지연 전송을 약속하는 중공 코어형 광섬유의 연구 개발에 주력하고 있으며, 제조 수율이 안정화되면 향후 10년 내에 SDM을 보완하는 역할을 할 가능성이 있습니다.
지역별 분석
2025년, 아시아태평양은 해저 광케이블 시장을 주도하며 매출의 33.21%를 차지했습니다. 이는 SEA-ME-WE-6의 뭄바이 상륙과, 도쿄 기업들을 위한 재해 복구용 링크를 확보하기 위한 일본의 3억 달러 규모 JUNO 루트가 원동력이 되었습니다. 중국 제조업체들은 여전히 활발히 활동하고 있지만, 호주와 미국에서는 정치적 역풍에 직면해 있으며, 국가 안보 심사 요건을 준수하기 위해 싱가포르와 홍콩을 경유하여 트래픽을 우회하고 있습니다.
아프리카는 2031년까지 연평균 성장률(CAGR) 11.83%를 기록하며 가장 빠른 성장세를 보이고 있습니다. 메타(Meta)의 ‘2Africa’ 시스템은 현재 33곳의 상륙 지점에 걸쳐 180Tbit/s의 용량을 자랑하며 아프리카 대륙 전역을 아우르고 있으며, 나이지리아,케냐, 남아프리카공화국에서는 도매 Mbps 단가를 두 자릿수 비율로 인하하고 있습니다. 요금 인하로 인해 위성 통신의 테라비트 제한 하에서는 불가능했던 현지 데이터센터 건설 및 클라우드 온램프 도입이 촉진되고 있습니다.
북미에서는 2000년대 초에 설치된 케이블이 수명을 다함에 따라 800GbE 파장으로 업그레이드되면서 꾸준한 교체 수요가 나타나고 있습니다. 유럽에서는 브렉시트로 인해 영국-프랑스 해협 횡단 착륙 지점의 라이선스 제도가 분단되면서, 인허가 취득까지의 기간이 장기화되었습니다. 또한, EU의 엄격한 환경 심사로 인해 지중해 노선에서는 12-18개월의 추가 기간이 필요하게 되었습니다. 남미에서는 Seabras-2 등 브라질-포르투갈 간 링크를 통해 마이애미라는 병목 현상에 대한 의존도를 낮추고, 단일 장애 지점 위험을 경감하는 대체 회랑을 구축하고 있습니다. 중동의 트래픽은 여전히 중계에 대한 의존도가 높으며, 통신 사업자들은 현재 장애에 대비해 홍해 보호 루프를 구축하고 있고, 보험사들은 수에즈 운하 통과 경로에 대해 더 높은 보험료를 부과하고 있습니다. 신규 극지 횡단 경로는 2026년 하반기 Far North Fiber의 14,000km 회선이 가동되면 아시아와 유럽 간의 지연 시간을 30% 단축할 수 있을 것으로 기대됩니다.
기타 혜택
- 엑셀 형식 시장 예측(ME) 시트
- 3개월간의 애널리스트 지원
자주 묻는 질문
목차
제1장 서론
제2장 조사 방법
제3장 주요 요약
제4장 시장 구도
제5장 시장 규모와 성장 예측
제6장 경쟁 구도
제7장 시장 기회와 향후 전망
LSH 26.09.04According to Mordor Intelligence, the submarine optical fiber cable market size is projected to be USD 5.22 billion in 2025, USD 5.89 billion in 2026, and reach USD 9.87 billion by 2031, growing at a CAGR of 10.87% from 2026 to 2031.
This report is Segmented by Component (Wet-Plant Equipment, Dry-Plant Equipment, and More), Cable Type (Single-Mode Fiber, Multimode Fiber, and More), Client Type (Telecom Operators, Content and Hyperscale Cloud Providers, and More), Capacity Design (less Than or Equal To 16 Tbps Systems, 16-60 Tbps Systems, and More), and Geography. The Market Forecasts are Provided in Terms of Value (USD).
Global Submarine Optical Fiber Cable Market Trends and Insights
Hyperscale Cloud and OTT Investment in Private Cables
Content platforms now commission the majority of new trans-oceanic systems. Meta's 2Africa and Waterworth programs together exceed 90,000 km of route length and secure end-to-end ownership, eliminating bandwidth-lease negotiations. Google activated the Dhivaru link between Singapore and the Maldives in 2025 to ensure low-latency replication for AI model training. Amazon obtained landing rights in Ireland for a 100 Tbit-s trans-Atlantic route scheduled for 2027. These moves channel multi-billion-dollar capital flows directly to fiber manufacturers, reshaping supplier power dynamics. Telecom groups respond by repositioning as wholesale landlords rather than end-to-end owners.
Rapid 400 GbE and 800 GbE Upgrade Cycle Among Carriers
Coherent pluggable optics let operators quadruple wavelength throughput on legacy cables. Omantel proved the economics in 2025 by lifting each channel to 800 Gbps with Ciena's WaveLogic 6 and deferring a USD 200 million rip-and-replace project by at least five years. Altibox has already validated 1.6 Tbit-s single-wavelength trials, hinting at commercial adoption before 2028. Adoption of ITU-T G.654.E low-attenuation fiber in 60% of 2025 tenders further extends span lengths, lowering amplifier counts and operating power budgets.
High Maintenance and Repair-Ship Costs
Deep-water repairs typically range from USD 1 million to 3 million. This cost is influenced by daily vessel charter rates, which hover between USD 0.1 million and 0.3 million, and the unpredictable nature of multi-week weather windows. With only 60 dedicated repair ships available globally, the industry faces significant bottlenecks, especially when multiple vessels encounter faults simultaneously. In 2025, insurers responded to these challenges by increasing premiums by as much as 30% for corridors deemed high-risk. In light of these rising costs and potential downtimes, operators have begun pre-booking standby contracts. While this strategy adds an extra 5-8% to their project budgets, it significantly mitigates the risk of extended downtimes.
Other drivers and restraints analyzed in the detailed report include:
- Growing Smartphone Penetration and Rising Internet Bandwidth Demand
- Increasing Fiber Connectivity in Emerging Regions
- Growing Investment in LEO Satellite Constellations
For complete list of drivers and restraints, kindly check the Table Of Contents.
Segment Analysis
The submarine optical fiber cable market size for wet-plant equipment stood at USD 2.67 billion in 2025, equal to 51.32% of overall revenue, as repeaters and branching units remain the single largest cost block. Yet auxiliary and marine services are growing at 11.69% annually because operators in conflict-prone corridors purchase round-the-clock repair coverage and seabed route audits. That service-centric shift increases recurring revenue and cushions suppliers against the lumpiness of turnkey hardware contracts.
Dry-plant equipment, namely optical line terminals and monitoring platforms, faces commoditization as hyperscalers demand open architectures that disaggregate transport electronics from wet-plant vendors. Smaller niches, including distributed acoustic sensing units that repurpose the fiber itself as a vibration sensor, have emerged after National Grid's 2024 deployment proved 15% turbine-downtime savings for offshore wind projects. Across components, suppliers diversify into hybrid power-data cables to tap an adjacent USD 500 million addressable pool by 2030.
Single-mode designs held 66.32% of 2025 revenue, but multi-core and SDM fiber posted the highest growth at 11.43% as NEC's 22-core demonstration reached 680 Tbit-s on a single fiber pair. Early deployments remain inside data-center campuses, yet splicing-cost declines to below USD 10,000 per joint, anticipated by 2027, will unlock long-haul adoption. The ITU-T G.654.E low-attenuation specification underpins most new tender documents, enabling amplifier spacing of 400 km and trimming repeater counts by 40% versus legacy G.652.D.
Multimode fiber persists for short offshore-platform hops under 10 km but continues to cede share as single-mode prices fall. Suppliers funnel R&D toward hollow-core variants that promise sub-latency propagation and could complement SDM in the next decade if manufacturing yields stabilize.
Complete Report Scope:
- By Component
- Wet-Plant Equipment
- Dry-Plant Equipment
- Auxiliary and Marine Services
- Other Components
- By Cable Type
- Single-mode Fiber
- Multimode Fiber
- SDM / Multi-core Fiber
- By Client Type
- Telecom Operators
- Content and Hyperscale Cloud Providers
- Government and Research Networks
- Offshore Energy Operators
- Other Clinet Types
- By Capacity Design
- less than or equal to 16 Tbps Systems
- 16 - 60 Tbps Systems
- above 60 Tbps Systems
- By Geography
- North America
- United States
- Canada
- South America
- Brazil
- Argentina
- Rest of South America
- Europe
- Germany
- France
- United Kingdom
- Rest of Europe
- Asia-Pacific
- China
- India
- Japan
- Australia
- Rest of Asia-Pacific
- Middle East
- Saudi Arabia
- United Arab Emirates
- Turkey
- Rest of Middle East
- Africa
- South Africa
- Egypt
- Nigeria
- Rest of Africa
- North America
Geography Analysis
Asia-Pacific led the submarine optical fiber cable market with 33.21% revenue in 2025, driven by the SEA-ME-WE-6's Mumbai landing and Japan's USD 300 million JUNO route, which secures disaster-recovery links for Tokyo enterprises. China's manufacturers remain active but face political headwinds in Australia and the United States, rerouting traffic through Singapore and Hong Kong to comply with national-security screening requirements.
Africa delivers the fastest growth at 11.83% CAGR through 2031. Meta's 2Africa system now spans the continent with 180 Tbit-s of capacity across 33 landings, slashing wholesale Mbps prices by double digits in Nigeria, Kenya, and South Africa. Lower tariffs stimulate local data-center builds and cloud on-ramp deployments that were impossible under satellite-backed terabit ceilings.
North America sees steady replacement demand as early-2000s cables reach end of life and are upgraded to 800 GbE wavelengths. Europe's permitting cycle grew longer after Brexit split licensing regimes for cross-Channel landings, while strict EU environmental reviews add 12-18 months to Mediterranean routes. South America diversifies away from its Miami choke point via Brazil-Portugal links such as Seabras-2, creating alternate corridors that lower single-point-failure risk. Middle Eastern traffic remains transit-heavy; operators now deploy Red Sea protection loops to hedge against disruption, and insurers levy higher premiums on Suez passages. Emerging trans-polar routes promise 30% latency cuts between Asia and Europe once Far North Fiber's 14,000 km link activates in late 2026..
- Alcatel Submarine Networks Ltd.
- HMN Technologies Co., Ltd.
- Nexans S.A.
- SubCom, LLC
- Fujitsu Ltd.
- Global Marine Group Ltd.
- IT International Telecom Inc.
- Orange Marine SAS
- Sumitomo Electric Industries Ltd.
- LS Cable and System Ltd.
- Jiangsu Hengtong Marine Cable Systems Co., Ltd.
- S.B. Submarine Systems Co., Ltd.
- PT Communication Cable Systems Indonesia Tbk
- NTT Communications Corporation
- Verizon Communications Inc.
- Telstra Group Limited
- China Unicom Global Limited
- Telekom Malaysia Berhad
- Oman Telecommunications Company S.A.O.G. (Omantel)
- Meta Platforms, Inc.
- Amazon.com, Inc.
- Google LLC
Additional Benefits:
- The market estimate (ME) sheet in Excel format
- 3 months of analyst support
TABLE OF CONTENTS
1 INTRODUCTION
- 1.1 Study Assumptions and Market Definition
- 1.2 Scope of the Study
2 RESEARCH METHODOLOGY
3 EXECUTIVE SUMMARY
4 MARKET LANDSCAPE
- 4.1 Market Overview
- 4.2 Market Drivers
- 4.2.1 Growing Smartphone Penetration and Rising Internet Bandwidth Demand
- 4.2.2 Increasing Fiber Connectivity in Emerging Regions
- 4.2.3 Rapid 400 GbE and 800 GbE Upgrade Cycle among Carriers
- 4.2.4 Hyperscale Cloud and OTT Investment in Private Cables
- 4.2.5 Push toward Low-Latency Trans-polar Routes
- 4.2.6 Offshore Wind Farms Adopting Hybrid Power-Data Cables
- 4.3 Market Restraints
- 4.3.1 High Maintenance and Repair-Ship Costs
- 4.3.2 Growing Investment in LEO Satellite Constellations
- 4.3.3 Geopolitical Cable-Landing Permit Delays
- 4.3.4 Fiber-Optic Theft and Vandalism in Shallow Waters
- 4.4 Industry Value / Supply-Chain Analysis
- 4.5 Regulatory Landscape
- 4.6 Technological Outlook
- 4.7 Porter's Five Forces
- 4.7.1 Bargaining Power of Suppliers
- 4.7.2 Bargaining Power of Buyers
- 4.7.3 Threat of New Entrants
- 4.7.4 Threat of Substitute Products
- 4.7.5 Degree of Competition
- 4.8 Impact of Macroeconomic Factors on the Market
- 4.9 Investment Analysis
- 4.10 Submarine Cable Projects Database
5 MARKET SIZE AND GROWTH FORECASTS (VALUE)
- 5.1 By Component
- 5.1.1 Wet-Plant Equipment
- 5.1.2 Dry-Plant Equipment
- 5.1.3 Auxiliary and Marine Services
- 5.1.4 Other Components
- 5.2 By Cable Type
- 5.2.1 Single-mode Fiber
- 5.2.2 Multimode Fiber
- 5.2.3 SDM / Multi-core Fiber
- 5.3 By Client Type
- 5.3.1 Telecom Operators
- 5.3.2 Content and Hyperscale Cloud Providers
- 5.3.3 Government and Research Networks
- 5.3.4 Offshore Energy Operators
- 5.3.5 Other Clinet Types
- 5.4 By Capacity Design
- 5.4.1 less than or equal to 16 Tbps Systems
- 5.4.2 16 - 60 Tbps Systems
- 5.4.3 above 60 Tbps Systems
- 5.5 By Geography
- 5.5.1 North America
- 5.5.1.1 United States
- 5.5.1.2 Canada
- 5.5.2 South America
- 5.5.2.1 Brazil
- 5.5.2.2 Argentina
- 5.5.2.3 Rest of South America
- 5.5.3 Europe
- 5.5.3.1 Germany
- 5.5.3.2 France
- 5.5.3.3 United Kingdom
- 5.5.3.4 Rest of Europe
- 5.5.4 Asia-Pacific
- 5.5.4.1 China
- 5.5.4.2 India
- 5.5.4.3 Japan
- 5.5.4.4 Australia
- 5.5.4.5 Rest of Asia-Pacific
- 5.5.5 Middle East
- 5.5.5.1 Saudi Arabia
- 5.5.5.2 United Arab Emirates
- 5.5.5.3 Turkey
- 5.5.5.4 Rest of Middle East
- 5.5.6 Africa
- 5.5.6.1 South Africa
- 5.5.6.2 Egypt
- 5.5.6.3 Nigeria
- 5.5.6.4 Rest of Africa
- 5.5.1 North America
6 COMPETITIVE LANDSCAPE
- 6.1 Market Concentration
- 6.2 Strategic Moves
- 6.3 Market Share Analysis
- 6.4 Company Profiles (includes Global level Overview, Market level overview, Core Segments, Financials as available, Strategic Information, Market Rank/Share for key companies, Products and Services, and Recent Developments)
- 6.4.1 Alcatel Submarine Networks Ltd.
- 6.4.2 HMN Technologies Co., Ltd.
- 6.4.3 Nexans S.A.
- 6.4.4 SubCom, LLC
- 6.4.5 Fujitsu Ltd.
- 6.4.6 Global Marine Group Ltd.
- 6.4.7 IT International Telecom Inc.
- 6.4.8 Orange Marine SAS
- 6.4.9 Sumitomo Electric Industries Ltd.
- 6.4.10 LS Cable and System Ltd.
- 6.4.11 Jiangsu Hengtong Marine Cable Systems Co., Ltd.
- 6.4.12 S.B. Submarine Systems Co., Ltd.
- 6.4.13 PT Communication Cable Systems Indonesia Tbk
- 6.4.14 NTT Communications Corporation
- 6.4.15 Verizon Communications Inc.
- 6.4.16 Telstra Group Limited
- 6.4.17 China Unicom Global Limited
- 6.4.18 Telekom Malaysia Berhad
- 6.4.19 Oman Telecommunications Company S.A.O.G. (Omantel)
- 6.4.20 Meta Platforms, Inc.
- 6.4.21 Amazon.com, Inc.
- 6.4.22 Google LLC
7 MARKET OPPORTUNITIES AND FUTURE OUTLOOK
- 7.1 White-space and Unmet-Need Assessment


