|
시장보고서
상품코드
2122322
위협 인텔리전스 보안 서비스 : 시장 점유율 분석, 업계 동향과 통계, 성장 예측(2026-2031년)Threat Intelligence Security Services - Market Share Analysis, Industry Trends & Statistics, Growth Forecasts (2026 - 2031) |
||||||
 Mordor Intelligence
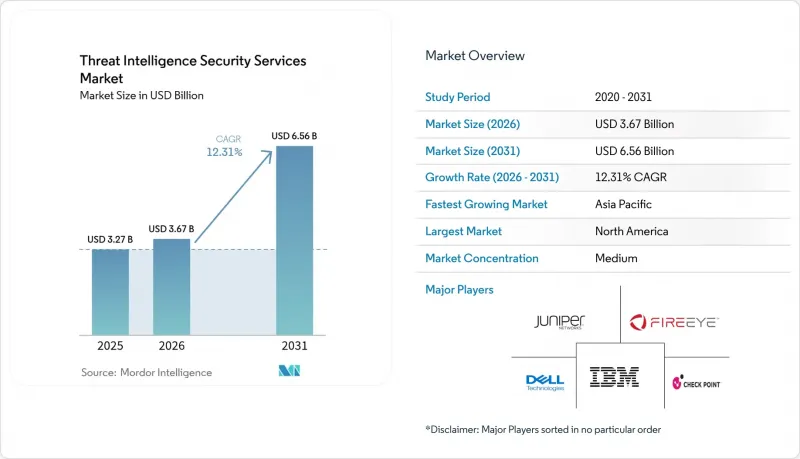
Mordor Intelligence에 의하면, 위협 인텔리전스 보안 서비스 시장 규모는 2025년에 32억 7,000만 달러로 평가되었고, 2026년 36억 7,000만 달러에서 2031년까지 65억 6,000만 달러에 이를 것으로 예측되며, 예측 기간(2026-2031년) CAGR은 12.31%를 기록할 전망입니다.
본 보고서는 도입 형태별(클라우드, On-Premise), 서비스 유형별(관리형 감지·대응, 전문 컨설팅, 기타), 조직 규모별(대기업, 중소기업), 최종 사용자 산업별(은행 및 금융 서비스, 헬스케어, 기타), 지역별로 분류되어 있습니다. 시장 예측은 금액(달러) 기준으로 제시되어 있습니다.
세계 위협 인텔리전스 보안 서비스 시장 동향 및 인사이트
국가 지원 APT 캠페인의 급속한 확대
Volt Typhoon 및 Salt Typhoon과 같은 국가 지원 그룹은 중요 인프라에 대한 활동을 강화하고 있으며, 이로 인해 조직들은 전술적 인텔리전스와 사고 발생 전의 배후 파악 능력을 우선시하게 되었습니다. 사이버보안 및 인프라 보안국(CISA)은 2024년에 3,368건의 랜섬웨어 사전 경보를 발령하여, 정교한 침입 시도가 많음을 여실히 드러내고 있습니다. 공격은 더 이상 스파이 활동에 그치지 않고 파괴적인 사전 배치까지 포함하게 되어, 지속적인 모니터링과 전문적인 헌팅이 요구되고 있습니다. 이란의 공격 주체들은 의료 및 금융 서비스를 동시에 표적으로 삼고 있으며, 위협 인텔리전스는 업종을 불문하고 전략적 필수 요건이 되었습니다. 이러한 동향으로 인해 관리형 감지, 고급 악성코드 분석, 맥락을 기반으로 한 공격원 식별 서비스에 대한 지출이 가속화되고 있습니다.
클라우드 워크로드의 급증과 API의 공격 표면
클라우드로의 전환으로 인해 공격 침투 경로는 두 배로 증가했으며, 조직들은 멀티 클라우드 환경에서 수천 개의 API를 운영하고 있습니다. 2024년에 보고된 클라우드 침해 사고의 대부분은 API 결함에 기인한 것으로, 동서 방향 트래픽에 대한 가시성 격차가 드러났습니다. 기존 네트워크 모니터링 방식으로는 일시적인 워크로드의 맥락을 파악할 수 없기 때문에 의존 관계를 실시간으로 매핑할 수 있는 클라우드 네이티브 위협 인텔리전스의 도입이 확대되고 있습니다. 마이크로서비스 아키텍처는 자산 인벤토리를 더욱 복잡하게 만들어 자동 감지 및 지속적인 리스크 스코어링에 대한 의존도를 높이고 있습니다. 그 결과, 서버리스 및 컨테이너 환경에 특화된 클라우드 기반 분석 엔진과 노출 관리 모듈에 대한 수요가 지속적으로 증가하고 있습니다.
Tier 1 위협 헌터 및 분석가 부족
고도의 포렌식 분석 및 악성코드 리버스 엔지니어링에 대한 수요가 공급을 초과하고 있습니다. 국가 수준의 공격자 전술을 습득하려면 수년간의 훈련이 필요하지만, 보안 팀은 인재 유출과 임금 상승에 직면해 있습니다. 이러한 격차로 인해 중소 벤더는 전문가 확보에 어려움을 겪고 있으며, 고객은 턴키 방식의 대응을 요구하며 관리형 감지 및 대응(MDR) 서비스로 눈을 돌리는 등 산업 재편이 진행되고 있습니다. 서비스 제공업체는 한정된 전문 인력을 부가가치가 더 높은 업무에 투입할 수 있도록 일상적인 트리아지를 자동화해야 하며, 이에 따라 AI를 활용한 분석 모듈에 대한 관심이 높아지고 있습니다.
부문 분석
클라우드 배포는 이미 위협 인텔리전스 보안 서비스 시장의 57.35%를 차지하고 있습니다. 이 부문은 2031년까지 연평균 성장률(CAGR) 18.03%로 확대될 것으로 예측되며, 클라우드 네이티브 분석 엔진의 중요성이 더욱 커지고 있습니다. 탄력적인 컴퓨팅과 분산형 스토리지를 통해 제공업체는 고객 측의 하드웨어 없이도 페타바이트 규모의 텔레메트리 데이터를 처리할 수 있게 됩니다. 이는 위협 인텔리전스 보안 서비스 시장 규모가 2031년에 65억 6,000만 달러로 확대되는 가운데 매우 중요한 요소입니다. On-Premise 배포는 로컬 데이터 처리가 요구되는 주권 클라우드 및 국방 부문에서 여전히 지속되고 있지만, 개발 로드맵에서는 현재 독립형 어플라이언스보다 하이브리드 커넥터가 우선시되고 있습니다. 규모 확대를 위해 클라우드를 도입하면서도, 규정 준수를 위해 특정 데이터 세트를 국내에 보관해야 하는 규제 대상 기업들 사이에서 하이브리드 도입이 진행되고 있습니다. API를 중심으로 한 공격 벡터는 기존 센서에는 컨테이너 트래픽의 컨텍스트 정보가 부족하기 때문에 클라우드의 중요성을 한층 더 부각시키고 있습니다. 파로알토 네트웍스는 AI를 중심으로 한 연간 경상 수익(ARR)이 2억 달러를 넘어 전년 대비 4배의 성장을 기록했다고 보고했으며, 이는 클라우드를 통해 제공되는 머신러닝 모듈에 대한 수요가 높음을 뒷받침합니다. 따라서 클라우드의 우위는 확고해졌지만, 벤더들은 추가적인 보급을 가속화하기 위해 지연 시간, 암호화, 지역성 등의 요인을 해결해야 합니다.
관리형 감지 및 대응(MDR)은 2025년 시점에서 위협 인텔리전스 보안 서비스 시장의 55.40% 점유율을 차지하고 있으며, 연평균 18.12%의 성장이 예상됩니다. 기업이 MDR을 선호하는 이유는 기술, 텔레메트리, 인간의 전문 지식이 융합되어 있어 인력 부담을 늘리지 않고도 평균 감지 시간(MTDR)을 단축할 수 있기 때문입니다. MDR 계약의 급증은 위협 인텔리전스 보안 서비스 시장이 성과 기반 제공으로 전환되고 있음을 보여줍니다. 전문 서비스는 성숙도 평가, 프레임워크 설계, 지속적인 위협 노출 관리(CTEM) 도입에 있어 여전히 필수적인 역할을 수행하고 있습니다.
구독형 피드는 상품화의 기반을 형성하고 있지만, 공격자 프로파일링 및 위험 점수 산정을 갖춘 풍부한 맥락의 패키지로 진화하고 있습니다. Fortinet은 2025년 1분기에 보안 운영 부문의 ARR(연간 반복 수익)으로 4억 3,450만 달러를 기록하여 전년 동기 대비 30.3% 증가했습니다. 이는 통합형 MDR과 오케스트레이션의 조합이 탄력을 받고 있음을 보여줍니다. 도구 통합이 진행되는 가운데, 엄선된 텔레메트리 데이터와 자동화된 격리 워크플로를 융합하는 벤더들은 확고한 차별화를 꾀하고 있습니다.
지역별 분석
북미는 전 세계 매출의 37.60%를 차지하고 있으며, 이는 미국이 2025년에 사이버 보안에 275억 달러를 배정하고 있다는 점에 힘입은 결과입니다. 이 예산에는 정보 공유 네트워크 확장을 위한 CISA 보조금 30억 달러가 포함되어 있습니다. 제로 트러스트의 높은 보급률, 견조한 벤처 자금 조달, 클라우드 네이티브 벤더의 생태계가 이 지역의 리더십을 뒷받침하고 있습니다. 연방 대통령령 제14028호에 따라 정부 기관은 위협 인텔리전스를 보안 운영에 통합해야 할 의무가 있으며, 관련 산업도 공급망 보장을 위해 이 모델을 따르고 있습니다. 캐나다는 미국의 정보 공개 기준과 조화를 꾀하고 있는 반면, 멕시코의 금융 규제 당국은 사고 보고 대상을 핀테크까지 확대하여 새로운 수요의 원천을 창출하고 있습니다.
아시아태평양은 연평균 성장률(CAGR) 18.55%를 나타낼 것으로 예측되며, 이는 세계에서 가장 빠른 속도입니다. 중국에서는 정부 프로그램을 통해 국내 보안 관리가 철저해짐에 따라, 사이버 보안 시장은 2029년까지 236억 6,000만 달러에 달할 전망입니다. 일본의 전략 문서에서는 국내 사이버 보안 매출을 3배로 확대하고 국가 예산을 50% 증액할 것을 요구하고 있으며, 이에 따라 산업급 위협 인텔리전스에 대한 수요가 증가하고 있습니다. 인도에서는 급속한 디지털화가 진행되고 있으며, CERT-IN의 지침에 따라 특정 사고에 대한 실시간 보고가 의무화되어 서비스 이용 확대가 촉진되고 있습니다. 호주의 5억 8,600만 호주 달러 규모의 사이버 복원력 대책 패키지는 관리형 인텔리전스에 대한 수요를 뒷받침하고 있으며, 지역 통신 사업자들은 국경을 넘는 텔레메트리 교환에 대한 투자를 진행하고 있습니다.
유럽에서는 NIS2 지침과 각국의 데이터 보호 규제가 원동력이 되어 꾸준한 성장을 유지하고 있습니다. 독일에서는 산업 자동화를 방해 행위로부터 보호하기 위해 2025년에 사이버 보안 지출이 100억 유로를 넘어설 것으로 예측됩니다. 영국은 정보 기관을 위해 6억 파운드의 추가 예산을 확보하고, 2035년까지 GDP의 5%를 국가 안보에 할당할 계획이며, 이로 인해 벤더들에게 장기적인 전망이 강화되고 있습니다. 데이터 주권에 관한 요건은 국경 내에서 텔레메트리 데이터를 처리할 수 있는 지역 보안 운영 센터의 성장을 가속하고 있습니다. 따라서 데이터 거주지를 고려한 클라우드 패브릭이나 다국어 분석가 지원을 제공하는 공급업체가 선호되고 있습니다.
기타 혜택
- 엑셀 형식 시장 예측(ME) 시트
- 3개월간의 애널리스트 지원
자주 묻는 질문
목차
제1장 서론
제2장 조사 방법
제3장 주요 요약
제4장 시장 구도
제5장 시장 규모와 성장 예측
제6장 경쟁 구도
제7장 시장 기회와 향후 전망
LSH 26.09.04According to Mordor Intelligence, the threat intelligence security services market size was valued at USD 3.27 billion in 2025 and estimated to grow from USD 3.67 billion in 2026 to reach USD 6.56 billion by 2031, at a CAGR of 12.31% during the forecast period (2026-2031).
This report is Segmented by Deployment Mode (Cloud, On-Premises), Service Type (Managed Detection & Response, Professional/Consulting and More), Organization Size (Large Enterprises, Small & Medium Enterprises), End-User Industry (Banking & Financial Services, Healthcare and More), and Geography. The Market Forecasts are Provided in Terms of Value (USD).
Global Threat Intelligence Security Services Market Trends and Insights
Rapid Escalation in State-Sponsored APT Campaigns
Nation-state groups such as Volt Typhoon and Salt Typhoon have intensified operations against critical infrastructure, prompting organizations to prioritize tactical intelligence and pre-incident attribution capabilities. The Cybersecurity and Infrastructure Security Agency issued 3,368 pre-ransomware notifications in 2024, underscoring the volume of advanced intrusion attempts. Attacks now go beyond espionage to include destructive pre-positioning, which demands continuous monitoring and specialized hunting. Iranian actors are simultaneously targeting healthcare and financial services, turning threat intelligence into a strategic imperative across sectors. These developments have accelerated spending on managed detection, enriched malware analysis, and contextual attribution services.
Proliferation of Cloud Workloads & API Attack-Surface
Cloud migration has multiplied attack entry points, with organizations operating thousands of APIs across multi-cloud settings. API failures contributed to a majority of cloud breaches reported in 2024, revealing visibility gaps in east-west traffic. Traditional network monitoring lacks context for ephemeral workloads, fuelling adoption of cloud-native threat intelligence that can map dependencies in real time. Microservices architectures further complicate asset inventories, increasing reliance on automated discovery and continuous risk scoring. The outcome is sustained momentum for cloud-delivered analytics engines and exposure management modules tailored to serverless and container environments.
Shortage of Tier-1 Threat-Hunters & Analysts
Demand for deep forensics and malware reverse-engineering outpaces supply. Years of training are needed to master nation-state adversary tactics, yet security teams face attrition and wage inflation. The gap is driving consolidation as smaller vendors struggle to retain experts, and clients turn to Managed Detection and Response for turnkey coverage. Providers must now automate routine triage to free scarce specialists for higher-value pursuits, heightening interest in AI-assisted analysis modules.
Other drivers and restraints analyzed in the detailed report include:
- Zero-Trust & XDR Platformisation by CISOs
- Mandatory Breach-Notification Laws
- Budget Compression in SME Segment
For complete list of drivers and restraints, kindly check the Table Of Contents.
Segment Analysis
Cloud deployment already commands 57.35% of the threat intelligence security services market share. The segment is projected to expand at an 18.03% CAGR through 2031, reinforcing the centrality of cloud-native analytics engines. Elastic compute and distributed storage enable providers to process petabytes of telemetry without customer-side hardware, which is critical as threat intelligence security services market size grows to USD 6.56 billion in 2031. On-premises deployments persist in sovereign cloud and defense contexts that require local data processing, although development roadmaps now prioritize hybrid connectors rather than standalone appliances. Hybrid adoption is rising among regulated firms that embrace the cloud for scale yet retain select data sets in country for compliance. API-centric attack vectors accentuate cloud resonance since traditional sensors lack context for container traffic. Palo Alto Networks reported AI-centric Annual Recurring Revenue above USD 200 million with 4x year-over-year growth, validating appetite for cloud-delivered machine learning modules. Cloud superiority is therefore entrenched, but vendors must address latency, encryption, and locality factors to accelerate further penetration.
Managed Detection and Response own 55.40% of the threat intelligence security services market share as of 2025 and are forecast to grow 18.12% annually. Enterprises favour MDR because it fuses technology, telemetry, and human expertise, reducing mean time to detect without staffing burdens. The surge in MDR contracts underlines how the threat intelligence security services market pivots toward outcome-based delivery. Professional services remain vital for maturity assessments, framework design, and Continuous Threat Exposure Management rollouts.
Subscription feeds form a commodity base but are evolving toward context-rich packages with actor profiling and risk scoring. Fortinet posted Security Operations ARR of USD 434.5 million in Q1 2025, up 30.3% year on year, signalling that integrated MDR plus orchestration gains momentum. Vendors blending curated telemetry with automated containment workflows are building defensible differentiation as tool consolidation continues.
Complete Report Scope:
- By Deployment Mode
- Cloud
- On-premise
- By Service Type
- Managed Detection and Response
- Professional / Consulting
- Subscription Data-feeds
- By Organization Size
- Large Enterprises
- Small and Medium Enterprises
- By End-user Industry
- Banking and Financial Services
- Healthcare
- IT and Telecom
- Retail and e-Commerce
- Life Sciences / Pharma
- Government and Defense
- By Geography
- North America
- United States
- Canada
- Mexico
- Europe
- United Kingdom
- Germany
- France
- Italy
- Rest of Europe
- Asia-Pacific
- China
- Japan
- India
- South Korea
- Rest of Asia-Pacific
- Middle East
- Israel
- Saudi Arabia
- United Arab Emirates
- Turkey
- Rest of Middle East
- Africa
- South Africa
- Egypt
- Rest of Africa
- South America
- Brazil
- Argentina
- Rest of South America
- North America
Geography Analysis
North America controls 37.60% of global revenue, supported by the United States' USD 27.5 billion cybersecurity allocation for 2025, which includes USD 3 billion for CISA grants that expand intelligence sharing networks. High adoption of zero-trust, robust venture funding, and an ecosystem of cloud-native vendors sustain regional leadership. Federal Executive Order 14028 compels government agencies to integrate threat intelligence into security operations, and adjacent industries replicate the model for supply-chain assurance. Canada is harmonizing with U.S. disclosure norms, while Mexico's financial regulator extends incident reporting to fintech, adding new demand vectors.
Asia-Pacific is projected to grow at an 18.55% CAGR, the fastest worldwide. China's cybersecurity market is on track to reach USD 23.66 billion by 2029 as government programs enforce in-country security controls. Japan's strategic documents call for tripling domestic cybersecurity sales and boosting national budgets by 50%, which elevates appetite for industry-grade threat intelligence. India continues rapid digitization; its CERT-IN directives oblige real-time reporting for specified incidents, driving service uptake. Australia's AUD 586 million cyber resilience package underpins managed intelligence demand, and regional telecom providers are investing in cross-border telemetry exchanges.
Europe maintains steady growth propelled by the NIS2 directive and local data protection mandates. Germany expects cybersecurity spending beyond €10 billion in 2025 to shield industrial automation from sabotage. The United Kingdom earmarked an extra £600 million for intelligence agencies and plans to devote 5% of GDP to national security by 2035 reinforce long-term visibility for vendors. Data-sovereignty requirements stimulate growth of regional security operations centers capable of processing telemetry within national borders. Providers offering residency-aware cloud fabrics and multilingual analyst support are therefore preferred.
- Google LLC (Mandiant)
- Recorded Future Inc.
- CrowdStrike Holdings Inc.
- Fortinet Inc.
- Cisco Systems Inc.
- International Business Machines Corporation
- Palo Alto Networks Inc.
- Dell Technologies Inc.
- Check Point Software Technologies Ltd.
- Trellix LLC (McAfee Enterprise)
- Broadcom Inc. (Symantec)
- LogRhythm Inc.
- Juniper Networks Inc.
- F-Secure Corporation
- LookingGlass Cyber Solutions Inc.
- Rapid7 Inc.
- Arctic Wolf Networks Inc.
- Trend Micro Incorporated
- Elastic N.V. (Security)
- Kaspersky Lab JSC
Additional Benefits:
- The market estimate (ME) sheet in Excel format
- 3 months of analyst support
TABLE OF CONTENTS
1 INTRODUCTION
- 1.1 Study Assumptions and Market Definition
- 1.2 Scope of the Study
2 RESEARCH METHODOLOGY
3 EXECUTIVE SUMMARY
4 MARKET LANDSCAPE
- 4.1 Market Overview
- 4.2 Market Drivers
- 4.2.1 Rapid escalation in state-sponsored APT campaigns
- 4.2.2 Proliferation of cloud workloads and API attack-surface
- 4.2.3 Zero-trust and XDR platformisation by CISOs
- 4.2.4 Mandatory breach-notification laws (US, EU, APAC)
- 4.2.5 Insider-risk from Gen-AI code-assistants (under-radar)
- 4.2.6 Adoption of CTEM* for continuous controls validation (under-radar)
- 4.3 Market Restraints
- 4.3.1 Shortage of Tier-1 threat-hunters and analysts
- 4.3.2 Budget compression in SME segment
- 4.3.3 Data-sovereignty barriers to cross-border telemetry sharing (under-radar)
- 4.3.4 Adversary abuse of spoofed TI feeds causing alert fatigue (under-radar)
- 4.4 Value / Supply-Chain Analysis
- 4.5 Regulatory Landscape
- 4.6 Technological Outlook
- 4.7 Porter's Five Forces Analysis
- 4.7.1 Threat of New Entrants
- 4.7.2 Bargaining Power of Buyers
- 4.7.3 Bargaining Power of Suppliers
- 4.7.4 Threat of Substitutes
- 4.7.5 Intensity of Rivalry
5 MARKET SIZE AND GROWTH FORECASTS (VALUE)
- 5.1 By Deployment Mode
- 5.1.1 Cloud
- 5.1.2 On-premise
- 5.2 By Service Type
- 5.2.1 Managed Detection and Response
- 5.2.2 Professional / Consulting
- 5.2.3 Subscription Data-feeds
- 5.3 By Organization Size
- 5.3.1 Large Enterprises
- 5.3.2 Small and Medium Enterprises
- 5.4 By End-user Industry
- 5.4.1 Banking and Financial Services
- 5.4.2 Healthcare
- 5.4.3 IT and Telecom
- 5.4.4 Retail and e-Commerce
- 5.4.5 Life Sciences / Pharma
- 5.4.6 Government and Defense
- 5.5 By Geography
- 5.5.1 North America
- 5.5.1.1 United States
- 5.5.1.2 Canada
- 5.5.1.3 Mexico
- 5.5.2 Europe
- 5.5.2.1 United Kingdom
- 5.5.2.2 Germany
- 5.5.2.3 France
- 5.5.2.4 Italy
- 5.5.2.5 Rest of Europe
- 5.5.3 Asia-Pacific
- 5.5.3.1 China
- 5.5.3.2 Japan
- 5.5.3.3 India
- 5.5.3.4 South Korea
- 5.5.3.5 Rest of Asia-Pacific
- 5.5.4 Middle East
- 5.5.4.1 Israel
- 5.5.4.2 Saudi Arabia
- 5.5.4.3 United Arab Emirates
- 5.5.4.4 Turkey
- 5.5.4.5 Rest of Middle East
- 5.5.5 Africa
- 5.5.5.1 South Africa
- 5.5.5.2 Egypt
- 5.5.5.3 Rest of Africa
- 5.5.6 South America
- 5.5.6.1 Brazil
- 5.5.6.2 Argentina
- 5.5.6.3 Rest of South America
- 5.5.1 North America
6 COMPETITIVE LANDSCAPE
- 6.1 Market Concentration
- 6.2 Strategic Moves
- 6.3 Market Share Analysis
- 6.4 Company Profiles (includes Global level Overview, Market level overview, Core Segments, Financials as available, Strategic Information, Market Rank/Share for key companies, Products and Services, and Recent Developments)
- 6.4.1 Google LLC (Mandiant)
- 6.4.2 Recorded Future Inc.
- 6.4.3 CrowdStrike Holdings Inc.
- 6.4.4 Fortinet Inc.
- 6.4.5 Cisco Systems Inc.
- 6.4.6 International Business Machines Corporation
- 6.4.7 Palo Alto Networks Inc.
- 6.4.8 Dell Technologies Inc.
- 6.4.9 Check Point Software Technologies Ltd.
- 6.4.10 Trellix LLC (McAfee Enterprise)
- 6.4.11 Broadcom Inc. (Symantec)
- 6.4.12 LogRhythm Inc.
- 6.4.13 Juniper Networks Inc.
- 6.4.14 F-Secure Corporation
- 6.4.15 LookingGlass Cyber Solutions Inc.
- 6.4.16 Rapid7 Inc.
- 6.4.17 Arctic Wolf Networks Inc.
- 6.4.18 Trend Micro Incorporated
- 6.4.19 Elastic N.V. (Security)
- 6.4.20 Kaspersky Lab JSC
7 MARKET OPPORTUNITIES AND FUTURE OUTLOOK
- 7.1 White-space and Unmet-need Assessment