

|
시장보고서
상품코드
2122359
흑연 : 시장 점유율 분석, 업계 동향과 통계, 성장 예측(2026-2031년)Graphite - Market Share Analysis, Industry Trends & Statistics, Growth Forecasts (2026 - 2031) |
||||||
 Mordor Intelligence
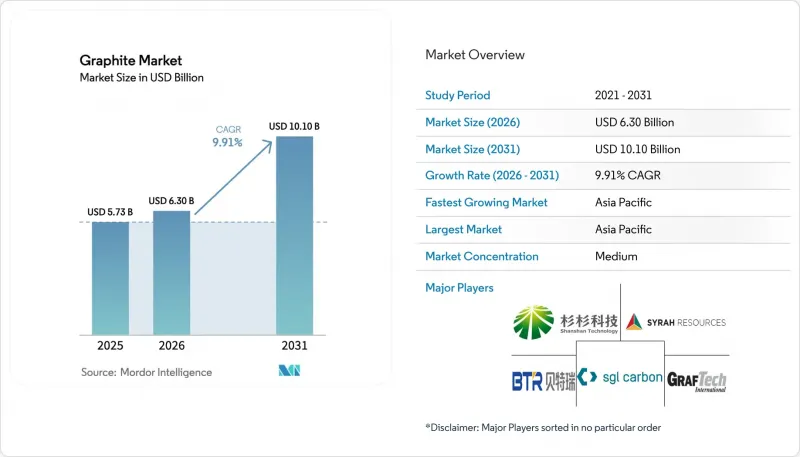
Mordor Intelligence에 의하면, 흑연 시장 규모는 2025년에 57억 3,000만 달러, 2026년에 63억 달러에 이르고, 2031년까지 101억 달러에 이를 것으로 예측되며, 2026-2031년 CAGR 9.91%를 기록할 전망입니다.
본 보고서는 유형별(천연 흑연, 합성 흑연), 용도별(전극, 내화물·주조·주조소, 배터리, 윤활제, 기타), 최종 사용자 산업별(야금, 전자, 자동차, 기타),지역별(아시아태평양, 북미, 유럽, 남미, 중동 및 아프리카)로 분류되어 있습니다. 시장 전망은 금액(달러)과 수량(톤)으로 제시되어 있습니다.
세계 흑연 시장 동향 및 인사이트
리튬 이온 배터리 기가팩토리 건설의 급증
새로운 기가팩토리가 매년 약 150GWh의 셀 생산 능력을 확대함에 따라, 배터리용 흑연 수요는 2024년 90만 톤에서 2030년까지 270만 톤으로 3배 증가할 전망입니다. BTR New Material은 CATL 및 BYD와의 계약을 확보하기 위해 2025년에 연간 12만 톤 규모의 음극재 생산 능력을 증설했습니다. Vianode는 1억 5,000만 유로의 자기자본을 바탕으로 노르웨이에서 연간 1만 톤 규모의 합성 흑연 공장을 가동하며, 중국산 이외공급을 원하는 유럽 바이어들을 대상으로 하고 있습니다. 미국에서는 Syrah Resources의 비달리아 공장이 에너지부로부터 2억 2,000만 달러의 대출 보증을 확보한 후, 2025년 중반까지 연간 1만 1,250톤의 생산 능력에 도달했습니다. LFP(인산철 리튬) 계열의 화학 조성으로 인해 음극의 충전율이 15% 향상되어, 하이엔드 배터리에서 실리콘 대체의 위험을 상쇄하고 있습니다.
전기 아크로(EAF)를 통한 철강 생산 능력 확대
탈탄소화 정책에 따라 고로에서 전기 아크로(EAF)로의 전환이 진행됨에 따라, 2030년까지 전기 아크로(EAF)용 강재의 흑연 전극 수요는 2024년의 85만 톤에서 연간 110만 톤으로 증가할 것으로 예측됩니다. HEG Limited는 인도의 인프라 주도형 철강 수요에 대응하기 위해 2025 회계연도에 설비 가동률을 72%로 높였습니다. Graphite India는 동남아시아 및 중동 고객을 대상으로 연간 2만 톤 규모의 초고출력 전극 생산 라인을 증설했습니다. 독일의 Salzgitter AG는 2029년까지 연간 8,000톤의 전극 수요를 증가시킬 전기 아크로로 전환할 계획입니다. 초고출력 전극은 30%의 가격 프리미엄이 책정되어 있지만, 용광로의 에너지 사용량을 15% 절감하여 제철소의 수익성을 향상시킵니다.
합성 흑연의 원료인 니들 코크스 공급 부족
Philips 66은 2024년에 석유계 니들 코크스 생산에서 철수함에 따라 연간 18만 톤의 생산 능력이 상실되어 전 세계 공급이 15% 부족해졌습니다. 그래프텍(GraphTech)은 저유황 코크스 조달에 어려움을 겪어 2025년 1분기 전극 출하량이 22% 감소했습니다. 2025년 상반기, 현물 시장의 구매자들은 가격이 18% 급등하는 것을 목격한 반면, 일본과 중국의 대기업들은 톤당 500달러의 프리미엄을 지불하고 콜타르 피치에 대한 다년 계약을 확보했습니다. 초고출력 전극에 적합한 니들 코크스를 생산하는 정제소는 전 세계에 단 12곳에 불과하며, 2022년 이후 확장을 발표한 기업은 단 한 곳도 없었습니다. 혼합 원료를 사용하면 전극 수명이 10% 단축되기 때문에 고성능 용광로에서의 채택이 제한되고 있습니다.
부문 분석
합성 흑연은 배터리용 음극재 및 초고출력 전극에서 순도 면에서의 우위를 바탕으로 2025년 시점에서 시장 점유율 59.09%를 유지했습니다. 한편, 천연 흑연은 내화물, 윤활제, 팽창 흑연 제품에서의 낮은 비용을 바탕으로 2031년까지 연평균 성장률(CAGR) 12.29%로 확대될 것으로 예측됩니다. 2025년 천연 농축물의 평균 가격은 톤당 800-1,200달러였던 반면, 배터리용 합성 흑연은 톤당 4,500-6,500달러로, 이러한 가격 차이는 비용에 민감한 구매자들을 끌어들이고 있습니다. 따라서 합성 흑연이 절대 매출액 면에서 앞서더라도, 천연 흑연 용도 시장 규모는 합성 흑연보다 더 빠른 속도로 확대될 전망입니다.
생산 거점의 분포는 양극화되어 있습니다. 중국, 일본, 한국이 여전히 합성 흑연 생산 능력의 78%를 차지하고 있지만, 북미와 유럽에서는 2025년에 연간 6만 톤의 생산 능력이 증강되어 공급 안정성이 향상되었습니다. 천연 흑연은 모잠비크, 탄자니아, 마다가스카르, 브라질에 걸쳐 있는 지리적 다양성을 강점으로 가지고 있으며, 이들 국가의 매장량 합계는 1억 톤을 초과합니다. 에너지 집약적인 흑연화 공정으로 인해 합성 흑연 제조업체는 탄소 가격 위험에 노출되어 있지만, 반면 천연 흑연 가공에는 1톤당 5분의 1에 해당하는 전력만 소비되며, 재생에너지를 활용한 선광 플랜트의 혜택을 점점 더 많이 누리고 있습니다.
지역별 분석
아시아태평양은 2025년 매출의 55.72%를 차지하며, 2031년까지 연평균 성장률(CAGR) 11.34%를 나타낼 것으로 예측됩니다. 중국에서는 CATL과 BYD에 공급하기 위해 2024년부터 2025년에 걸쳐 연간 120만 톤 규모의 신규 합성 흑연 생산 능력이 가동을 시작했습니다. 일본과 한국은 반도체용 등급 생산량의 65%를 차지하고 있으며, TSMC, 삼성, 인텔의 팹에 연간 1만 2,000톤의 초고순도 소재를 수출하고 있습니다. 인도의 전극 제조업체들은 국내 전기로(EAF) 제강 수요 증가에 대응하기 위해 2025 회계연도에 가동률을 72%로 끌어올렸습니다. 따라서 아시아태평양의 흑연 시장 규모는 광산, 음극재 공장, 하류 기가팩토리에 걸친 통합된 공급망에 의해 지속적으로 뒷받침되고 있습니다.
북미 시장 점유율은 국내 음극재 자급자족을 목표로 한 2025년 12억 달러 규모의 투자에 힘입어 확대될 것으로 예측됩니다. 시라(Shira)사의 비달리아 공장은 2025년에 연간 1만 1,250톤에 도달할 전망이며, 2028년까지 연간 4만 톤을 목표로 하고 있습니다. NOVONIX는 테네시주에 연간 3만 톤 규모의 합성 흑연 생산 시설을 건설하기 위해 미국 에너지부로부터 1억 5,000만 달러의 보조금을 확보했으며, 해당 시설은 2027년에 가동을 시작할 예정입니다. 캐나다의 비셋 크릭 광산은 2024년에 가동을 재개하여 연간 2만 5,000톤의 정광을 공급하고 있습니다. 또한, 테슬라가 멕시코에 건설 예정인 몬테레이 기가팩토리에서는 2027년까지 연간 8,000톤의 음극재가 필요할 것으로 전망됩니다. Philips 66이 2024년에 철수하면서 현지 원료 공급원이 사라졌기 때문에 니들 코크의 부족이 여전히 해당 지역의 가장 큰 제약 요인으로 남아 있습니다.
유럽에서는 노르웨이의 비아노드(Vianode) 공장을 필두로 성장이 예상됩니다. 이 회사는 2025년 3월에 1억 5,000만 유로를 조달하여, 2030년까지 연간 생산 능력을 1만 톤에서 5만 톤으로 확대할 계획입니다. 스웨덴의 타르가 그룹은 유럽투자은행으로부터 1억 5,000만 유로의 자금을 확보하여, 비탕기 천연 흑연 프로젝트를 2027년까지 연간 1만 9,500톤 규모로 확대할 예정입니다. 수력발전을 활용하여 CO2 배출량을 1kg당 1.2kg으로 억제하는 것을 목표로 하고 있습니다. 독일의 SGL 카본과 프랑스의 메르센은 반도체 및 항공우주용 고기능 흑연의 생산 능력을 합쳐 연간 5,000톤 증강했습니다. 2026년부터 단계적으로 도입될 EU의 탄소 국경 조정 메커니즘에 따라, 수요는 저탄소 흑연 및 전기로(EAF) 강철로 이동하고 있습니다. 북유럽 공급업체들은 저렴한 재생에너지와 유럽의 기가팩토리와의 근접성을 활용하여 흑연 시장에서 친환경 틈새 시장을 개척하고 있습니다.
기타 혜택
- 엑셀 형식 시장 예측(ME) 시트
- 3개월간의 애널리스트 지원
자주 묻는 질문
목차
제1장 서론
제2장 조사 방법
제3장 주요 요약
제4장 시장 구도
제5장 시장 규모와 성장 예측
제6장 경쟁 구도
제7장 시장 기회와 향후 전망
LSH 26.09.04According to Mordor Intelligence, the graphite market size is projected to be USD 5.73 billion in 2025, USD 6.30 billion in 2026, and reach USD 10.10 billion by 2031, growing at a CAGR of 9.91% from 2026 to 2031.
This report is Segmented by Type (Natural Graphite and Synthetic Graphite), Application (Electrodes, Refractories/Casting/Foundries, Batteries, Lubricants, and Other Applications), End-User Industry (Metallurgy, Electronics, Automotive, and Others), and Geography (Asia-Pacific, North America, Europe, South America, and Middle East and Africa). Market Forecasts are Provided in Terms of Value (USD) and Volume (Tons).
Global Graphite Market Trends and Insights
Soaring Li-Ion Battery Gigafactory Build-Outs
Battery-grade graphite demand is set to triple from 900,000 t in 2024 to 2.7 million t by 2030 as new gigafactories add roughly 150 GWh of cell capacity each year. BTR New Material added 120,000 t pa of anode output in 2025 to secure contracts with CATL and BYD. Vianode commissioned a 10,000 t pa synthetic-graphite plant in Norway, backed by EUR 150 million equity, targeting European buyers seeking non-Chinese supply. In the United States, Syrah Resources' Vidalia facility reached 11,250 t pa by mid-2025 after winning a USD 220 million Department of Energy loan guarantee. LFP chemistries raise anode loading by 15%, offsetting silicon substitution risk in high-end cells.
Expansion of Electric-Arc-Furnace Steel Capacity
EAF steel will require 1.1 million t of graphite electrodes annually by 2030, up from 850,000 t in 2024, as decarbonization policies spur blast-furnace conversions. HEG Limited lifted capacity utilization to 72% in FY2025 to meet India's infrastructure-led steel demand. Graphite India added a 20,000 t pa ultra-high-power electrode line aimed at Southeast Asia and Middle East customers. Germany's Salzgitter AG plans an EAF conversion that will add 8,000 t pa of electrode demand by 2029. Ultra-high-power electrodes carry a 30% price premium yet cut furnace energy use by 15%, improving steel-mill economics.
Needle-Coke Feedstock Bottlenecks for Synthetic Graphite
Phillips 66 exited petroleum needle-coke production in 2024, erasing 180,000 t pa of capacity and tightening global supply by 15%. GrafTech's Q1 2025 electrode shipments fell 22% as it struggled to source low-sulfur coke. Spot buyers saw an 18% price jump in H1 2025, while Japanese and Chinese majors secured multi-year coal-tar-pitch deals at a USD 500/t premium. Only a dozen refineries worldwide produce needle coke suitable for ultra-high-power electrodes, and none announced expansions after 2022. Blended feedstocks reduce electrode life by 10%, limiting their uptake in premium furnaces.
Other drivers and restraints analyzed in the detailed report include:
- Rising Demand for Ultra-High-Purity Synthetic Graphite in Semiconductors
- China's Export-Licence Regime Accelerating Ex-China Supply Investments
- Battery-Anode Silicon Substitution Eroding Graphite Intensity per kWh
For complete list of drivers and restraints, kindly check the Table Of Contents.
Segment Analysis
Synthetic graphite retained 59.09% of the market share in 2025, thanks to its purity advantage in battery anodes and ultra-high-power electrodes. Natural grades, however, are forecast to expand at a 12.29% CAGR to 2031, lifted by lower costs in refractories, lubricants, and expandable-graphite products. Natural concentrate averaged USD 800-1,200/t in 2025 versus USD 4,500-6,500/t for battery-grade synthetic, a spread that encourages cost-conscious buyers. The graphite market size for natural graphite applications is therefore set to widen faster than synthetic, even if the latter keeps higher absolute revenues.
Production footprints are diverging. China, Japan, and South Korea still host 78% of synthetic capacity, yet North America and Europe added 60,000 t pa in 2025, improving supply security. Natural graphite draws strength from geographic diversity across Mozambique, Tanzania, Madagascar, and Brazil, whose combined reserves exceed 100 million t. Energy-intensive graphitization subjects synthetic producers to carbon-pricing risk, whereas natural processing consumes one-fifth of the electricity per tonne and increasingly benefits from renewable-powered beneficiation plants.
Complete Report Scope:
- By Type
- Natural Graphite
- Synthetic Graphite
- By Application
- Electrodes
- Refractories, Casting and Foundries
- Batteries
- Lubricants
- Other Applications (Thermal Management Materials, Friction Products and Brake Linings,etc.)
- By End-user Industry
- Metallurgy
- Electronics
- Automotive
- Other Industries (Energy, Aerospace and Defence, etc.)
- By Geography
- Asia-Pacific
- China
- India
- Japan
- South Korea
- ASEAN Countries
- Rest of Asia-Pacific
- North America
- United States
- Canada
- Mexico
- Europe
- Germany
- United Kingdom
- France
- Italy
- Spain
- NORDIC Countries
- Rest of Europe
- South America
- Brazil
- Argentina
- Rest of South America
- Middle-East and Africa
- Saudi Arabia
- United Srab Emirates
- Egypt
- South Africa
- Rest of Middle-East and Africa
- Asia-Pacific
Geography Analysis
Asia-Pacific controlled 55.72% of 2025 revenue and is forecast to grow at an 11.34% CAGR through 2031. China commissioned 1.2 million t pa of new synthetic capacity between 2024 and 2025 to serve CATL and BYD. Japan and South Korea account for 65% of semiconductor-grade output, exporting 12,000 t pa of ultra-high-purity material to TSMC, Samsung, and Intel fabs. India's electrode producers raised utilization to 72% in FY2025 to meet domestic EAF steel growth. The graphite market size in Asia-Pacific, therefore, remains anchored by integrated supply chains spanning mines, anode plants, and downstream gigafactories.
North America's market share is projected to expand, propelled by USD 1.2 billion of 2025 investments aimed at domestic anode independence. Syrah's Vidalia plant hit 11,250 t pa in 2025 and targets 40,000 t pa by 2028. NOVONIX secured a USD 150 million Department of Energy grant to build a 30,000 t pa synthetic facility in Tennessee that will come online in 2027. Canada's Bissett Creek mine restarted in 2024 to supply 25,000 t pa of concentrate, and Tesla's upcoming Monterrey gigafactory in Mexico will need 8,000 t pa of anode material by 2027. Needle-coke scarcity remains the region's largest constraint since Phillips 66's 2024 exit removed a local feedstock source.
Europe will register growth, led by Norway's Vianode plant, which raised EUR 150 million in March 2025 to scale from 10,000 t pa to 50,000 t pa by 2030. Sweden's Talga Group secured a EUR 150 million European Investment Bank loan to expand its Vittangi natural-graphite project to 19,500 t pa by 2027, achieving a 1.2 kg CO2/kg footprint using hydropower. Germany's SGL Carbon and France's Mersen added a combined 5,000 t pa of specialty-graphite capacity for semiconductors and aerospace. The EU's Carbon Border Adjustment Mechanism, phased in from 2026, tilts demand toward low-emission graphite and EAF steel. Nordic suppliers leverage cheap renewables and proximity to European gigafactories to carve a green niche in the graphite market.
- Graphit Kropfmuhl GmbH
- Asbury Carbons
- BTR New Material Group Co., Ltd.
- Fangda Carbon New Material Co., Ltd.
- GrafTech International Ltd.
- Graphit Kropfmuhl GmbH
- Graphite India Limited
- HEG Limited
- Imery
- Mason Resources Inc.
- Mersen
- Nippon Kokuen Group
- Northern Graphite
- POCO
- Resonac Holdings Corporation
- SGL Carbon
- Shanghai Shanshan Technology Co., Ltd.
- Syrah Resources Limited
- Tokai Carbon Co., Ltd.
- Triton Minerals Limited
Additional Benefits:
- The market estimate (ME) sheet in Excel format
- 3 months of analyst support
TABLE OF CONTENTS
1 Introduction
2 Research Methodology
3 Executive Summary
4 Market Landscape
- 4.1 Market Overview
- 4.2 Market Drivers
- 4.2.1 Soaring Li-ion battery gigafactory build-outs
- 4.2.2 Expansion of electric-arc-furnace (EAF) steel capacity
- 4.2.3 Rising demand for ultra-high-purity synthetic graphite in the semiconductor industry
- 4.2.4 China's export-licence regime accelerating ex-China supply investments
- 4.2.5 Emergence of bio-based "green" synthetic graphite routes
- 4.3 Market Restraints
- 4.3.1 Needle-coke feedstock bottlenecks for synthetic graphite
- 4.3.2 Stringent HF-emission regulations on purification lines
- 4.3.3 Battery-anode silicon substitution eroding graphite intensity per kWh
- 4.4 Value Chain Analysis
- 4.5 Porter's Five Forces
- 4.5.1 Bargaining Power of Suppliers
- 4.5.2 Bargaining Power of Buyers
- 4.5.3 Threat of New Entrants
- 4.5.4 Threat of Substitute Products & Services
- 4.5.5 Degree of Competition
5 Market Size & Growth Forecasts (Value and Volume)
- 5.1 By Type
- 5.1.1 Natural Graphite
- 5.1.2 Synthetic Graphite
- 5.2 By Application
- 5.2.1 Electrodes
- 5.2.2 Refractories, Casting and Foundries
- 5.2.3 Batteries
- 5.2.4 Lubricants
- 5.2.5 Other Applications (Thermal Management Materials, Friction Products and Brake Linings,etc.)
- 5.3 By End-user Industry
- 5.3.1 Metallurgy
- 5.3.2 Electronics
- 5.3.3 Automotive
- 5.3.4 Other Industries (Energy, Aerospace and Defence, etc.)
- 5.4 By Geography
- 5.4.1 Asia-Pacific
- 5.4.1.1 China
- 5.4.1.2 India
- 5.4.1.3 Japan
- 5.4.1.4 South Korea
- 5.4.1.5 ASEAN Countries
- 5.4.1.6 Rest of Asia-Pacific
- 5.4.2 North America
- 5.4.2.1 United States
- 5.4.2.2 Canada
- 5.4.2.3 Mexico
- 5.4.3 Europe
- 5.4.3.1 Germany
- 5.4.3.2 United Kingdom
- 5.4.3.3 France
- 5.4.3.4 Italy
- 5.4.3.5 Spain
- 5.4.3.6 NORDIC Countries
- 5.4.3.7 Rest of Europe
- 5.4.4 South America
- 5.4.4.1 Brazil
- 5.4.4.2 Argentina
- 5.4.4.3 Rest of South America
- 5.4.5 Middle-East and Africa
- 5.4.5.1 Saudi Arabia
- 5.4.5.2 United Srab Emirates
- 5.4.5.3 Egypt
- 5.4.5.4 South Africa
- 5.4.5.5 Rest of Middle-East and Africa
- 5.4.1 Asia-Pacific
6 Competitive Landscape
- 6.1 Market Concentration
- 6.2 Strategic Moves
- 6.3 Market Share(%)/Ranking Analysis
- 6.4 Company Profiles (includes Global level Overview, Market level overview, Core Segments, Financials as available, Strategic Information, Market Rank/Share for key companies, Products & Services, and Recent Developments)
- 6.4.1 Graphit Kropfmuhl GmbH
- 6.4.2 Asbury Carbons
- 6.4.3 BTR New Material Group Co., Ltd.
- 6.4.4 Fangda Carbon New Material Co., Ltd.
- 6.4.5 GrafTech International Ltd.
- 6.4.6 Graphit Kropfmuhl GmbH
- 6.4.7 Graphite India Limited
- 6.4.8 HEG Limited
- 6.4.9 Imery
- 6.4.10 Mason Resources Inc.
- 6.4.11 Mersen
- 6.4.12 Nippon Kokuen Group
- 6.4.13 Northern Graphite
- 6.4.14 POCO
- 6.4.15 Resonac Holdings Corporation
- 6.4.16 SGL Carbon
- 6.4.17 Shanghai Shanshan Technology Co., Ltd.
- 6.4.18 Syrah Resources Limited
- 6.4.19 Tokai Carbon Co., Ltd.
- 6.4.20 Triton Minerals Limited
7 Market Opportunities & Future Outlook
- 7.1 White-space & Unmet-Need Assessment
- 7.2 Supply-Chain Diversification & Recycling Initiatives


