

|
시장보고서
상품코드
2122390
양수 발전(PHS) : 시장 점유율 분석, 산업 동향·통계 데이터, 성장 예측(2026-2031년)Pumped Hydro Storage (PHS) - Market Share Analysis, Industry Trends & Statistics, Growth Forecasts (2026 - 2031) |
||||||
 Mordor Intelligence
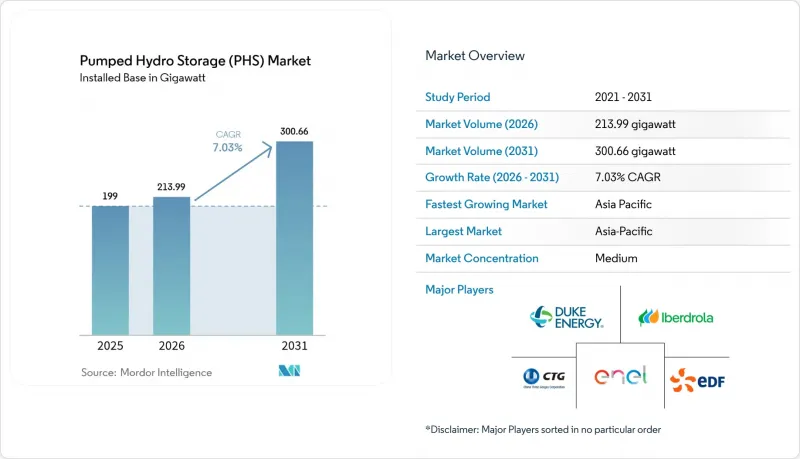
Mordor Intelligence에 따르면 양수 발전(PHS) 시장 규모는 2025년에 199기가와트라고 평가되며, 2026년 213.99기가와트로부터 2031년까지 300.66기가와트에 달할 것으로 추정되고 있으며, 예측 기간(2026-2031년)에 CAGR은 7.03%에 달할 전망입니다.
이 보고서는 유형별(개루프식, 폐루프식), 정격 출력별(200MW 미만, 200-1,000MW, 1,000MW 이상), 저수지 구성별(지표면 간, 지표면·지하 간),용도(재생에너지 안정화, 계통 보조 서비스, 차익 거래·피크 셰이빙) 및 지역(북미, 유럽, 아시아태평양, 남미, 중동 및 아프리카)별로 분류되어 있습니다.
전 세계 양수 발전(PHS) 시장의 동향 및 인사이트
전력망 규모의 재생에너지 통합 의무화가 도입 가속화를 지원
청정 에너지에 대한 의무적 목표에 따라 전력 회사와 각국의 기획 담당자들은 양수 발전 시장의 확대를 요구받고 있으며, 2030년까지 120 GW를 달성하겠다는 중국의 공약은 정책 주도의 확대를 보여주는 좋은 사례입니다. ‘PSH-plus’ 모델은 재생에너지 집적지와 인접한 저장 시설을 연결하여 발전 억제를 완화하고 송전망 확장 비용을 절감합니다. 유럽에서는 ‘공동 관심 프로젝트(PCI)’ 리스트을 통해 유사한 노력이 진행되고 있으며, 이 리스트에는 허가 절차가 간소화된 12개의 저장 계획이 포함되어 있습니다. 또한 스페인이 7억 유로의 보조금 예산을 마련한 것은 각국의 노력을 더욱 지원하는 것이며, 명확한 수익 전망을 제공함으로써 투자자의 수익에 대한 위험을 경감시키고 있습니다.
노후된 수력 발전 인프라의 재가동을 통해 잠재적인 발전 용량이 확보됩니다.
가역식 펌프 터빈을 추가하여 기존 댐을 현대화함으로써, 그린필드 건설에 수반되는 토지 이용 논란을 일으키지 않고도 기존 자산에 새로운 활력을 불어넣을 수 있습니다. 미국 에너지부가 국내 수력 발전 설비를 업그레이드하기 위해 시행하고 있는 4억 3,000만 달러 규모의 구상은 잠재적 이익의 규모를 여실히 보여주고 있습니다. 온타리오 파워 제너레이션(Ontario Power Generation)이 8곳의 발전소를 대상으로 진행하는 10억 달러 규모의 개보수 사업에서는 고효율 설비를 도입함으로써 1,617 MW의 발전량 증가가 예상되는 반면,멕시코내 9곳 발전소의 개보수를 통해 연간 발전량은 1,754GWh 증가하고, 가동 수명은 50년 연장될 전망입니다.
장기간에 걸친 환경영향 평가가 개발 일정을 제약하고 있습니다.
지질학, 생물다양성, 문화유산을 대상으로 한 조사에는 5-10년이 소요될 수 있으며, 비용 초과나 인허가 취득의 어려움을 초래하고 있습니다. 폐쇄형 시스템은 수생 환경에 미치는 영향을 완화하지만, 뉴욕주 마인빌(Mineville)의 신청 사례가 보여주듯이, 수문지질학적 위험에 대해서는 여전히 사업별 심사가 필요합니다.
부문 분석
2025년 현재, 폐쇄형 발전소는 양수 발전 시장의 53.40%를 차지하고 있으며, 연평균 성장률(CAGR) 7.56%로 확대되고 있습니다. 이는 주로 하천으로부터의 독립화로 인해 수생 환경에 미치는 영향이 경감되고, 인가 절차가 신속화되었기 때문입니다. 연방에너지규제위원회(FERC)는 현재 이러한 프로젝트 전용으로 2년간의 신속한 인허가 제도를 제공하고 있으며, 도입상의 우위를 더욱 공고히 하고 있습니다. 개루프 방식 시설은 여전히 상당한 규모를 유지하고 있지만, 특히 유량 조절이나 어류의 상류가 쟁점이 되는 지역에서는 생태계에 대한 감시가 더욱 엄격해지고 있습니다.
폐루프 방식 또한 폐광이나 채석장 등 새로운 지형을 활용할 수 있게 하여 양수 발전 시장의 지역적 범위를 확대하고 있습니다. 수명 주기 분석에 따르면 퇴적 위험이 낮고 배수 과정도 단순하므로 사업자는 수십년에 높은 왕복 효율을 유지할 수 있습니다. 이와 병행하여 각 공급업체들은 전용 저수지에 적합하고, 재생 가능 에너지의 수급 조정에 필수적인 신속한 모드 전환을 가능하게 하는 가변 속도 펌프 터빈의 개량을 추진하고 있습니다.
200-1,000MW 규모의 발전소는 설비 투자와 송전망 수용 한계를 조화시키고 있으며, 2025년 양수 발전 시장 규모의 45.20%를 차지했습니다. 아다니 그린(Adani Green)의 1,250MW 우타르 프라데시 주 프로젝트와 같은 지역 사업자들은 송전망 업그레이드와 조화를 이룬 가동 개시가 혼잡으로 인한 발전 제한으로부터 어떻게 보호해 주는지를 보여주고 있습니다.
분산형 아키텍처의 부상에 따라 200MW 미만 설비는 2031년까지 연평균 성장률(CAGR) 8.06%를 기록할 전망입니다. 환경 부하가 낮아 지방자치단체의 승인을 얻기 쉽고, 모듈식 토목 공사로 인해 공사 기간 리스크가 감소하므로 투자자들의 관심을 높이고 있습니다. 반면, 1,000MW 이상의 프로젝트는 대규모 관성력을 제공할 수 있는 반면, 리드타임이 길어지고 여론의 엄격한 감시를 받게 됩니다. 중국에서 건설된 3.6GW 규모의 펑닝(Fengning) 프로젝트가 막대한 생태계 보상을 요구받은 사례가 이를 지원하고 있습니다.
지역별 분석
아시아태평양은 2025년 양수 발전 시장의 48.40%를 차지하고 있으며, 중국의 50.94GW 설비 용량과 300곳 이상의 발전소를 계획하고 있는 적극적인 파이프라인 덕분에 연평균 성장률(CAGR) 8.85%를 기록하고 있습니다. 베이징의 계획 체계에서는 에너지 저장을 재생 가능 에너지 기반과 통합함으로써 발전 제한을 최소화하고, 송전망 강화 비용을 절감하고 있습니다. 한편, 인도의 103GW에 달하는 기술적 잠재력은 여전히 거의 개발되지 않은 상태이지만, 지원적인 요금 지침 발표에 따라 현재 본격적인 건설을 위한 준비가 완료되었습니다.
유럽의 수력 양수 발전 시장은 에너지 저장을 우선적인 자산군으로 자리매김하는 EU의 5,840억 유로 규모의 송전망 현대화 로드맵을 통해 강력한 정책 지원을 받고 있습니다. 유럽투자은행(EIB) 등 기관계 금융기관은 이베리아 반도의 시설을 개보수 및 출력 증강하고, 저수지의 효율을 향상시키며, 피크 시간대 공급 능력을 강화하기 위해 2025년에 이베르드롤라(Iberdrola)사에 1억 800만 유로의 우대 대출을 실행했습니다. 알프스 국가들은 계속해서 자연적인 고도 차라는 이점을 활용하고 있으며, 한편 영국의 캡 앤 플로어(Cap and Floor) 제도에 따라 글렌맥록(Glenmaclock) 및 코이어 글라스(Coia Glass)에서는 최종 투자 결정 준비가 완료되었습니다.
북미에서는 ‘인플레이션 억제법(Inflation Reduction Act)’에 힘입어 회복세를 보이고 있습니다. 이 법에 따라 양수 발전 시장은 30%의 투자 세액 공제(ITC) 대상이 되어, 배터리 저장 장치와 직접적으로 동등한 우대 조치를 받고 있습니다. 애리조나주, 오리건주, 애팔래치아 산맥을 가로지르는 39.5기가와트 규모의 프로젝트가 계획되어 있으며, 그중 3건은 이미 연방에너지규제위원회(FERC)의 승인을 받았습니다. 캐나다는 현대화에 주력하고 있으며, 온타리오 파워 제너레이션(Ontario Power Generation)사의 10억 달러 규모 프로그램은 노후화된 터빈을 개조함으로써 새로운 토목 공사를 진행하지 않고도 즉시 발전 용량을 늘릴 수 있음을 보여주고 있습니다.
기타 혜택:
- Excel 형식의 시장 예측(ME) 시트
- 3개월간의 애널리스트 지원
자주 묻는 질문
목차
제1장 서론
제2장 분석 방법
제3장 개요
제4장 시장 구도
제5장 시장 규모·성장률 예측
제6장 경쟁 구도
제7장 시장 기회와 향후 전망
KSA 26.09.07According to Mordor Intelligence, the pumped hydro storage market size was valued at 199 gigawatt in 2025 and estimated to grow from 213.99 gigawatt in 2026 to reach 300.66 gigawatt by 2031, at a CAGR of 7.03% during the forecast period (2026-2031).
This report is Segmented by Type (Open-Loop and Closed-Loop), Power Rating (Below 200 MW, 200-1, 000 MW, and Above 1, 000 MW), Reservoir Configuration (Surface-To-Surface and Surface-To-Underground), Application (Renewable Firming, Ancillary Grid Services, and Arbitrage and Peak Shaving), and Geography (North America, Europe, Asia-Pacific, South America, and Middle East and Africa).
Global Pumped Hydro Storage (PHS) Market Trends and Insights
Grid-scale renewable integration mandates drive deployment acceleration
Mandatory clean-energy targets are pushing utilities and state planners to expand the pumped hydro storage market, with China's pledge for 120 GW by 2030 exemplifying the policy-led build-out. The "PSH-plus" model links renewable clusters with adjacent storage, trimming curtailment, and easing grid expansion costs. Europe mirrors this through its Projects of Common Interest list, which features 12 storage schemes that enjoy streamlined permitting.Spain's EUR 700 million subsidy window further underlines national follow-through, providing clear revenue visibility that de-risks investor returns.
Repowering ageing hydro infrastructure unlocks latent capacity
Modernizing existing dams by adding reversible pump-turbines breathes new life into legacy assets without the land-use controversies of greenfield builds. The US Department of Energy's USD 430 million initiative to upgrade the domestic fleet demonstrates the scale of latent gains. Ontario Power Generation's USD 1 billion rehabilitation of eight stations adds 1,617 MW via higher-efficiency units, while Mexico's nine-plant refurbishments will raise annual output by 1,754 GWh and extend operational lives by five decades.
Lengthy environmental impact assessments constrain development timelines
Studies covering geology, biodiversity, and cultural heritage can take 5-10 years, adding cost overruns and permitting fatigue. Closed-loop schemes mitigate aquatic impacts, yet hydro-geological risks still demand case-specific reviews, as the Mineville filing in New York shows.
Other drivers and restraints analyzed in the detailed report include:
- Inflation Reduction Act incentives catalyze US market revival
- EU fast-track licensing streamlines strategic asset development
- High upfront CAPEX versus lithium-ion alternatives
For complete list of drivers and restraints, kindly check the Table Of Contents.
Segment Analysis
Closed-loop plants accounted for 53.40% of the pumped hydro storage market share in 2025 and are pacing at a 7.56% CAGR, largely because decoupling from rivers curtails aquatic disruption and speeds approvals. The Federal Energy Regulatory Commission now offers an accelerated two-year license solely for such projects, reinforcing their deployment advantage. Open-loop facilities retain a sizeable base but confront intensifying ecosystem scrutiny, especially where flow regulation or fish passage is contentious.
Closed-loop schemes also unlock new topographies, including disused mine pits and quarries, broadening the pumped hydro storage market's geographic reach. Lifecycle analyses show lower sedimentation risk and simpler de-watering processes, helping operators maintain high round-trip efficiencies for decades. In parallel, suppliers are refining variable-speed pump-turbines that fit purpose-built reservoirs and allow rapid mode changes, crucial for renewables balancing.
Plants between 200 MW and 1,000 MW delivered 45.20% of the pumped hydro storage market size in 2025 because they harmonize capital outlay with grid uptake limits. Regional operators such as Adani Green's 1,250 MW Uttar Pradesh project demonstrate how synchronized commissioning with transmission upgrades protects against congestion curtailment.
As distributed architectures emerge, installations below 200 MW record an 8.06% CAGR through 2031. Their lighter environmental footprint garners quicker local authority consent, and modular civil works lower schedule risk, fueling investor interest. Conversely, projects over 1,000 MW, while offering bulk inertia, confront longer lead times and heightened public scrutiny-witnessed by China's 3.6 GW Fengning build that demanded substantial ecological offsets.
Complete Report Scope:
- By Type
- Open-loop
- Closed-loop
- By Power Rating (MW)
- Below 200 MW
- 200 to 1,000 MW
- Above 1,000 MW
- By Reservoir Configuration
- Surface-to-Surface
- Surface-to-Underground
- By Application
- Renewable Firming
- Ancillary Grid Services
- Arbitrage & Peak Shaving
- By Geography
- North America
- United States
- Canada
- Mexico
- Europe
- Germany
- United Kingdom
- France
- Italy
- Spain
- Rest of Europe
- Asia Pacific
- China
- India
- Japan
- South Korea
- ASEAN Countries
- Rest of Asia Pacific
- South America
- Argentina
- Rest of South America
- Middle East and Africa
- Iran
- Morocco
- South Africa
- Rest of Middle East and Africa
- North America
Geography Analysis
Asia-Pacific held 48.40% of the pumped hydro storage market in 2025 and is posting a 8.85% CAGR owing to China's 50.94 GW installed base and an aggressive >300-plant pipeline. Beijing's planning regime integrates storage with renewable bases, minimizing curtailment and shaving grid reinforcement costs, while India's 103 GW technical potential remains largely untapped but is now primed for build-out after the release of supportive tariff guidelines.
Europe's pumped hydro storage market enjoys policy heft via the EU's €584 billion grid-modernization roadmap, which earmarks storage as a priority asset class. Institutional lenders like the European Investment Bank channel concessional loans-€108 million to Iberdrola in 2025-to refurbish and uprate Iberian plants, improving reservoir efficiency and adding peak capacity. Alpine nations continue to exploit natural elevation advantages, while the UK's cap-and-floor mechanism has readied Glenmuckloch and Coire Glas for final investment decisions.
North America is rebounding under the Inflation Reduction Act, which gives the pumped hydro storage market direct parity with batteries under a 30% ITC. A 39.5 GW pipeline traverses Arizona, Oregon, and the Appalachians, with three schemes already through the FERC gate. Canada focuses on modernization; Ontario Power Generation's USD 1 billion program illustrates how refurbishing ageing turbines can yield immediate incremental megawatts without new civil works.
- Operators
- Technology Providers
Additional Benefits:
- The market estimate (ME) sheet in Excel format
- 3 months of analyst support
TABLE OF CONTENTS
1 Introduction
- 1.1 Study Assumptions & Market Definition
- 1.2 Scope of the Study
2 Research Methodology
3 Executive Summary
4 Market Landscape
- 4.1 Market Overview
- 4.2 Market Drivers
- 4.2.1 Grid-scale renewable integration mandates
- 4.2.2 Repowering of ageing hydro dams with reversible units
- 4.2.3 Long-duration storage incentives in Inflation Reduction Act (USA)
- 4.2.4 Fast-track licensing in EU for strategic energy-storage assets
- 4.2.5 Co-location with floating solar to raise round-the-clock CF
- 4.2.6 Use of disused mines & quarries for low-impact closed-loop projects
- 4.3 Market Restraints
- 4.3.1 Lengthy environmental impact assessments
- 4.3.2 High upfront CAPEX vs. lithium-ion alternatives
- 4.3.3 Scarcity of suitable dual-reservoir topographies in urban centres
- 4.3.4 Grid tariff uncertainty for storage arbitrage revenues
- 4.4 Supply-Chain Analysis
- 4.5 Cost Analysis of Pumped-Hydro Energy-Storage Systems
- 4.6 Regulatory Landscape
- 4.7 Technological Outlook
- 4.8 Porter's Five Forces
- 4.8.1 Bargaining Power of Suppliers
- 4.8.2 Bargaining Power of Buyers
- 4.8.3 Threat of New Entrants
- 4.8.4 Threat of Substitutes
- 4.8.5 Intensity of Rivalry
5 Market Size & Growth Forecasts
- 5.1 By Type
- 5.1.1 Open-loop
- 5.1.2 Closed-loop
- 5.2 By Power Rating (MW)
- 5.2.1 Below 200 MW
- 5.2.2 200 to 1,000 MW
- 5.2.3 Above 1,000 MW
- 5.3 By Reservoir Configuration
- 5.3.1 Surface-to-Surface
- 5.3.2 Surface-to-Underground
- 5.4 By Application
- 5.4.1 Renewable Firming
- 5.4.2 Ancillary Grid Services
- 5.4.3 Arbitrage & Peak Shaving
- 5.5 By Geography
- 5.5.1 North America
- 5.5.1.1 United States
- 5.5.1.2 Canada
- 5.5.1.3 Mexico
- 5.5.2 Europe
- 5.5.2.1 Germany
- 5.5.2.2 United Kingdom
- 5.5.2.3 France
- 5.5.2.4 Italy
- 5.5.2.5 Spain
- 5.5.2.6 Rest of Europe
- 5.5.3 Asia Pacific
- 5.5.3.1 China
- 5.5.3.2 India
- 5.5.3.3 Japan
- 5.5.3.4 South Korea
- 5.5.3.5 ASEAN Countries
- 5.5.3.6 Rest of Asia Pacific
- 5.5.4 South America
- 5.5.4.1 Argentina
- 5.5.4.2 Rest of South America
- 5.5.5 Middle East and Africa
- 5.5.5.1 Iran
- 5.5.5.2 Morocco
- 5.5.5.3 South Africa
- 5.5.5.4 Rest of Middle East and Africa
- 5.5.1 North America
6 Competitive Landscape
- 6.1 Market Concentration
- 6.2 Strategic Moves (M&A, Partnerships, PPAs)
- 6.3 Market Share Analysis (Market Rank/Share for key companies)
- 6.4 Company Profiles (includes Global level Overview, Market level overview, Core Segments, Financials as available, Strategic Information, Products & Services, and Recent Developments)
- 6.4.1 Operators
- 6.4.1.1 Duke Energy Corporation
- 6.4.1.2 E.ON SE
- 6.4.1.3 Enel SpA
- 6.4.1.4 Electricite de France SA (EDF)
- 6.4.1.5 Iberdrola SA
- 6.4.1.6 China Three Gorges Corporation
- 6.4.1.7 Pacific Gas & Electric Company
- 6.4.1.8 Xcel Energy Inc.
- 6.4.1.9 AGL Energy Ltd
- 6.4.1.10 Statkraft AS
- 6.4.2 Technology Providers
- 6.4.2.1 General Electric Company
- 6.4.2.2 Siemens AG
- 6.4.2.3 Andritz AG
- 6.4.2.4 Mitsubishi Heavy Industries Ltd
- 6.4.2.5 Voith GmbH & Co. KGaA
- 6.4.2.6 Ansaldo Energia SpA
- 6.4.2.7 Toshiba Energy Systems & Solutions
- 6.4.2.8 Hitachi Energy Ltd
- 6.4.2.9 Kossler GmbH
- 6.4.2.10 Hyosung Heavy Industries Co., Ltd
- 6.4.1 Operators
7 Market Opportunities & Future Outlook
- 7.1 White-space & Unmet-Need Assessment


