|
시장보고서
상품코드
2122505
애플리케이션 딜리버리 컨트롤러(ADC) : 시장 점유율 분석, 업계 동향 및 통계, 성장 예측(2026-2031년)Application Delivery Controllers (ADC) - Market Share Analysis, Industry Trends & Statistics, Growth Forecasts (2026 - 2031) |
||||||
 Mordor Intelligence
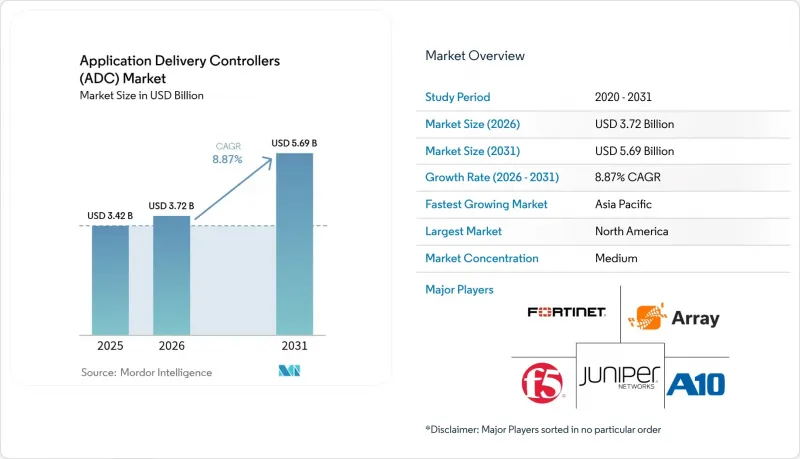
Mordor Intelligence에 의하면, 애플리케이션 딜리버리 컨트롤러(ADC) 시장 규모는 2026년에 37억 2,000만 달러로 추정되고 2025년 34억 2,000만 달러에서 확대해, 2031년에는 56억 9,000만 달러에 이를 것으로 예측됩니다.
2026년부터 2031년에 걸쳐 연평균 성장률(CAGR) 8.87%로 성장할 것으로 전망됩니다.

본 보고서는 유형별(하드웨어 기반 ADC, 가상/소프트웨어 ADC), 배포 방식별(On-Premise, 클라우드 관리/호스팅형),구성 요소별(솔루션(제어, 가속화, 보안), 서비스(통합, 관리형, 교육)), 기업 규모별(대기업, 중소기업), 최종 사용자 산업별(IT 및 통신, 은행, 금융서비스 및 보험(BFSI), 기타), 지역별로 분류되어 있습니다. 시장 예측은 금액(달러) 기준으로 제시되어 있습니다.
세계의 애플리케이션 딜리버리 컨트롤러(ADC) 시장 동향 및 인사이트
클라우드 네이티브 및 마이크로서비스 아키텍처로의 전환
기업 워크로드의 절반 이상은 이미 컨테이너화되거나 서버리스 구성 요소로 실행되고 있으며, 이로 인해 애플리케이션 딜리버리 컨트롤러(ADC) 시장은 쿠버네티스 클러스터나 서비스 메쉬 내에 배치되는 경량 API 중심의 폼 팩터로 전환을 요구받고 있습니다. 이러한 마이크로 게이트웨이는 현대 용도의 일시적인 특성에 부합하는 세밀한 트래픽 제어, 상호 TLS 종단 및 자동 확장 기능을 통합하고 있습니다. 각 벤더는 동서 방향의 서비스 호출로 인해 발생하는 보안 허점을 메우기 위해 스키마 인식형 API 방화벽과 분산형 속도 제한기를 통합하고 있습니다. CIO들이 플랫폼 엔지니어링을 추진함에 따라, 선언형 ‘ADC-as-code’는 GitOps 파이프라인과 원활하게 통합되어 개발(Dev)과 네트워크 운영(NetOps) 간의 인계 작업을 줄이고 있습니다.
데이터센터 내 이스트-웨스트 트래픽의 급격한 증가
가상 서버의 고밀도화로 인해 내부 트래픽이 두 배로 증가하여 기존의 노스-사우스형 트래픽 패턴을 능가하고, 지연 시간에 민감한 마이크로 트랜잭션이 증가하고 있습니다. 분산형 ADC 인스턴스는 워크로드 포드 근처에 배치되어 병목 현상을 일으키지 않으면서 광범위한 텔레메트리 및 인라인 복호화를 제공합니다. 금융 거래소, 통신 사업자, 게임 제공업체는 수천 개의 경량 프록시를 배포하고 있으며, 이들은 서로 연동하여 레이어 7 정책을 적용하는 동시에 버스트형 리소스 풀에도 적응하고 있습니다.
복잡한 레이어 7 정책 구성이 IT 운영에 부담을 가중시킵니다.
기업 팀은 각각 고유한 라우팅, 재작성 또는 WAF 로직이 필요한 수백 개의 이기종 용도를 처리해야 합니다. 멀티 클라우드 환경 전반에 걸쳐 정확성을 유지하는 것은 제한된 DevSecOps 인력에 부담을 주고, ADC의 광범위한 배포를 지연시킬 가능성이 있습니다. 벤더들은 인텐트 기반 템플릿, AI를 활용한 규칙 생성, 시각적인 종속성 맵 등으로 대응하고 있지만, 기술 격차는 여전히 남아 있습니다.
부문별 분석
2025년, 애플리케이션 딜리버리 컨트롤러(ADC) 시장의 58.35%를 하드웨어 어플라이언스가 차지했으며, 이는 전용 SSL 오프로드 칩과 결정적인 처리량에 의해 뒷받침되고 있습니다. 그러나 DevOps 팀이 ADC 이미지를 CI/CD 파이프라인에 직접 통합함으로써 랙 점유 공간을 줄이고 도입 기간을 단축하고 있기 때문에 가상 부문은 연평균 성장률(CAGR) 14.12%로 확대되고 있습니다. 가상 솔루션을 위한 애플리케이션 딜리버리 컨트롤러(ADC) 시장 규모는 컨테이너 채택 확대에 따라 급증할 것으로 예상되며, 이는 미션 크리티컬 계층에서 하드웨어의 우위를 위협하게 될 것입니다.
성숙한 벤더들은 정책 엔진을 계승하면서도 어플라이언스의 오버헤드를 제거한 컨테이너 네이티브 프록시를 출시함으로써 이러한 동향에 대응하고 있습니다. 비용 투명성에 더해, 클라우드 마켓플레이스를 통한 과금 체계는 애자일 팀에게 매력적이며, 기존 기업 내에서도 소프트웨어의 점유율 확대를 뒷받침하고 있습니다. TLS 1.3 및 QUIC의 채택이 확대됨에 따라 코드 수준의 민첩성이 소프트웨어 방식 선택을 더욱 촉진하겠지만, 금융 및 통신의 코어 네트워크에서 초고 TPS 게이트웨이의 경우 하드웨어가 계속 사용될 전망입니다.
2025년에도 On-Premise형 인스턴스는 애플리케이션 딜리버리 컨트롤러(ADC) 시장 규모의 63.25%를 계속 차지했으며, 데이터 주권 의무를 지는 업계로부터 지지를 받고 있습니다. 통합된 위협 분석 모듈과 ‘사용량 확대에 따른 라이선싱’ 방식의 용량 라이선스를 통해 대규모 시스템 업데이트 없이도 레거시 환경을 혁신할 수 있게 되었습니다.
반면, 클라우드 관리형 모델은 연평균 성장률(CAGR) 14.68%로 성장하고 있는데, 이는 플랫폼 팀이 패치 적용, 확장, 텔레메트리 등을 벤더가 운영하는 제어 플레인에 맡기고 있기 때문입니다. 다중 리전 배포는 몇 시간 만에 완료되며, 통일된 API 정책 적용을 통해 사이트 수준의 불일치가 해소되므로 디지털 네이티브 기업에게 바람직한 선택지가 되고 있습니다. 애플리케이션 딜리버리 컨트롤러(ADC) 시장에서는 단일 콘솔에서 하드웨어, 가상, SaaS 엔드포인트를 구성할 수 있는 하이브리드 대시보드를 통해 이러한 모드를 지속적으로 융합하고 있습니다.
지역별 분석
북미는 2025년, 하이퍼스케일러의 생태계와 통합된 보안 요구 사항을 강화하는 엄격한 데이터 개인정보 보호 규제의 뒷받침을 받아 애플리케이션 딜리버리 컨트롤러(ADC) 시장의 33.70%를 계속 차지했습니다. F5가 수백 개의 Citrix NetScaler 환경을 대체했다고 보도된 것과 같은 통합 움직임은 성숙한 고객 기반에서 교체 현상이 일어나고 있음을 보여줍니다.
아시아태평양은 5G 구축 및 인더스트리 4.0 이니셔티브가 공장 및 스마트 시티 전반에 걸쳐 저지연·멀티테넌트형 ADC 패브릭에 대한 수요를 자극하여 12.35%라는 가장 높은 연평균 성장률(CAGR)을 기록하고 있습니다. 중국과 인도의 정부 주도 클라우드 프로그램에서는 ADC 기능이 소버린 클라우드에 통합되어 있어 현지 벤더와의 제휴를 촉진하고 있습니다.
유럽에서는 On-Premise와 클라우드 도입이 균형을 이루고 있으며, 은행 및 핀테크 기업의 시스템 업그레이드에 영향을 미치는 DORA(데이터 보호법) 준수 기한이 이러한 추세를 뒷받침하고 있습니다. 규제 당국의 데이터 거주지 중시는 정책 주도형 위치 제한(location fencing)에 대한 수요를 불러일으키고 있습니다.
중동 및 아프리카에서는 3조 7,000억 달러 규모의 메가 프로젝트 건설, IoT를 활용한 유틸리티, 전국 규모의 디지털 정부 포털을 뒷받침하는 인프라로서 ADC가 활용되고 있습니다. 하이브리드 모델은 성능 요구 사항과 해당 지역의 데이터센터 설치 공간이 제한적이라는 과제 모두를 충족시키고 있습니다.
남미에서는 금융 서비스의 현대화와 소매 전자상거래의 확대가 도입 증가를 뒷받침하고 있으며, 경제 변동 속에서 자본 제약을 피하기 위해 클라우드 기반 ADC가 선호되고 있습니다.
기타 혜택 :
- 엑셀 형식 시장 예측(ME) 시트
- 3개월간의 애널리스트 지원
자주 묻는 질문
목차
제1장 서론
제2장 조사 방법
제3장 주요 요약
제4장 시장 구도
제5장 시장 규모 및 성장 예측
제6장 경쟁 구도
제7장 시장 기회 및 향후 전망
KTH 26.09.08According to Mordor Intelligence, application delivery controllers market size in 2026 is estimated at USD 3.72 billion, growing from 2025 value of USD 3.42 billion with 2031 projections showing USD 5.69 billion, growing at 8.87% CAGR over 2026-2031.
This report is Segmented by Type (Hardware-Based ADC, Virtual/Software ADC), Deployment (On-Premise, Cloud-Managed/Hosted), Component (Solutions (Control, Acceleration, Security), Services (Integration, Managed, Training)), Enterprise Size (Large Enterprises, Smes), End-User Vertical (IT and Telecom, BFSI, and More), Geography. The Market Forecasts are Provided in Terms of Value (USD).
Global Application Delivery Controllers (ADC) Market Trends and Insights
Shift Toward Cloud-Native And Microservices Architecture
More than half of enterprise workloads already run as containerized or serverless components, forcing the application delivery controllers market to pivot toward lightweight, API-centric form factors that sit inside Kubernetes clusters and service meshes. These micro-gateways inject granular traffic steering, mutual-TLS termination, and automated scaling hooks that match the ephemeral nature of modern applications . Vendors are embedding schema-aware API firewalls and distributed rate-limiters to close security gaps opened by east-west service calls. As CIOs push for platform engineering, declarative "ADC-as-code" integrates seamlessly with GitOps pipelines, reducing hand-offs between Dev and NetOps.
Exponential East-West Data-Center Traffic Growth
Virtual server density has multiplied internal flows, outpacing traditional north-south patterns and elevating latency-sensitive micro-transactions. Distributed ADC instances now sit closer to workload pods, providing pervasive telemetry and inline decryption without introducing bottlenecks . Financial exchanges, telcos, and gaming providers deploy thousands of lightweight proxies that collectively enforce Layer-7 policies yet adapt to bursty resource pools.
Complex Layer-7 Policy Configuration Burdens IT Ops
Enterprise teams confront hundreds of heterogeneous applications, each demanding bespoke routing, rewrite, or WAF logic. Maintaining accuracy across multi-cloud estates strains scarce DevSecOps talent and can stall broader ADC roll-outs. Vendors answer with intent-based templates, AI-assisted rule creation, and visual dependency maps, yet skill gaps persist.
Other drivers and restraints analyzed in the detailed report include:
- Regulatory Mandates for Secure Digital Banking
- Growing 5G Roll-outs Driving Edge ADC Adoption
- Cost Inflation of Advanced ADC Licensing Models
For complete list of drivers and restraints, kindly check the Table Of Contents.
Segment Analysis
Hardware appliances represented 58.35% of the application delivery controllers market in 2025, supported by specialized SSL offload chips and deterministic throughput. Yet the virtual segment is scaling at 14.12% CAGR as DevOps teams embed ADC images directly into CI/CD pipelines, reducing rack footprint and accelerating rollout windows. The application delivery controllers market size for virtual solutions is forecast to surge alongside container adoption, challenging hardware's grip on mission-critical tiers.
Mature vendors hedge by releasing container-native proxies that inherit their policy engines while shedding appliance overhead. Cost transparency plus cloud marketplace billing appeal to agile teams, driving incremental share gains for software even inside traditional enterprises. As TLS 1.3 and QUIC adoption climb, code-level agility will further tilt decisions toward software form factors, though hardware will persist for ultra-high TPS gateways in finance and telecom cores.
On-premise instances still command 63.25% of the application delivery controllers market size in 2025, favored by sectors bound to data-sovereignty mandates. Integrated threat analytics modules and pay-as-you-grow capacity licensing now refresh legacy estates without forklift replacements .
Conversely, the cloud-managed model rises at 14.68% CAGR as platform teams offload patching, scaling, and telemetry to vendor-operated control planes. Multi-region rollouts complete in hours, and unified API policy enforcement eliminates site-level drift, making it the preferred path for digital-native firms. The application delivery controllers market continues to blend these modes through hybrid dashboards that configure hardware, virtual, and SaaS endpoints from a single console.
Complete Report Scope:
- By Type
- Hardware-Based ADC
- Virtual/Software ADC
- By Deployment
- On-premise
- Cloud-Managed/Hosted
- By Component
- Solutions (Control, Acceleration, Security)
- Services (Integration, Managed, Training)
- By Enterprise Size
- Large Enterprises
- Small and Medium Enterprises (SMEs)
- By End-user Vertical
- IT and Telecom
- BFSI
- Retail and E-commerce
- Healthcare and Life Sciences
- Government and Public Sector
- Manufacturing and Industrial 4.0
- Media and Entertainment
- Energy and Utilities
- By Geography
- North America
- United States
- Canada
- Mexico
- South America
- Brazil
- Argentina
- Chile
- Peru
- Rest of South America
- Europe
- Germany
- United Kingdom
- France
- Italy
- Spain
- Rest of Europe
- Asia-Pacific
- China
- Japan
- South Korea
- India
- Australia
- New Zealand
- Rest of Asia-Pacific
- Middle East and Africa
- United Arab Emirates
- Saudi Arabia
- Turkey
- South Africa
- Rest of Middle East and Africa
- North America
Geography Analysis
North America retained 33.70% of the application delivery controllers market in 2025, buoyed by hyperscaler ecosystems and stringent data-privacy regulations that elevate integrated security requirements. Consolidation plays, such as F5's reported displacement of hundreds of Citrix NetScaler estates, demonstrate churn within mature accounts.
Asia-Pacific delivers the steepest 12.35% CAGR as 5G rollouts and Industry 4.0 agendas spur demand for low-latency, multi-tenant ADC fabrics across factories and smart cities. Government cloud programs in China and India embed ADC functionality inside sovereign clouds, driving local vendor partnerships.
Europe balances on-prem and cloud adoption, reinforced by DORA compliance deadlines influencing bank and fintech upgrades. Regulators' focus on data residency fuels demand for policy-driven location fencing.
Middle East and Africa tap ADCs to underpin USD 3.7 trillion in megaproject construction, IoT-enabled utilities, and nationwide digital-government portals. Hybrid models satisfy both performance needs and limited regional data-center footprints.
South America's financial-services modernization and retail e-commerce spur incremental uptake, with cloud-based ADCs preferred to circumvent capital constraints amid economic volatility.
- F5 Networks Inc.
- NetScaler (Citrix Systems)
- Fortinet Inc.
- A10 Networks Inc.
- Array Networks Inc.
- Radware Ltd.
- Akamai Technologies Inc.
- Cisco Systems Inc.
- Barracuda Networks Inc.
- HAProxy Technologies LLC
- Kemp Technologies (Progress Software)
- Loadbalancer.org Inc.
- Cloudflare Inc.
- Dell Technologies Inc.
- Amazon Web Services (ALB / NLB)
- Microsoft Azure (Application Gateway)
- Alibaba Cloud (Global Server Load Balancer)
- Piolink Inc.
- Sangfor Technologies Inc.
- NGINX Inc. (F5)
Additional Benefits:
- The market estimate (ME) sheet in Excel format
- 3 months of analyst support
TABLE OF CONTENTS
1 INTRODUCTION
- 1.1 Study Assumptions and Market Definition
- 1.2 Scope of the Study
2 RESEARCH METHODOLOGY
3 EXECUTIVE SUMMARY
4 MARKET LANDSCAPE
- 4.1 Market Overview
- 4.2 Market Drivers
- 4.2.1 Shift Toward Cloud-Native and Microservices Architecture
- 4.2.2 Exponential East-West Data-Center Traffic Growth
- 4.2.3 Regulatory Mandates for Secure Digital Banking in North America and EU
- 4.2.4 Growing 5G Roll-outs Driving Edge ADC Adoption in Asia
- 4.2.5 Rising Multi-Cloud and Hybrid IT Strategies among Global 2000
- 4.3 Market Restraints
- 4.3.1 Complex Layer-7 Policy Configuration Burdens IT Ops
- 4.3.2 Cost Inflation of Advanced ADC Licensing Models
- 4.3.3 Commoditization of Basic Load-Balancing Features
- 4.3.4 Shortage of Skilled NetOps and DevSecOps Talent
- 4.4 Technological Outlook
- 4.5 Porter's Five Forces Analysis
- 4.5.1 Bargaining Power of Suppliers
- 4.5.2 Bargaining Power of Buyers
- 4.5.3 Threat of New Entrants
- 4.5.4 Threat of Substitutes
- 4.5.5 Intensity of Competitive Rivalry
- 4.6 Assessment of Macroeconomic Factors Impact on the Industry
5 MARKET SIZE AND GROWTH FORECASTS (VALUE)
- 5.1 By Type
- 5.1.1 Hardware-Based ADC
- 5.1.2 Virtual/Software ADC
- 5.2 By Deployment
- 5.2.1 On-premise
- 5.2.2 Cloud-Managed/Hosted
- 5.3 By Component
- 5.3.1 Solutions (Control, Acceleration, Security)
- 5.3.2 Services (Integration, Managed, Training)
- 5.4 By Enterprise Size
- 5.4.1 Large Enterprises
- 5.4.2 Small and Medium Enterprises (SMEs)
- 5.5 By End-user Vertical
- 5.5.1 IT and Telecom
- 5.5.2 BFSI
- 5.5.3 Retail and E-commerce
- 5.5.4 Healthcare and Life Sciences
- 5.5.5 Government and Public Sector
- 5.5.6 Manufacturing and Industrial 4.0
- 5.5.7 Media and Entertainment
- 5.5.8 Energy and Utilities
- 5.6 By Geography
- 5.6.1 North America
- 5.6.1.1 United States
- 5.6.1.2 Canada
- 5.6.1.3 Mexico
- 5.6.2 South America
- 5.6.2.1 Brazil
- 5.6.2.2 Argentina
- 5.6.2.3 Chile
- 5.6.2.4 Peru
- 5.6.2.5 Rest of South America
- 5.6.3 Europe
- 5.6.3.1 Germany
- 5.6.3.2 United Kingdom
- 5.6.3.3 France
- 5.6.3.4 Italy
- 5.6.3.5 Spain
- 5.6.3.6 Rest of Europe
- 5.6.4 Asia-Pacific
- 5.6.4.1 China
- 5.6.4.2 Japan
- 5.6.4.3 South Korea
- 5.6.4.4 India
- 5.6.4.5 Australia
- 5.6.4.6 New Zealand
- 5.6.4.7 Rest of Asia-Pacific
- 5.6.5 Middle East and Africa
- 5.6.5.1 United Arab Emirates
- 5.6.5.2 Saudi Arabia
- 5.6.5.3 Turkey
- 5.6.5.4 South Africa
- 5.6.5.5 Rest of Middle East and Africa
- 5.6.1 North America
6 COMPETITIVE LANDSCAPE
- 6.1 Strategic Developments
- 6.2 Vendor Positioning Analysis
- 6.3 Company Profiles (includes Global level Overview, Market level overview, Core Segments, Financials as available, Strategic Information, Products and Services, and Recent Developments)
- 6.3.1 F5 Networks Inc.
- 6.3.2 NetScaler (Citrix Systems)
- 6.3.3 Fortinet Inc.
- 6.3.4 A10 Networks Inc.
- 6.3.5 Array Networks Inc.
- 6.3.6 Radware Ltd.
- 6.3.7 Akamai Technologies Inc.
- 6.3.8 Cisco Systems Inc.
- 6.3.9 Barracuda Networks Inc.
- 6.3.10 HAProxy Technologies LLC
- 6.3.11 Kemp Technologies (Progress Software)
- 6.3.12 Loadbalancer.org Inc.
- 6.3.13 Cloudflare Inc.
- 6.3.14 Dell Technologies Inc.
- 6.3.15 Amazon Web Services (ALB / NLB)
- 6.3.16 Microsoft Azure (Application Gateway)
- 6.3.17 Alibaba Cloud (Global Server Load Balancer)
- 6.3.18 Piolink Inc.
- 6.3.19 Sangfor Technologies Inc.
- 6.3.20 NGINX Inc. (F5)
7 MARKET OPPORTUNITIES AND FUTURE OUTLOOK
- 7.1 White-space and Unmet-Need Assessment