
|
시장보고서
상품코드
2122517
엣지 분석 : 시장 점유율 분석, 업계 동향과 통계, 성장 예측(2026-2031년)Edge Analytics - Market Share Analysis, Industry Trends & Statistics, Growth Forecasts (2026 - 2031) |
||||||
 Mordor Intelligence
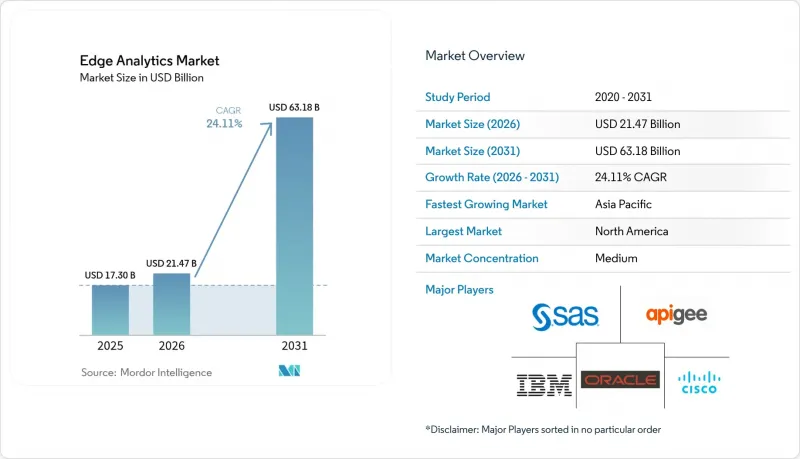
Mordor Intelligence에 의하면, 엣지 분석 시장 규모는 2025년 173억 달러에서 2026년에는 214억 7,000만 달러로 성장하고, 2026-2031년 CAGR 24.11%로 성장하여 2031년에는 631억 8,000만 달러에 달할 것으로 예측됩니다.
본 보고서에서는 업계를 ‘구축 형태(On-Premise 및 클라우드)’, ‘구성 요소(솔루션 및 서비스)’, ‘기술(기술적 분석, 진단적 분석, 예측적 분석, 처방적 분석)’, ‘최종 사용자 산업(은행, 금융서비스 및 보험(BFSI), IT 및 통신, 제조, 의료, 소매, 기타)’, 그리고 ‘지역’별로 분류하고 있습니다.
세계 엣지 분석 시장 동향 및 인사이트
IoT 엔드포인트의 급증
세계의 기기들은 매일 3억 2,877만 TB의 데이터를 생성하고 있으며, 대역폭을 절약하고 실시간으로 인사이트를 얻기 위해 분석 처리를 로컬로 이전할 수밖에 없는 상황입니다. 현재 산업 플랜트에서는 수백만 개의 센서에서 진동 및 온도 측정값이 스트리밍되고 있으며, 최적화된 모델을 실행하는 엣지 가속기가 10밀리초 미만의 지연 시간으로 이 데이터 유입을 처리하고 있습니다. 예지 보전의 적용 범위가 중장비에서 의료용 웨어러블 기기로 확대됨에 따라, 엣지 분석 시장은 운영상의 입지를 강화하며 기업의 데이터 전략에서 필수적인 요소로 자리 잡고 있습니다.
초저지연 분석에 대한 수요
자율형 로봇, 원격 수술 장치, 충돌 회피 시스템에서는 5밀리초 이내의 의사 결정이 요구되지만, 패킷이 멀리 떨어진 클라우드를 경유할 경우 이 목표를 달성하는 것은 불가능합니다. 엣지 분석은 50-150밀리초의 왕복 지연을 제거하여 미션 크리티컬한 장애의 위험을 줄여줍니다. 결함 감지 알고리즘을 지역 데이터센터에서 현장 노드로 이전한 제조업체는 두 자릿수의 수율 향상을 보고하고 있으며, 이는 분산형 인텔리전스의 비즈니스적 유효성을 입증하고 있습니다.
뿌리 깊은 데이터 보안 및 데이터 주권 위험
각 엣지 게이트웨이는 공격자가 물리적 접근이나 패치가 적용되지 않은 펌웨어를 통해 악용할 수 있는 공격 표면을 생성합니다. 금융 및 의료 분야의 사업자는 지역별 데이터 상주 요건도 준수해야 하므로, 이에 따라 트래픽을 종단 간(end-to-end)으로 암호화하는 신뢰 실행 환경(TEE) 및 제로 트러스트 오버레이의 도입이 진행되고 있습니다.
부문 분석
처방형 엔진은 엣지 분석 시장에서 가장 빠르게 성장하는 부문으로, 연평균 성장률(CAGR)은 24.63%로 성장을 지속하고, 있습니다. 이 엔진은 기본적인 기술적 시각화에 의사결정 자동화 기능을 더해, 이상 현상이 감지되었을 때 취해야 할 최선의 조치를 권장합니다. 2025년에도 기술형 모듈은 여전히 매출의 38.55%를 차지했지만, 사용자 수요는 생산성을 높이고 위험을 최소화하는 고차원적인 인사이트로 분명히 이동하고 있습니다. 현재 엣지 디바이스에는 로봇 공학의 경로 계획을 현장에서 최적화하는 소형 강화 학습 에이전트가 탑재되어 있어, 이러한 전환을 뒷받침하는 상업적 수요가 높음을 엿볼 수 있습니다.
예측 알고리즘은 현재의 대시보드와 완전한 자동화 사이의 가교 역할을 계속하고 있습니다. 이러한 알고리즘은 급격한 온도 상승이나 트래픽 급증을 상호 연관시킴으로써 유지보수 기간이나 재고 수요를 예측할 수 있게 합니다. 진단 분석은 규모는 작지만 재발 방지를 위한 근본 원인 규명에 기여하고 있습니다. 이러한 스택을 결합함으로써 벤더는 계층화된 서비스 패키지를 제공할 수 있게 되었으며, 기술형 대시보드를 진입점으로 삼아 프리미엄 가입자를 대상으로 처방형 애드온을 단계적으로 추가하고 있습니다. 그 결과, 엣지 분석 업계는 성과 기반 계약으로 성숙해 가고 있습니다.
2025년 시점에서 On-Premise형 노드는 엣지 분석 시장 규모의 55.23%를 차지했습니다. 이는 개인 식별 정보나 국가 안보 관련 정보를 외부로 반출할 수 없는 데이터에 민감한 산업 분야에서 여전히 최우선 선택지로 남아 있습니다. 예를 들어, 병원 네트워크에서는 방사선과 의사가 외부 링크를 거치지 않고 스캔 이미지에 접근할 수 있도록 병원 내에 이미지 서버를 설치하고 있습니다. 그러나 클라우드 관리형 엣지는 더욱 빠르게 확대되고 있으며, 공급자가 거주지 관련 규제를 충족하는 지역 구역을 구축함에 따라 2031년까지 연평균 성장률(CAGR) 26.79%를 기록할 전망입니다.
하이브리드 토폴로지가 장기적인 표준으로 부상하고 있습니다. 기밀성이 높은 워크로드는 로컬에서 추론을 수행하는 반면, 배치 처리를 통한 동향 분석은 야간에 중앙 집중식으로 관리되는 클라우드에서 실행됩니다. 중앙 콘솔은 컨테이너 업데이트를 푸시하고, 정책을 통일하며, 경영진을 위한 대시보드에 사용할 집계된 인사이트를 수집함으로써 민첩성을 저해하지 않으면서 제어를 실현합니다. 이러한 구성을 통해 인프라 중복을 줄이고 데이터 발생원 근처에 컴퓨팅 리소스를 유지할 수 있으므로, 예산 및 규정 준수 목표를 모두 충족할 수 있습니다.
지역별 분석
북미는 성숙한 하이퍼스케일 데이터센터의 구축과 조기 5G 수익화 전략을 통해 2025년에는 매출의 42.55%를 차지하며 계속해서 주도적인 위치를 유지했습니다. 통신 사업자들은 2차 대도시권으로 서비스 제공 범위를 확대하여 소매업체들이 교외 매장 근처에 마이크로 데이터센터를 설치할 수 있도록 했습니다. 정부의 인센티브에 힘입어 제조업체들은 스마트 팩토리 프로그램 도입을 촉진하고, 생산 라인의 에지에 AI 기반 공정 제어를 통합했습니다. 개인정보 보호 관련 규제는 암호화 및 감사 추적이 업계 기준을 충족하는 한, 혁신에 대해 여전히 관대한 태도를 보이고 있습니다. 정책의 명확화로 조달 주기가 단축되어 의료, 소매, 에너지 분야의 안정적인 수요를 뒷받침하고 있습니다.
아시아태평양은 가장 빠르게 성장하는 지역으로, 2026년부터 2031년까지 연평균 성장률(CAGR) 26.07%를 나타낼 것으로 예측됩니다. 중국에서는 스마트 신호등과 산업용 로봇에서 발생하는 센서 데이터를 수집하는 성(省) 단위의 에지 시설이 확대되고 있습니다. 일본의 주요 자동차 제조업체들은 수리 비용을 절감하는 예측형 품질 관리 루프를 도입하고 있는 반면, 인도의 이동통신 사업자들은 새로운 주파수 대역을 활용하여 물류 단지를 위한 전용 5G 캠퍼스를 구축하고 있습니다. 국경을 넘는 데이터 흐름에 대한 규제 입장이 다양하기 때문에 다국적 기업들은 현지화된 도입을 강요받고 있으며, 벤더 종속을 피하기 위해 오픈소스 스택을 채택하는 경우가 늘고 있습니다. 국내 반도체 팹에 대한 투자는 자립적인 지역 공급망을 더욱 뒷받침하며, 엣지 프로젝트에 회복력을 더하고 있습니다.
유럽에서는 GDPR(EU 개인정보보호규정) 및 제안된 AI 책임법에 따라 견실하면서도 신중한 도입이 진행되고 있습니다. 독일은 ‘인더스트리 4.0’ 프로젝트의 선구자로서, 기존 공장에 OPC UA 게이트웨이 및 컨테이너화된 추론 기능을 도입하여 혁신과 리스크 거버넌스의 균형을 맞추고 있습니다. 프랑스는 스마트 교통 시범 사업을 주도하고 있으며, 도로변 장치에 의한 실시간 영상 분석을 통해 공공 안전에 대한 대응 시간을 단축하고 있습니다. 북유럽의 통신 사업자들은 ESG 요건을 준수하기 위해 그린 수소를 동력원으로 하는 엣지 사이트를 설치하는 것을 우선시하고 있습니다. 표준화 단체들은 시큐어 부트, 원격 인증, 데이터 교환 프레임워크에 대해 협력하며, 보다 광범위한 엣지 분석 시장에 이익이 되는 상호 운용성의 정신을 함양하고 있습니다.
기타 혜택:
- 엑셀 형식 시장 예측(ME) 시트
- 3개월간의 애널리스트 지원
자주 묻는 질문
목차
제1장 서론
제2장 조사 방법
제3장 주요 요약
제4장 시장 구도
제5장 시장 세분화
제6장 경쟁 구도
제7장 시장 기회와 향후 전망
LSH 26.09.03According to Mordor Intelligence, the edge analytics market size is expected to grow from USD 17.30 billion in 2025 to USD 21.47 billion in 2026 and is forecast to reach USD 63.18 billion by 2031 at 24.11% CAGR over 2026-2031.
This report Segments the Industry Into by Deployment Type (On-Premises, and Cloud), Component (Solutions, and Services), Technology (Descriptive Analytics, Diagnostic Analytics, Predictive Analytics, and Prescriptive Analytics), End User Industry (BFSI, IT and Telecommunication, Manufacturing, Healthcare, Retail, and Others), and Geography.
Global Edge Analytics Market Trends and Insights
Proliferation of IoT end-points
The global device base is generating 328.77 million TB of data every day, forcing analytics to migrate toward local processing so that bandwidth is conserved and insights arrive in real time. Industrial plants now stream vibration and temperature metrics from millions of sensors, and edge accelerators running optimized models handle this influx with sub-10 ms latency. As predictive maintenance checks extend from heavy machinery to medical wearables, the edge analytics market gains a larger operational footprint and becomes an indispensable layer in enterprise data strategy.
Demand for ultra-low-latency analytics
Autonomous robots, tele-surgery rigs, and collision-avoidance systems need decisions within 5 ms, a target unattainable when packets traverse distant clouds. Edge analytics eliminates the 50-150 ms round-trip and lowers the risk of mission-critical failures. Manufacturers that moved defect-detection algorithms from regional data centers to on-site nodes report double-digit yield improvements, reinforcing the business case for distributed intelligence.
Persistent data-security & sovereignty risks
Each edge gateway introduces an attack surface that adversaries can exploit through physical access or unpatched firmware. Finance and healthcare operators must also align with location-based data residency mandates, prompting adoption of trusted execution environments and zero-trust overlays that encrypt traffic end-to-end.
Other drivers and restraints analyzed in the detailed report include:
- Rapid 5G roll-out unlocking edge use-cases
- Cloud-native toolchains simplifying edge deployments
- Integration complexity with brownfield OT systems
For complete list of drivers and restraints, kindly check the Table Of Contents.
Segment Analysis
Prescriptive engines are the fastest-advancing layer in the edge analytics market, growing at a 24.63% CAGR. They add decision automation to basic descriptive visibility, recommending the next best action once anomalies are detected. In 2025, descriptive modules still held 38.55% of revenue, but user demand has clearly pivoted toward higher-order insights that lift output and minimize risk. Edge devices now host compact reinforcement-learning agents that optimize robotics pathing on the fly, illustrating the commercial pull behind the transition.
Predictive algorithms remain a bridge between current dashboards and full automation. They enable forecast maintenance windows and inventory needs by correlating temperature spikes or traffic surges. Diagnostic analytics, though smaller, supplies root-cause clarity that prevents recurrence. Together these stacks help vendors package tiered offerings, embedding descriptive dashboards as entry points and layering prescriptive add-ons for premium subscribers. In turn, the edge analytics industry continues to mature toward outcome-based contracting.
On-premises nodes accounted for 55.23% of the edge analytics market size in 2025. They remain the first choice for data-sensitive sectors that cannot export personally identifiable or national-security information. Hospital networks, for instance, maintain imaging servers in-house so radiologists access scans without traversing external links. However, cloud-managed edges are scaling quicker, charting a 26.79% CAGR to 2031 as providers launch regional zones that meet residency rules.
Hybrid topology is emerging as the long-term norm. Sensitive workloads infer locally while batch trend analytics run in centralized clouds overnight. Central consoles push container updates, harmonize policy, and collect aggregated insights for executive dashboards, thereby delivering control without sacrificing agility. The arrangement reduces infrastructure duplication and keeps compute near data origin, aligning with both budget and compliance targets.
Complete Report Scope:
- By Deployment Type
- On-Premises
- Cloud
- By Component
- Solutions
- Services
- By End-User Industry
- BFSI
- IT & Telecommunication
- Manufacturing
- Healthcare
- Retail
- Others
- By Technology
- Descriptive Analytics
- Diagnostic Analytics
- Predictive Analytics
- Prescriptive Analytics
- By Geography
- North America
- United States
- Canada
- Mexico
- South America
- Brazil
- Argentina
- Rest of South America
- Europe
- United Kingdom
- Germany
- France
- Italy
- Spain
- Nordics
- Rest of Europe
- Middle East and Africa
- Middle East
- Saudi Arabia
- United Arab Emirates
- Turkey
- Rest of Middle East
- Africa
- South Africa
- Egypt
- Nigeria
- Rest of Africa
- Middle East
- Asia-Pacific
- China
- India
- Japan
- South Korea
- ASEAN
- Australia
- New Zealand
- Rest of Asia-Pacific
- North America
Geography Analysis
North America retained leadership with 42.55% revenue in 2025 thanks to a mature hyperscale data-center footprint and early 5G monetization strategies. Telcos widened coverage to secondary metros, letting retailers place micro-data centers closer to suburban stores. Government incentives encouraged manufacturers to adopt smart-factory programs, embedding AI-driven process control at the line edge. Privacy rulings remain receptive to innovation provided encryption and audit trails meet industry norms. Policy clarity shortens procurement cycles and underpins steady demand across healthcare, retail, and energy domains.
Asia Pacific is the fastest-growing territory, forecast to log a 26.07% CAGR during 2026-2031. China scales provincial edge facilities that ingest sensor feeds from smart traffic lights and industrial robotics. Japan's automotive majors deploy predictive quality loops that slice rework costs, while India's mobile operators leverage new spectrum to launch private 5G campuses for logistics parks. Diverse regulatory positions on cross-border data flows push multinationals toward localized deployments, often using open-source stacks to avoid vendor lock-in. Investments in domestic semiconductor fabs further support a self-sustaining regional supply chain and embed resilience into edge projects.
Europe shows robust but measured uptake, guided by GDPR and proposed AI liability laws. Germany pioneers Industrie 4.0 projects that retrofit heritage plants with OPC UA gateways and containerized inference, balancing innovation with risk governance. France leads smart-transport pilots where real-time video analytics on roadside units improve public-safety response times. Nordic operators prioritize green hydrogen-powered edge sites to respect ESG mandates. Standard-setting bodies collaborate on secure boot, remote attestation, and data-exchange frameworks, fostering an interoperability ethos that benefits the wider edge analytics market.
- Cisco Systems Inc.
- IBM Corporation
- Microsoft Corporation
- Apigee Corporation
- Dell Technologies Inc.
- Intel Corporation
- Oracle Corporation
- SAS Institute Inc.
- Amazon Web Services Inc.
- Google Cloud Platform
- Hewlett Packard Enterprise
- Schneider Electric SE
- Huawei Technologies Co.
- SAP SE
- Siemens AG
- GE Digital
- Foghorn Systems
- Edge Impulse Inc.
- Greenwave Systems
- Predixion Software
- AGT International Inc.
Additional Benefits:
- The market estimate (ME) sheet in Excel format
- 3 months of analyst support
TABLE OF CONTENTS
1 INTRODUCTION
- 1.1 Study Assumptions and Market Definition
- 1.2 Scope of the Study
2 RESEARCH METHODOLOGY
3 EXECUTIVE SUMMARY
4 MARKET LANDSCAPE
- 4.1 Market Overview
- 4.2 Market Drivers
- 4.2.1 Proliferation of IoT end-points
- 4.2.2 Demand for ultra-low-latency analytics
- 4.2.3 Rapid 5G roll-out unlocking edge use-cases
- 4.2.4 Cloud-native toolchains simplifying edge deployments
- 4.2.5 On-device federated learning enhancing data privacy
- 4.2.6 Liquid-cooling micro-data-centres enabling thermal-dense AI
- 4.3 Market Restraints
- 4.3.1 Persistent data-security & sovereignty risks
- 4.3.2 Integration complexity with brownfield OT systems
- 4.3.3 Scarcity of tiny-ML / edge-AI engineering talent
- 4.3.4 ESG-driven power-cap caps on distributed compute nodes
- 4.4 Evaluation of Critical Regulatory Framework
- 4.5 Value Chain Analysis
- 4.6 Technological Outlook
- 4.7 Porter's Five Forces
- 4.7.1 Bargaining Power of Suppliers
- 4.7.2 Bargaining Power of Buyers
- 4.7.3 Threat of New Entrants
- 4.7.4 Threat of Substitutes
- 4.7.5 Competitive Rivalry
- 4.8 Impact Assessment of Key Stakeholders
- 4.9 Key Use Cases and Case Studies
- 4.10 Impact on Macroeconomic Factors of the Market
- 4.11 Investment Analysis
5 MARKET SEGMENTATION
- 5.1 By Deployment Type
- 5.1.1 On-Premises
- 5.1.2 Cloud
- 5.2 By Component
- 5.2.1 Solutions
- 5.2.2 Services
- 5.3 By End-User Industry
- 5.3.1 BFSI
- 5.3.2 IT & Telecommunication
- 5.3.3 Manufacturing
- 5.3.4 Healthcare
- 5.3.5 Retail
- 5.3.6 Others
- 5.4 By Technology
- 5.4.1 Descriptive Analytics
- 5.4.2 Diagnostic Analytics
- 5.4.3 Predictive Analytics
- 5.4.4 Prescriptive Analytics
- 5.5 By Geography
- 5.5.1 North America
- 5.5.1.1 United States
- 5.5.1.2 Canada
- 5.5.1.3 Mexico
- 5.5.2 South America
- 5.5.2.1 Brazil
- 5.5.2.2 Argentina
- 5.5.2.3 Rest of South America
- 5.5.3 Europe
- 5.5.3.1 United Kingdom
- 5.5.3.2 Germany
- 5.5.3.3 France
- 5.5.3.4 Italy
- 5.5.3.5 Spain
- 5.5.3.6 Nordics
- 5.5.3.7 Rest of Europe
- 5.5.4 Middle East and Africa
- 5.5.4.1 Middle East
- 5.5.4.1.1 Saudi Arabia
- 5.5.4.1.2 United Arab Emirates
- 5.5.4.1.3 Turkey
- 5.5.4.1.4 Rest of Middle East
- 5.5.4.2 Africa
- 5.5.4.2.1 South Africa
- 5.5.4.2.2 Egypt
- 5.5.4.2.3 Nigeria
- 5.5.4.2.4 Rest of Africa
- 5.5.4.1 Middle East
- 5.5.5 Asia-Pacific
- 5.5.5.1 China
- 5.5.5.2 India
- 5.5.5.3 Japan
- 5.5.5.4 South Korea
- 5.5.5.5 ASEAN
- 5.5.5.6 Australia
- 5.5.5.7 New Zealand
- 5.5.5.8 Rest of Asia-Pacific
- 5.5.1 North America
6 COMPETITIVE LANDSCAPE
- 6.1 Market Concentration
- 6.2 Strategic Moves
- 6.3 Market Share Analysis
- 6.4 Company Profiles (includes Global level Overview, Market level overview, Core Segments, Financials as available, Strategic Information, Market Rank/Share for key companies, Products and Services, and Recent Developments)
- 6.4.1 Cisco Systems Inc.
- 6.4.2 IBM Corporation
- 6.4.3 Microsoft Corporation
- 6.4.4 Apigee Corporation
- 6.4.5 Dell Technologies Inc.
- 6.4.6 Intel Corporation
- 6.4.7 Oracle Corporation
- 6.4.8 SAS Institute Inc.
- 6.4.9 Amazon Web Services Inc.
- 6.4.10 Google Cloud Platform
- 6.4.11 Hewlett Packard Enterprise
- 6.4.12 Schneider Electric SE
- 6.4.13 Huawei Technologies Co.
- 6.4.14 SAP SE
- 6.4.15 Siemens AG
- 6.4.16 GE Digital
- 6.4.17 Foghorn Systems
- 6.4.18 Edge Impulse Inc.
- 6.4.19 Greenwave Systems
- 6.4.20 Predixion Software
- 6.4.21 AGT International Inc.
7 MARKET OPPORTUNITIES AND FUTURE OUTLOOK
- 7.1 White-space and Unmet-need Assessment