

|
시장보고서
상품코드
2122526
스트리밍 분석 : 시장 점유율 분석, 업계 동향 및 통계, 성장 예측(2026-2031년)Streaming Analytics - Market Share Analysis, Industry Trends & Statistics, Growth Forecasts (2026 - 2031) |
||||||
 Mordor Intelligence
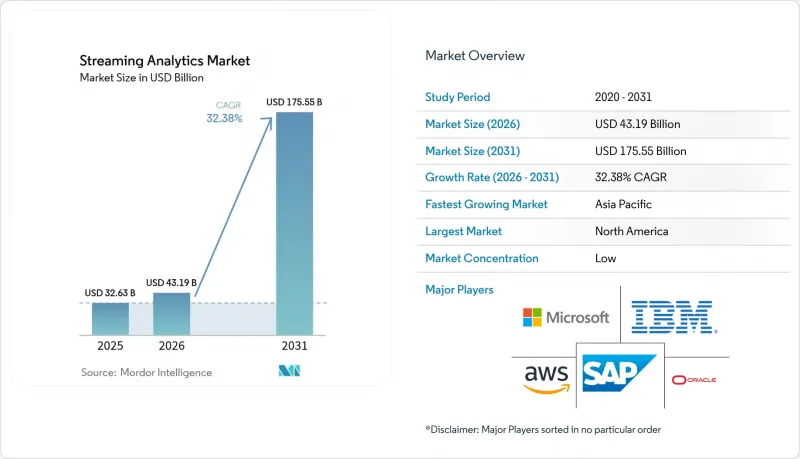
Mordor Intelligence에 의하면, 2026년 스트리밍 분석 시장 규모는 431억 9,000만 달러로 추정되고 2025년 326억 3,000만 달러에서 확대해, 2031년에는 1,755억 5,000만 달러에 이를 것으로 예측됩니다.
2026년부터 2031년까지의 연평균 성장률(CAGR)은 32.38%를 나타낼 것으로 전망됩니다.

본 보고서는 구성 요소(소프트웨어, 서비스), 배포 방식(On-Premise, 클라우드 기반), 최종 사용자 산업(미디어 및 엔터테인먼트, 소매 및 전자상거래, 제조, BFSI 등), 조직 규모(대기업, 중소기업) 및 지역별로 분류되어 있습니다. 시장 전망은 금액(달러) 기준으로 제시되어 있습니다.
세계의 스트리밍 분석 시장 동향 및 인사이트
생성형 AI가 통합된 데이터 파이프라인
고처리량 브로커와 통합된 컨텍스트 인식 모델은 원시 이벤트를 밀리초 단위로 처방적 조치로 변환합니다. 언어 모델과 스트리밍 텔레메트리를 결합한 금융 기관에서는 사기 감지 정확도가 40% 향상되었으며, 오감지율도 대폭 감소했습니다. Confluent Tableflow와 Databricks Delta Lake 간의 양방향 커넥터를 통해 모델에는 항상 최신 상태이며 데이터 계보가 풍부한 데이터가 공급되므로 수동 업데이트 주기가 필요하지 않습니다. 소매업체들은 현재 프로모션 매개변수를 실시간으로 자동 조정하여 플래시 세일 기간 동안의 전환율을 높이고 있습니다. 벡터 검색 및 시맨틱 보강용 라이브러리가 주요 스트림 엔진에 통합됨에 따라, 예측 유지보수 및 이상 감지는 대시보드에서 폐쇄 루프형 자율 처리로 전환되고 있습니다. 그 결과, 기존 ETL에 수반되는 지연의 폐해 없이 AI를 운영에 도입하고자 하는 전사적인 의지가 높아지고 있습니다.
디바이스 상에서 처리가 가능한 엣지 AI 칩
NVIDIA의 Jetson AGX Thor는 이전 세대보다 최대 8배 높은 연산 성능을 갖추고 있으며, 128GB 메모리를 통해 소스 측에서 대규모 트랜스포머 추론을 지원합니다. 제조업체는 이 모듈을 진동 센서 바로 옆에 배치함으로써, 고가의 가동 중단 시간이 발생하기 전에 모델이 베어링의 마모를 감지할 수 있도록 하고 있습니다. 병원에서는 환자의 생체 신호에 이상이 발생했을 때 간호사에게 경보를 발령하기 위해 엣지 추론을 활용하고 있으며, 지속적인 클라우드 업로드를 제한하는 개인정보 보호 규정도 준수하고 있습니다. Groq사의 LPU와 같은 신흥 가속기는 토큰 생성 속도를 초당 300토큰까지 향상시켜, 창구 키오스크 내에서 대화형 어시스턴트를 구동할 수 있게 합니다. 백홀 지연 및 대역폭 요금을 피함으로써, 기업들은 연결 환경이 불안정한 선박, 광산, 지방의 휴대전화 기지국에서 실시간 이용 사례를 실현하고 있습니다. 이를 통해 이 기술은 스트리밍 분석 시장의 지리적 범위를 확대하는 동시에, 데이터 주권에 관한 규제 준수를 강화하고 있습니다.
심화되는 Kafka 인재 부족과 임금 급등
포춘 100대 기업의 80% 이상이 Kafka에 의존하고 있음에도 불구하고, 구인사이트에는 자격을 갖춘 엔지니어 수보다 훨씬 많은 채용 공고가 게시되어 있습니다. 미국의 연봉은 10만 달러를 초과하여 중견 기업의 예산을 압박하고 있습니다. 브로커, 복제 계수, 그리고 ‘exactly-once’ 세미언틱스에 대한 가파른 학습 곡선은 신규 시장 진출기업들을 멀어지게 하고 있으며, 한편 클라우드 벤더들이 시니어 인력을 스카우트해 가면서 인재 유지도 과제가 되고 있습니다. 매니지드 플랫폼이 도움이 되기는 하지만, 유연성을 희생하고 구독 비용을 지불해야 합니다. 컨설팅 파트너들은 교육 부트캠프를 확대하고 있지만, 실무에 익숙해지기까지 걸리는 기간은 여전히 프로젝트 기한을 따라잡지 못하고 있습니다. 인재 양성 체계가 이를 따라잡을 때까지 인력 부족이 일부 도입을 저해할 것입니다. 특히 아웃소싱이 제한되는 규제 산업에서는 이러한 경향이 두드러집니다.
부문별 분석
2025년, 솔루션은 스트리밍 분석 시장의 구조적 핵심을 이루며 매출의 64.70%를 차지했습니다. 이는 브로커, 프로세서, 인터랙티브 쿼리 엔진의 광범위한 채택을 반영합니다. 그러나 기업들이 설계 청사진, 마이그레이션 지원, 연중무휴 SRE 지원을 요구함에 따라 서비스 부문은 2031년까지 연평균 성장률(CAGR) 33.10%로 확대되고 있습니다. 아키텍처 평가, 데이터 품질 개선, 스키마 거버넌스가 새로운 작업 명세서(SOW)의 핵심을 차지하고 있습니다. Confluent와 EY는 2025년에 전략적 제휴를 맺고 도입 지원 도구를 번들로 제공하고 있으며, 이는 외부 전문 지식에 대한 수요 증가를 뒷받침합니다. 가시성 및 비용 최적화 요구 사항이 높아짐에 따라, 매니지드 서비스는 단순한 호스팅에서 이벤트 속도에 기반한 자동 용량 조정에 이르기까지 그 범위를 확대되고 있습니다.
기술 인력 부족으로 인해 리스크 회피 성향이 강한 분야조차 런타임 운영을 외부에 위탁하게 되었으며, 예산은 자본 지출에서 정기적인 서비스로 전환되고 있습니다. 벤더의 로드맵에 따르면, 구독 플랜 내에 PCI-DSS 및 HIPAA를 지원하는 패키지화된 규정 준수 모듈이 등장하고 있으며, 이로 인해 규제 대상 도입 기업의 진입 장벽이 낮아지고 있습니다. 그 결과, 전문 서비스 및 관리형 서비스 분야의 스트리밍 분석 시장 규모는 핵심 소프트웨어 매출을 능가할 것으로 예상되며, 도구의 수가 아닌 노하우가 공급자의 차별화 요소가 되는 선순환이 강화되고 있습니다.
클라우드는 2025년 매출의 59.00%를 차지했으며, 33.40%에 달하는 연평균 성장률(CAGR)은 탄력적인 용량에 대한 지속적인 선호도를 보여줍니다. 각 하이퍼스케일러 기업은 자동 스케일링 기능을 갖춘 스트림 엔진과 레이크하우스, 벡터 데이터베이스를 결합함으로써, 팀이 하드웨어를 조달할 필요 없이 ML 기능을 도입, 보강 및 제공할 수 있도록 하고 있습니다. Google Cloud는 Pub/Sub, Dataflow, BigQuery, Vertex AI를 관리형 연속체로 통합하여, 분산 시스템 인력이 부족한 기업의 부담을 덜어주고 있습니다. On-Premise 워크로드를 위한 스트리밍 분석 시장 규모는 국방, 핀테크, 공중보건 분야에서 여전히 중요한 위치를 차지하고 있지만, 리프레시 주기 및 설비 투자 장벽으로 인해 그 성장세는 클라우드에 뒤처지고 있습니다.
하이브리드 설계안에서는 공장 내에서 Azure SQL Edge를 사용하여 기밀성이 높은 텔레메트리 데이터를 처리하고, 집계된 데이터를 클라우드의 ML 엔드포인트로 전송함으로써 데이터 전송 비용을 절감합니다. 각 공급업체는 현재 정책에 기반한 토픽 배치를 가능하게 하고, 개별 파티션이 국경 내에 머물도록 함으로써 새롭게 대두되고 있는 주권 관련 규제를 충족하고 있습니다. 예측 기간 동안, IAM, 계보, 거버넌스를 포괄하는 멀티 클라우드 통합 도구는 구매자가 이탈 비용에 대한 보호를 요구함에 따라 벤더 선정에 영향을 미칠 것으로 보입니다.
지역별 분석
북미는 초기 단계부터 확립된 하이퍼스케일러 생태계와 성숙한 Kafka 전문가들의 존재 덕분에 2025년에 매출의 29.30%를 차지했습니다. 금융 서비스, 라이드셰어, 소매 업계의 선구자들이 ROI를 입증하고, 업계를 초월하여 보급되는 레퍼런스 디자인을 창출했습니다. 그러나 시장 포화로 인해 점진적인 성장세는 둔화되고 있으며, 숙련된 인력 부족이 임금 상승을 초래하여 도입 예산에 영향을 미치고 있습니다. 기상, 산불, 모빌리티 등을 아우르는 공공 부문용 실시간 대시보드의 도입을 정부가 추진하고 있어, 엄격한 규정 준수 요건 하에 있기는 하지만 안정적인 수요가 발생하고 있습니다.
아시아태평양에서는 5G 확산, 스마트 팩토리 프로그램, 그리고 주권 클라우드 이니셔티브가 맞물려 33.20%라는 가장 높은 연평균 성장률(CAGR)을 기록하고 있습니다. 중국의 AI 매출은 2030년까지 3,000억 달러에 육박할 것으로 예상되며, 자율형 제조 셀에서는 엣지 스트리밍이 필수적인 요소로 간주되고 있습니다. 인도의 공공 디지털 인프라 추진에 따라 이벤트 스트림이 세무, 신원 확인, 결제 인프라에 통합되고 있는 반면, 동남아시아의 전자상거래 플랫폼은 모바일 사용자를 확보하기 위해 실시간 개인화에 의존하고 있습니다. 현지 반도체 제조업체와 통신 사업자가 공동으로 혁신을 추진함으로써 하드웨어 비용이 절감되고 지역 벤더 생태계가 활성화되어, 이는 도입의 모멘텀을 높이고 있습니다.
기타 혜택 :
- 엑셀 형식 시장 예측(ME) 시트
- 3개월간 애널리스트 지원
자주 묻는 질문
목차
제1장 서론
제2장 조사 방법
제3장 주요 요약
제4장 시장 구도
제5장 시장 규모 및 성장 예측
제6장 경쟁 구도
제7장 시장 기회 및 향후 전망
KTH 26.09.08According to Mordor Intelligence, the streaming analytics market size in 2026 is estimated at USD 43.19 billion, growing from 2025 value of USD 32.63 billion with 2031 projections showing USD 175.55 billion, growing at 32.38% CAGR over 2026-2031.
This report is Segmented by Component (Software, Services), Deployment (On-Premise, Cloud-Based), End-User Industry (Media and Entertainment, Retail and ECommerce, Manufacturing, BFSI, and More), Organization Size (Large Enterprises, Small and Medium Enterprises), and by Geography. The Market Forecasts are Provided in Terms of Value (USD)
Global Streaming Analytics Market Trends and Insights
Generative-AI Infused Data Pipelines
Context-aware models integrated with high-throughput brokers turn raw events into prescriptive actions in milliseconds. Financial institutions combining language models with streaming telemetry report 40% gains in fraud-detection accuracy while slashing false positives. Bidirectional connectors between Confluent Tableflow and Databricks Delta Lake keep models supplied with fresh, lineage-rich data, eliminating manual refresh cycles. Retailers now auto-tune promotion parameters in real time, lifting conversion rates during flash sales. As libraries for vector search and semantic enrichment join core stream engines, predictive maintenance and anomaly triage are shifting from dashboards to closed-loop autonomy. The result is a broader enterprise appetite to operationalize AI without the latency penalties of traditional ETL.
Edge AI Chips Enabling On-Device Processing
NVIDIA's Jetson AGX Thor supplies up to 8 times the prior-generation compute, with 128 GB memory supporting hefty transformer inference at source. Manufacturers deploy the module next to vibration sensors so that models flag bearing wear before costly downtime. Hospitals rely on edge inference to trigger nurse alerts when patient vitals deviate, meeting privacy rules that restrict continuous cloud upload . Emerging accelerators like Groq's LPU push token generation to 300 tokens per second, letting conversational assistants run inside teller kiosks. By sidestepping back-haul latency and bandwidth charges, firms unlock real-time use cases in ships, mines, and rural cell towers where connectivity remains inconsistent. The technology thus widens geographic reach for the streaming analytics market while reinforcing compliance with data-sovereignty codes.
Rising Kafka Skill-Set Shortage and Wage Inflation
Eighty-plus percent of Fortune 100 enterprises rely on Kafka, yet job boards list far more openings than qualified engineers. United States salaries top USD 100,000, squeezing budgets for mid-tier firms. The steep learning curve around brokers, replication factors, and exactly-once semantics deters newcomers, while retaining talent proves challenging as cloud vendors poach senior staff. Managed platforms help but trade flexibility for subscription outlays. Consulting partners expand training bootcamps, though ramp-up times still lag project deadlines. Until educational pipelines catch up, talent scarcity will curb some rollouts, particularly in regulated sectors where outsourcing is constrained.
Other drivers and restraints analyzed in the detailed report include:
- Low-Code/No-Code Streaming Workbenches for Citizen Developers
- Mainstream Adoption of Event-Driven Micro-Services
- Escalating Egress Fees on Hyperscaler Clouds
For complete list of drivers and restraints, kindly check the Table Of Contents.
Segment Analysis
Solutions provided the structural backbone of the streaming analytics market in 2025 with 64.70% revenue, reflecting wide adoption of brokers, processors, and interactive query engines. Yet services are accelerating at 33.10% CAGR through 2031 as enterprises seek design blueprints, migration aid, and 24/7 SRE support. Architecture assessments, data-quality remediation, and schema governance dominate new statements of work. Confluent and EY formed a strategic alliance in 2025 to bundle implementation accelerators, underscoring demand for outside expertise. As observability and cost-optimization mandates rise, managed services extend from simple hosting to auto-tuning capacity based on event velocity.
Skills shortages push even risk-averse sectors to outsource runtime operations, shifting budgets from capital expenditure to recurring services. Vendor roadmaps show pre-packaged compliance modules for PCI-DSS and HIPAA emerging inside subscription tiers, which lowers the barrier for regulated adopters. Consequently, the streaming analytics market size for professional and managed services is projected to outpace core software revenues, reinforcing a virtuous cycle where know-how, not tool count, differentiates providers.
Cloud claimed 59.00% of 2025 revenue, and its 33.40% CAGR signals continued preference for elastic capacity. Hyperscalers pair auto-scaling stream engines with lakehouses and vector databases, letting teams ingest, enrich, and serve ML features without hardware procurement. Google Cloud stitches Pub/Sub, Dataflow, BigQuery, and Vertex AI into a managed continuum, easing burden for firms lacking distributed-systems talent. The streaming analytics market size for on-premise workloads remains meaningful in defense, fintech, and public health, but growth trails cloud due to refresh cycles and capex hurdles.
Hybrid blueprints mitigate egress costs by processing sensitive telemetry in factories with Azure SQL Edge before forwarding aggregates to cloud ML endpoints. Providers now enable policy-based topic placement so that individual partitions stay inside national borders, satisfying emerging sovereignty rules. Over the forecast, multicloud federation tools that span IAM, lineage, and governance will influence vendor selection as buyers seek exit-cost protection.
Complete Report Scope:
- By Component
- Software
- Services
- By Deployment
- On-Premise
- Cloud-Based
- By End-user Industry
- Media and Entertainment
- Retail and eCommerce
- Manufacturing
- BFSI
- Healthcare and Life Sciences
- Transportation and Logistics
- Telecommunications
- Others
- By Organization Size
- Large Enterprises
- Small and Medium Enterprises
- By Geography
- North America
- United States
- Canada
- Mexico
- South America
- Brazil
- Argentina
- Rest of South America
- Europe
- Germany
- United Kingdom
- France
- Netherlands
- Rest of Europe
- Asia-Pacific
- China
- Japan
- India
- South Korea
- Australia and New Zealand
- Rest of Asia-Pacific
- Middle East and Africa
- Middle East
- United Arab Emirates
- Saudi Arabia
- Turkey
- Rest of Middle East
- Africa
- South Africa
- Nigeria
- Rest of Africa
- Middle East
- North America
Geography Analysis
North America captured 29.30% revenue in 2025 owing to early hyperscaler ecosystems and a mature cadre of Kafka specialists. Financial services, ride-hailing, and retail pioneers validated ROI, creating reference designs that spread across sectors. Yet saturation tempers incremental growth, and skilled-labor bottlenecks spark wage premiums that influence deployment budgets. Government push for real-time public-sector dashboards-covering weather, wildfire, and mobility-adds steady demand, albeit at rigorous compliance levels.
Asia-Pacific posts the swiftest 33.20% CAGR as 5G rollouts, smart-factory programs, and sovereign cloud initiatives converge. China's AI revenue projections near USD 300 billion by 2030, with edge streaming deemed vital to autonomous manufacturing cells. India's public-digital-infrastructure drive embeds event streams into tax, identity, and payments rails, while Southeast Asian e-commerce platforms rely on real-time personalization to compete for mobile users. Local chipmakers and telcos co-innovate, reducing hardware costs and boosting regional vendor ecosystems, which keeps adoption momentum high.
- IBM Corporation
- Microsoft Corporation
- Oracle Corporation
- SAP SE
- Amazon Web Services
- Google (Alphabet)
- Confluent Inc.
- TIBCO Software Inc.
- Software AG
- SAS Institute Inc.
- Striim Inc.
- Impetus Technologies
- Databricks
- Snowflake Inc.
- Apache Software Foundation (Kafka/Flink)
- Cloudera Inc.
- Ververica
- Aiven Ltd.
- Timeplus
- Hazelcast Inc.
- StreamSets Inc.
- Redpanda Data
- Cisco Systems (ThousandEyes)
Additional Benefits:
- The market estimate (ME) sheet in Excel format
- 3 months of analyst support
TABLE OF CONTENTS
1 INTRODUCTION
- 1.1 Study Assumptions and Market Definition
- 1.2 Scope of the Study
2 RESEARCH METHODOLOGY
3 EXECUTIVE SUMMARY
4 MARKET LANDSCAPE
- 4.1 Market Overview
- 4.2 Market Drivers
- 4.2.1 Generative-AI infused data pipelines
- 4.2.2 Edge AI chips enabling on-device stream processing
- 4.2.3 Low-code/no-code streaming workbenches for citizen developers
- 4.2.4 Mainstream adoption of event-driven micro-services
- 4.2.5 Growing SME demand for cloud stream analytics (consensus driver)
- 4.2.6 Expansion of IoT and industrial automation (consensus driver)
- 4.3 Market Restraints
- 4.3.1 Rising Kafka skill-set shortage and wage inflation
- 4.3.2 Escalating egress fees on hyperscaler clouds
- 4.3.3 Data-sovereignty regulations limiting cross-border stream flows
- 4.3.4 Legacy batch-centric architectures delaying migration (consensus)
- 4.4 Supply-Chain Analysis
- 4.5 Regulatory Landscape
- 4.6 Technological Outlook
- 4.7 Porter's Five Forces
- 4.7.1 Threat of New Entrants
- 4.7.2 Bargaining Power of Buyers
- 4.7.3 Bargaining Power of Suppliers
- 4.7.4 Threat of Substitutes
- 4.7.5 Intensity of Competitive Rivalry
- 4.8 Assesment of Macroeconomic Factors on the Market
5 MARKET SIZE AND GROWTH FORECASTS (VALUE)
- 5.1 By Component
- 5.1.1 Software
- 5.1.2 Services
- 5.2 By Deployment
- 5.2.1 On-Premise
- 5.2.2 Cloud-Based
- 5.3 By End-user Industry
- 5.3.1 Media and Entertainment
- 5.3.2 Retail and eCommerce
- 5.3.3 Manufacturing
- 5.3.4 BFSI
- 5.3.5 Healthcare and Life Sciences
- 5.3.6 Transportation and Logistics
- 5.3.7 Telecommunications
- 5.3.8 Others
- 5.4 By Organization Size
- 5.4.1 Large Enterprises
- 5.4.2 Small and Medium Enterprises
- 5.5 By Geography
- 5.5.1 North America
- 5.5.1.1 United States
- 5.5.1.2 Canada
- 5.5.1.3 Mexico
- 5.5.2 South America
- 5.5.2.1 Brazil
- 5.5.2.2 Argentina
- 5.5.2.3 Rest of South America
- 5.5.3 Europe
- 5.5.3.1 Germany
- 5.5.3.2 United Kingdom
- 5.5.3.3 France
- 5.5.3.4 Netherlands
- 5.5.3.5 Rest of Europe
- 5.5.4 Asia-Pacific
- 5.5.4.1 China
- 5.5.4.2 Japan
- 5.5.4.3 India
- 5.5.4.4 South Korea
- 5.5.4.5 Australia and New Zealand
- 5.5.4.6 Rest of Asia-Pacific
- 5.5.5 Middle East and Africa
- 5.5.5.1 Middle East
- 5.5.5.1.1 United Arab Emirates
- 5.5.5.1.2 Saudi Arabia
- 5.5.5.1.3 Turkey
- 5.5.5.1.4 Rest of Middle East
- 5.5.5.2 Africa
- 5.5.5.2.1 South Africa
- 5.5.5.2.2 Nigeria
- 5.5.5.2.3 Rest of Africa
- 5.5.5.1 Middle East
- 5.5.1 North America
6 COMPETITIVE LANDSCAPE
- 6.1 Market Concentration
- 6.2 Strategic Moves
- 6.3 Market Share Analysis
- 6.4 Company Profiles (includes Global level Overview, Market level overview, Core Segments, Financials as available, Strategic Information, Market Rank/Share for key companies, Products and Services, and Recent Developments)
- 6.4.1 IBM Corporation
- 6.4.2 Microsoft Corporation
- 6.4.3 Oracle Corporation
- 6.4.4 SAP SE
- 6.4.5 Amazon Web Services
- 6.4.6 Google (Alphabet)
- 6.4.7 Confluent Inc.
- 6.4.8 TIBCO Software Inc.
- 6.4.9 Software AG
- 6.4.10 SAS Institute Inc.
- 6.4.11 Striim Inc.
- 6.4.12 Impetus Technologies
- 6.4.13 Databricks
- 6.4.14 Snowflake Inc.
- 6.4.15 Apache Software Foundation (Kafka/Flink)
- 6.4.16 Cloudera Inc.
- 6.4.17 Ververica
- 6.4.18 Aiven Ltd.
- 6.4.19 Timeplus
- 6.4.20 Hazelcast Inc.
- 6.4.21 StreamSets Inc.
- 6.4.22 Redpanda Data
- 6.4.23 Cisco Systems (ThousandEyes)
7 MARKET OPPORTUNITIES AND FUTURE OUTLOOK
- 7.1 White-space and Unmet-need Assessment


