

|
시장보고서
상품코드
2122529
봇 서비스 : 시장 점유율 분석, 업계 동향과 통계, 성장 예측(2026-2031년)Bot Services - Market Share Analysis, Industry Trends & Statistics, Growth Forecasts (2026 - 2031) |
||||||
 Mordor Intelligence
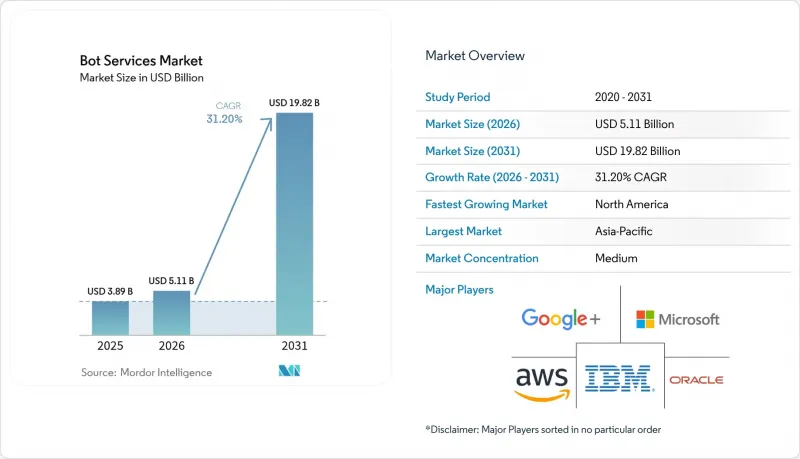
에 의하면, 2026년 봇 서비스 시장 규모는 51억 1,000만 달러로 추정되며, 2025년 38억 9,000만 달러에서 2031년에는 198억 2,000만 달러에 달할 것으로 예측됩니다.
또한 2026-2031년 연평균 성장률(CAGR)은 31.20%를 기록할 것으로 전망됩니다.
본 보고서는 도입 채널(웹사이트(웹 기반), 모바일 애플리케이션(앱 내), 기타), 제품 유형(텍스트 기반 챗봇, 음성 어시스턴트, 기타), 최종 사용자 산업(소매 및 전자상거래,BFSI, IT 및 통신, 기타), 조직 규모(중소기업 및 대기업), 그리고 지역별로 분류되어 있습니다. 시장 예측은 금액(달러) 기준으로 제시되어 있습니다.
세계 봇 서비스 시장 동향 및 인사이트
메시징 앱 API의 보급
WhatsApp, Messenger 및 엔터프라이즈 협업 제품군을 통한 표준화된 API 덕분에 기업은 고객이 이미 이용하고 있는 채널에 봇을 직접 통합할 수 있게 되었습니다. 마이크로소프트는 Copilot Studio를 통해 구축된 맞춤형 에이전트 수가 전 분기 대비 130% 증가했다고 보고하며, 마찰 없는 통합이 도입을 얼마나 가속화하고 있는지를 보여주고 있습니다. API의 규모의 경제가 확대됨에 따라 중소기업의 비용 장벽은 낮아지고 있으며, 이는 중소기업이 가장 빠르게 성장하는 사용자층인 이유를 설명해 줍니다.
생성형 AI의 비약적인 발전이 NLP 비용을 절감
사전 학습된 트랜스포머 모델 덕분에 맞춤형 NLP 파이프라인이 더 이상 필요하지 않게 되었습니다. Azure AI의 매출은 전년 대비 175%의 성장세를 보였으며, 2025년 Azure 전체 성장에 16퍼센트포인트를 기여했습니다. Google Cloud에서도 유사한 추세가 관찰되며, 기업들이 고급 언어 기능을 처음부터 구축하기보다는 임대하는 것을 선호하는 경향이 두드러지고 있어, 이를 통해 새로운 봇 도입 시 가치 실현까지 걸리는 시간이 단축되고 있습니다.
레거시 시스템과의 통합 복잡성
메인프레임을 핵심으로 하는 은행이나 의료 기관은 수십년전부터 사용되어 온 코어 시스템에 최신 대화형 레이어를 통합할 때, 인터페이스 개발 및 보안 테스트 주기에 막대한 노력을 기울여야 합니다. 2024년 마이크로소프트에서 발생한 ‘Midnight Blizzard’ 사건은 특정 시스템에서 인증 정보가 유출된 것만으로 봇 파이프라인으로 유입되는 데이터가 노출될 가능성이 있음을 보여주었으며, 엄격한 보안 강화의 필요성을 다시 한번 부각시켰습니다.
부문 분석
2025년에는 웹사이트 봇이 매출의 41.25%라는 최대 점유율을 차지하며, 데스크톱 트래픽의 뿌리 깊은 존재감을 부각시켰습니다. 그러나 스마트폰 우선 행동이 고객 지원 접점을 지배하는 가운데, 모바일 애플리케이션는 연평균 성장률(CAGR) 32.43%로 성장할 전망입니다. 기업들은 현재 앱 내에서 시작되어 SMS를 거쳐 이메일 대화 기록으로 끝나는 대화 흐름을 조정하며, 플랫폼 간에 대화 상태를 유지하고 있습니다. 맥락의 연속성은 각 상호작용에 영구적인 식별자를 부여하는 통합된 고객 데이터 레이어에 의존하며, 이를 통해 정보의 단편화를 줄이고 있습니다. 소매업체들은 사용자를 외부 페이지로 리디렉션하지 않고 주문 현황을 확인하거나 반품 처리를 할 수 있는 앱 내 봇을 선호하는 반면, 항공사들은 핸즈프리로 여정 변경을 처리할 수 있도록 음성 인식 에이전트를 통합하고 있습니다. 이러한 시나리오는 모바일 채널이 이탈률을 어떻게 낮추고 순추천지수(NPS)를 향상시키는지 보여줍니다. 음성 및 IVR은 여전히 콜센터의 주축이지만, 동일한 AI 백본에 통합되는 추세가 강해지고 있어 기업들은 텍스트와 음성을 모두 지원하는 단일 인텐트 모델을 학습시킬 수 있게 되었습니다. 이러한 엔드포인트의 융합으로 모바일은 옴니채널 설계의 핵심으로 자리매김하고 있으며, 예산 배분은 SDK 및 푸시 알림 오케스트레이션으로 이동하고 있습니다.
오랜 기간 기업에서 입증된 실적을 바탕으로 한 텍스트 기반 챗봇은 2025년 매출의 47.20%를 차지했으나, 기업들이 문맥에 따른 추론을 중시함에 따라 생성형 AI 에이전트는 연평균 성장률(CAGR) 32.05%로 성장하고 있습니다. 특허 동향도 이러한 변화를 반영하고 있으며, 생성형 AI 관련 출원 건수는 2014년 733건에서 2023년에는 1만 4,000건 이상으로 급증했습니다. 생성형 AI 에이전트 봇 서비스 시장 규모는 기존의 스크립트형 봇을 넘어설 것으로 예상되며, 각 벤더들은 환각 현상을 억제하기 위해 검색 강화 생성(RAG) 기능 개발을 서둘러 진행하고 있습니다. 음성 어시스턴트와 스마트 스피커의 도입은 스마트 홈 생태계의 기반이 되고 있지만, 채팅을 주축으로 하는 인터페이스에 비해 기업에서의 채택은 여전히 틈새 분야에 그치고 있습니다. 따라서 많은 기업에서는 API 호출을 통해 라이선스가 제공되는 모듈형 NLP 엔진을 사내 사용자 경험 계층에 통합하고 있습니다. 이러한 아키텍처를 통해 팀은 정확도, 비용 또는 데이터 주권과 관련된 요구 사항의 변화에 따라 모델을 교체하거나 중첩할 수 있는 유연성을 확보할 수 있습니다.
지역별 분석
북미는 성숙한 클라우드 기반과 AI 인프라에 대한 견실한 설비 투자의 뒷받침을 받아 2025년 매출의 30.15%를 차지했습니다. 마이크로소프트는 2024 회계연도 매출로 2,450억 달러를 보고했으며, 클라우드 매출은 23% 증가한 1,350억 달러를 넘어섰습니다. 이는 AI 워크로드의 수익화에 대한 경영진의 절박한 태도를 반영합니다. 특히 미국은 명확한 지적재산권 체계의 혜택을 누리고 있습니다. 미국 특허상표청(USPTO)이 2024년에 발표한 AI 특허 적격성 관련 지침에 따라 출원 절차가 간소화되어 독자적인 봇 기술 혁신이 촉진되고 있습니다.
아시아태평양은 막대한 정부 보조금과 급성장하는 개발자 생태계의 뒷받침을 받아 연평균 성장률(CAGR) 32.50%라는 가장 높은 성장률을 기록하고 있습니다. 중국의 대화형 AI에 대한 지출은 2023년 10억 5,000만 달러에서 2030년까지 51억 9,000만 달러로 증가할 것으로 예측됩니다. 한편, 싱가포르의 10억 싱가포르 달러 규모의 AI 활성화 정책과 한국의 7,102억 원 규모의 혁신 기금은 민관 파트너십을 활성화하고 있습니다. 인도에서는 전국 규모의 ‘IndiaAI 미션’이 2025년까지 5,000억 달러 규모의 디지털 경제 가치 창출을 목표로 하고 있으며, 신뢰를 바탕으로 한 확산을 가속화하기 위해 모든 시범 프로젝트에 윤리적 AI 지침을 반영하고 있습니다.
유럽의 전망은 여전히 규제 주도형입니다. 2024년 8월부터 시행되고 있는 EU AI법은 고위험 봇 용도에 대해 가동 개시 전에 적합성 평가를 제출할 것을 의무화하고 있으며, 기업을 감사 대응이 가능한 문서를 제공할 수 있는 공급자로 유도하고 있습니다. 규정 준수 비용은 단기적인 지출을 억제할 수 있지만, 궁극적으로는 공급업체 변경의 장벽을 높여 공급업체와 고객 간의 유대를 더욱 공고히 합니다. 다른 지역에서는 걸프협력회의(GCC) 국가들에서 정부가 아랍어 시민 포털을 구축함에 따라 도입의 초기 단계를 보이고 있지만, 아프리카의 광범위한 지역에서는 인프라 격차로 인해 도입 주기가 여전히 장기화되고 있습니다.
기타 혜택:
- 엑셀 형식 시장 예측(ME) 시트
- 3개월간 애널리스트 지원
자주 묻는 질문
목차
제1장 서론
제2장 조사 방법
제3장 주요 요약
제4장 시장 구도
제5장 시장 규모와 성장 예측
제6장 경쟁 구도
제7장 시장 기회와 향후 전망
LSH 26.09.03According to Mordor Intelligence, bot services market size market size in 2026 is estimated at USD 5.11 billion, growing from 2025 value of USD 3.89 billion with 2031 projections showing USD 19.82 billion, growing at 31.20% CAGR over 2026-2031.
This report is Segmented by Deployment Channel (Website (Web-Based), Mobile Application (In-App), and More), Product Type (Text-Based Chatbots, Voice Assistants, and More), End-User Industry (Retail and ECommerce, BFSI, IT and Telecom, and More), Organization Size (SMEs and Large Enterprises), and Geography. The Market Forecasts are Provided in Terms of Value (USD).
Global Bot Services Market Trends and Insights
Proliferation of messaging-app APIs
Standardized APIs from WhatsApp, Messenger, and enterprise collaboration suites now let companies embed bots directly into the channels customers already use. Microsoft tallied a 130% quarter-over-quarter jump in custom agents built via Copilot Studio, illustrating how low-friction integration accelerates adoption. As API economies of scale grow, cost barriers for smaller firms subside, which explains why SMEs are the fastest-growing user group.
Generative-AI breakthroughs lowering cost of NLP
Pre-trained transformer models eliminate the need for custom NLP pipelines. Azure AI revenue climbed at a 175% year-over-year pace and contributed 16 percentage points to overall Azure growth in 2025. Similar momentum at Google Cloud underscores that enterprises prefer to rent advanced language capabilities rather than build them from scratch, compressing time-to-value for new bot deployments.
Legacy-system integration complexity
Mainframe-centric banks and health providers face steep interface development and security-testing cycles when grafting modern conversational layers onto decades-old cores. Microsoft's 2024 Midnight Blizzard incident showed how compromised credentials in one system can expose data flowing into bot pipelines, reaffirming the need for rigorous hardening.
Other drivers and restraints analyzed in the detailed report include:
- 24/7 customer-engagement demand across industries
- Sector-specific LLM platforms (health, legal, etc.)
- Data-privacy and compliance hurdles
For complete list of drivers and restraints, kindly check the Table Of Contents.
Segment Analysis
Website bots held the largest 41.25% revenue slice in 2025, underscoring enduring desktop traffic. Yet mobile applications are on track for a 32.43% CAGR as smartphone-first behavior dominates customer support touchpoints. Enterprises now orchestrate threads that begin inside an app, hop to SMS, and finish with an emailed transcript, preserving conversation state across platforms. Context hand-off relies on unified customer-data layers that tag each interaction with a persistent identifier, mitigating fragmentation. Retailers favor in-app bots that surface order statuses or process returns without redirecting users to external pages, while airlines embed voice-to-text agents to handle itinerary changes hands-free. These scenarios showcase how mobile channels lower abandonment rates and boost Net Promoter Scores. Voice and IVR remain staples in call centers but increasingly plug into the same AI backbone, letting companies train a single intent model that serves text and speech alike. The convergence of these endpoints positions mobile as the linchpin in omnichannel design, steering budget allocation toward SDKs and push-notification orchestration.
Text-based chatbots, bolstered by years of enterprise proof-points, generated 47.20% of 2025 revenue, yet generative-AI agents are climbing at 32.05% CAGR as firms prize contextual reasoning. Patent activity mirrors the shift: generative-AI filings ballooned from 733 in 2014 to more than 14,000 in 2023. With the bot services market size for generative-AI agents projected to outpace legacy scripted bots, vendors are fast-tracking retrieval-augmented generation (RAG) features to curb hallucinations. Voice assistants and smart-speaker deployments anchor smart-home ecosystems, but corporate uptake remains niche relative to chat-first interfaces. Most enterprises therefore blend modular NLP engines, often licensed via API calls, into in-house user-experience layers. This architecture gives teams flexibility to swap or stack models as accuracy, cost, or data-sovereignty requirements change.
Complete Report Scope:
- By Deployment Channel
- Website (Web-based)
- Mobile Application (In-app)
- Social / Messaging Platforms
- Voice / IVR Customer-Care
- Email and In-Product Widgets
- By Product Type
- Text-based Chatbots
- Voice Assistants
- Smart Speakers / IoT Hubs
- NLP Engine Licensing
- Generative-AI Agents
- By End-User Industry
- Retail and eCommerce
- BFSI
- Healthcare and Life-Sciences
- IT and Telecom
- Travel and Hospitality
- Government and Public Sector
- Manufacturing and Logistics
- By Organisation Size
- Small and Mid-sized Enterprises (SMEs)
- Large Enterprises
- By Geography
- North America
- United States
- Canada
- Mexico
- South America
- Brazil
- Argentina
- Rest of South America
- Europe
- Germany
- France
- United Kingdom
- Italy
- Rest of Europe
- Asia-Pacific
- China
- India
- Japan
- Rest of Asia-Pacific
- Middle East
- Saudi Arabia
- United Arab Emirates
- Turkey
- Rest of Middle East
- Africa
- South Africa
- Nigeria
- Rest of Africa
- North America
Geography Analysis
North America accounted for 30.15% of 2025 revenue, buoyed by mature cloud footprints and robust capital expenditure on AI infrastructure. Microsoft reported USD 245 billion in FY 2024 sales, with cloud revenue topping USD 135 billion on 23% growth, reflecting boardroom urgency to monetize AI workloads. The United States, in particular, benefits from clear intellectual-property frameworks; the USPTO's 2024 guidelines on AI patent eligibility have streamlined filings, encouraging proprietary bot innovations.
Asia Pacific is registering the fastest 32.50% CAGR, powered by sizable government grants and a burgeoning developer ecosystem. China's conversational-AI spend is projected to rise from USD 1.05 billion in 2023 to USD 5.19 billion by 2030, while Singapore's SGD 1 billion AI stimulus and South Korea's KRW 710.2 billion innovation fund are mobilizing public-private partnerships. India's nationwide IndiaAI Mission targets USD 500 billion digital-economy value by 2025, embedding ethical-AI guidelines within every pilot to accelerate trust-based rollout.
Europe's outlook remains regulatory-led. The EU AI Act, live since August 2024, obliges high-risk bot applications to submit conformity assessments before go-live, nudging enterprises toward providers that can furnish audit-ready documentation. Although compliance costs can curb short-term spending, they ultimately raise the switching barrier, cementing vendor-customer ties. Elsewhere, early-stage adoption is emerging in the Gulf Cooperation Council as governments deploy Arabic-language citizen portals, but infrastructure gaps continue to prolong deployment cycles across large parts of Africa.
- Amazon Web Services
- Microsoft
- IBM
- Oracle
- Meta (Facebook)
- Nuance Communications
- SAP
- Salesforce
- Twilio
- Zendesk
- LivePerson
- Kore.ai
- Yellow.ai
- Intercom
- Drift
- Ada Support
- ServiceNow
- Haptik
- Chatfuel
- Baidu (DuerOS)
Additional Benefits:
- The market estimate (ME) sheet in Excel format
- 3 months of analyst support
TABLE OF CONTENTS
1 INTRODUCTION
- 1.1 Study Assumptions and Market Definition
- 1.2 Scope of the Study
2 RESEARCH METHODOLOGY
3 EXECUTIVE SUMMARY
4 MARKET LANDSCAPE
- 4.1 Market Overview
- 4.2 Market Drivers
- 4.2.1 Proliferation of messaging-app APIs
- 4.2.2 Generative-AI breakthroughs lowering cost of NLP
- 4.2.3 24/7 customer-engagement demand across industries
- 4.2.4 Sector-specific LLM platforms (health, legal, etc.)
- 4.2.5 No-/low-code bot builders embedded in SaaS stacks
- 4.2.6 Conversational-commerce monetisation and embedded payments
- 4.3 Market Restraints
- 4.3.1 Legacy-system integration complexity
- 4.3.2 Data-privacy and compliance hurdles
- 4.3.3 Free generative bots shrinking willingness-to-pay
- 4.3.4 Hallucination and brand-risk from biased algorithms
- 4.4 Industry Value Chain Analysis
- 4.5 Regulatory Landscape
- 4.6 Technological Outlook
- 4.7 Porter's Five Forces Analysis
- 4.7.1 Bargaining Power of Suppliers
- 4.7.2 Bargaining Power of Buyers
- 4.7.3 Threat of New Entrants
- 4.7.4 Threat of Substitutes
- 4.7.5 Intensity of Competitive Rivalry
- 4.8 Investment Analysis
- 4.9 Impact of Macroeconomic Factors
5 MARKET SIZE AND GROWTH FORECASTS (VALUE)
- 5.1 By Deployment Channel
- 5.1.1 Website (Web-based)
- 5.1.2 Mobile Application (In-app)
- 5.1.3 Social / Messaging Platforms
- 5.1.4 Voice / IVR Customer-Care
- 5.1.5 Email and In-Product Widgets
- 5.2 By Product Type
- 5.2.1 Text-based Chatbots
- 5.2.2 Voice Assistants
- 5.2.3 Smart Speakers / IoT Hubs
- 5.2.4 NLP Engine Licensing
- 5.2.5 Generative-AI Agents
- 5.3 By End-User Industry
- 5.3.1 Retail and eCommerce
- 5.3.2 BFSI
- 5.3.3 Healthcare and Life-Sciences
- 5.3.4 IT and Telecom
- 5.3.5 Travel and Hospitality
- 5.3.6 Government and Public Sector
- 5.3.7 Manufacturing and Logistics
- 5.4 By Organisation Size
- 5.4.1 Small and Mid-sized Enterprises (SMEs)
- 5.4.2 Large Enterprises
- 5.5 By Geography
- 5.5.1 North America
- 5.5.1.1 United States
- 5.5.1.2 Canada
- 5.5.1.3 Mexico
- 5.5.2 South America
- 5.5.2.1 Brazil
- 5.5.2.2 Argentina
- 5.5.2.3 Rest of South America
- 5.5.3 Europe
- 5.5.3.1 Germany
- 5.5.3.2 France
- 5.5.3.3 United Kingdom
- 5.5.3.4 Italy
- 5.5.3.5 Rest of Europe
- 5.5.4 Asia-Pacific
- 5.5.4.1 China
- 5.5.4.2 India
- 5.5.4.3 Japan
- 5.5.4.4 Rest of Asia-Pacific
- 5.5.5 Middle East
- 5.5.5.1 Saudi Arabia
- 5.5.5.2 United Arab Emirates
- 5.5.5.3 Turkey
- 5.5.5.4 Rest of Middle East
- 5.5.6 Africa
- 5.5.6.1 South Africa
- 5.5.6.2 Nigeria
- 5.5.6.3 Rest of Africa
- 5.5.1 North America
6 COMPETITIVE LANDSCAPE
- 6.1 Market Concentration
- 6.2 Strategic Moves
- 6.3 Market Share Analysis
- 6.4 Company Profiles (includes Global level Overview, Market level overview, Core Segments, Financials as available, Strategic Information, Market Rank/Share for key companies, Products and Services, and Recent Developments)
- 6.4.1 Amazon Web Services
- 6.4.2 Microsoft
- 6.4.3 Google
- 6.4.4 IBM
- 6.4.5 Oracle
- 6.4.6 Meta (Facebook)
- 6.4.7 Nuance Communications
- 6.4.8 SAP
- 6.4.9 Salesforce
- 6.4.10 Twilio
- 6.4.11 Zendesk
- 6.4.12 LivePerson
- 6.4.13 Kore.ai
- 6.4.14 Yellow.ai
- 6.4.15 Intercom
- 6.4.16 Drift
- 6.4.17 Ada Support
- 6.4.18 ServiceNow
- 6.4.19 Haptik
- 6.4.20 Chatfuel
- 6.4.21 Baidu (DuerOS)
7 MARKET OPPORTUNITIES AND FUTURE OUTLOOK
- 7.1 White-space and Unmet-need Assessment


