
|
시장보고서
상품코드
2122669
필드 서비스 관리 : 시장 점유율 분석, 업계 동향 및 통계, 성장 예측(2026-2031년)Field Service Management (FSM) - Market Share Analysis, Industry Trends & Statistics, Growth Forecasts (2026 - 2031) |
||||||
 Mordor Intelligence
Mordor Intelligence에 의하면, 필드 서비스 관리 시장 규모는 2025년 56억 6,000만 달러로 평가되었습니다. 2026년에는 62억 6,000만 달러로 확대되어 2026-2031년에 걸쳐 CAGR 9.54%로 성장을 지속하여, 2031년에는 98억 7,000만 달러에 이를 것으로 예측됩니다.

본 보고서는 배포 유형(On-Premise, 클라우드), 조직 규모(대기업, 중소기업), FSM 솔루션·서비스 유형(스케줄링, 배차, 경로 최적화, 서비스 계약 관리, 작업 지시서 관리, 기타), 최종 사용자 산업(IT 및 통신, 기타), 지역별로 분류되어 있습니다. 시장 예측은 금액(달러) 기준으로 제시되어 있습니다.
세계의 필드 서비스 관리 시장 동향 및 인사이트
유틸리티·통신 산업에서 기술자의 실시간 가시화 요구
유틸리티 및 통신 사업자는 GPS 센서, 모바일 앱, 지오펜싱을 일상 업무에 통합하여 위치 정보, 도착 시간, 작업 상황을 실시간으로 추적함으로써 복구 속도 향상과 SLA 준수율 제고를 실현하고 있습니다. 스마트 그리드에 대한 투자를 통해 이상 알림이 직접 작업 지시서로 전환되어 정전 시간 단축과 벌금 비용 절감으로 이어지고 있습니다. 변압기나 기지국에 설치된 IoT 기기와 필드 서비스 플랫폼 간의 연동을 통해 티켓이 자동 생성되어, 전화로 차량 배차 시 발생하는 지연이 해소되고 있습니다. 클라우드 대시보드에서는 자산 상태 데이터와 작업원의 가용 상황을 통합할 수 있게 되어, 폭풍으로 인한 피해가 확대되는 경우에도 감독자는 근무 중 작업 팀의 경로를 변경할 수 있게 되었습니다. 정전 장기화에 대해 벌금을 부과하는 유럽 규제 당국의 존재 역시 예측형 파견 도구 도입을 더욱 뒷받침하고 있습니다. 그 결과, 각 유틸리티체는 자산의 원격 측정 데이터, 작업자 일정, 고객 연락 정보를 동기화하는 통합형 클라우드 플랫폼으로 종이 게시판을 대체하고 있습니다.
대규모 5G 구축으로 인한 현장 복잡성 증가
세계적인 5G 확장에 따라 스몰 셀 사이트와 엣지 노드가 급증하고 있으며, 각각 정밀한 위치 조정과 빈번한 유지보수가 필요해졌습니다. 매크로 타워와 달리 이러한 자산은 전신주나 옥상에 분산되어 설치되어 있어, 기존 파견 모델에 큰 부담을 주고 있습니다. 현재 필드 서비스 채널 결정 알고리즘은 인접한 사이트를 그룹화하여, 한 명의 기술자가 한 번의 이동으로 여러 작업을 완료할 수 있도록 함으로써 출장 횟수를 최대 20%까지 줄이고 있습니다. 공장 내 사설 5G 네트워크에서는 24시간 365일 가동 보장이 요구되므로, 1시간 이하의 평균 복구 시간(MTTR)이라는 벤치마크를 유지하기 위해서는 예측형 스케줄링이 필수적입니다. 5G 장비와 동일한 시설 내에 설치된 엣지 데이터센터의 경우, 냉각 시스템 고장이나 정전이 여러 테넌트에 동시에 영향을 미치기 때문에 그 중요성은 더욱 커지고 있습니다. 그 결과, 사업자들은 더욱 엄격해진 서비스 대응 시간대를 충족하고 유지보수 비용을 관리하기 위해 AI를 활용한 스케줄링과 AR을 활용한 수리 가이드를 도입하고 있습니다.
공공 부문의 사이버 보안 및 데이터 주권 관련 장벽
정부 조달 담당자들은 엄격한 데이터 거주지 규정과 제로 트러스트 의무를 부과하고 있으며, 이로 인해 조달 주기가 장기화되고 있습니다. 벤더는 NIST CSF와 같은 프레임워크를 준수하는 암호화, ID 관리, 사고 대응 절차서를 제시해야 하며, 이로 인해 판매 주기가 최대 9개월까지 소요될 수 있습니다. 유럽연합(EU)에서는 ‘데이터법’에 따라 클라우드 공급자가 운영 데이터의 현지화를 의무화하고 있어, 인프라 비용을 상승시키고 다국적 확장을 제한하고 있습니다. 인증된 주권 클라우드 지역을 보유하지 않은 중소 벤더는 입찰에서 배제될 우려가 있으며, 그 결과 시장 점유율은 소수의 하이퍼스케일 기업에 집중되고 있습니다. 이러한 장벽은 중요 인프라 데이터를 다루는 공공 서비스 및 운송 분야의 도입을 특히 지연시키고 있습니다.
부문별 분석
클라우드 솔루션은 2025년 매출의 64.29%를 차지했으며, 연평균 성장률(CAGR) 10.58%로 성장할 것으로 전망되어 On-Premise형 솔루션을 앞지르는 추세입니다. 이러한 우위 덕분에 클라우드는 필드 서비스 관리 시장 규모 전망에서 중심적인 위치를 차지하고 있습니다. 유틸리티자는 폭풍우 대응으로 인한 수요 급증 시 탄력적인 라이선싱의 혜택을 받아 서버 조달 지연을 피할 수 있습니다. 분기별 기능 릴리스를 통해 AI 기반 경로 최적화, 절차 설명 동영상 가이드, 모바일 UI 업그레이드가 기존 업그레이드 주기보다 신속하게 제공됩니다. 통합 API는 CRM 및 ERP 제품군과의 연동을 효율화하여 고객 데이터, 재무 데이터, 자산 데이터를 단일 워크플로우로 통합합니다. On-Premise 배포는 국방 부문이나 주권 네트워크가 필수로 요구되는 규제가 엄격한 공공 부문에서 여전히 지속되고 있습니다. 방화벽 내부에서 기밀성이 높은 로직을 호스팅하면서 패턴 인식을 위해 클라우드 분석을 활용하는 하이브리드 모델이 타협안으로 부상하고 있습니다. 세분화된 도입 옵션을 제공하는 벤더는 특히 관할 구역을 넘나드는 유연성이 필요한 다국적 기업 그룹에서 수주율을 높이고 있습니다. 데이터 주권에 관한 법규제가 엄격해지는 가운데, 지역 고유의 클라우드 노드는 차별화 요소라기보다는 필수 조건이 되어가고 있습니다.
클라우드의 확대로 인해 예측 유지보수 분석이나 증강현실(AR)을 통한 가이드와 같은 부가가치 모듈의 업셀링 기회가 벤더에게 더욱 확대되고 있습니다. 주요 플랫폼 주변 시장 생태계에는 현재 예비 부품 카탈로그부터 기상 경보 피드에 이르기까지 수백 개의 인증된 커넥터가 등록되어 있습니다. 이러한 개방성 덕분에 중견 기업 도입 업체의 경우 맞춤형 통합 비용이 절감되고, 가치 실현까지 걸리는 시간이 단축됩니다. 또한, 구독형 가격 책정 방식은 현금 지출과 실현되는 가치가 연동되므로, 자본 지출(CAPEX) 최적화에 주력하는 CFO에게 매력적입니다. 이러한 요인들이 종합적으로 작용하여, 예측 기간 동안 필드 서비스 관리 시장에서 시장 점유율과 성장 속도 양면 모두에서 클라우드 부문의 우위가 유지될 것입니다.
대기업은 ERP 및 공급망 시스템과 깊이 통합된 복잡한 다중 사이트 구축을 배경으로 2025년 매출의 57.55%를 차지했습니다. 그 규모에 힘입어 필드 서비스 관리 시장의 상위 계층 시장 규모가 확대되고 있으며, 여러 언어를 지원하고 수천 명의 기술자가 참여하는 프로젝트도 존재합니다. 한편, 중소기업은 연평균 성장률(CAGR) 10.12%로 성장하고 있으며, 시장 침투율 격차는 줄어들고 있습니다. 기술자 1인당 월 50달러 전후의 엔트리 레벨 요금제는 초기 투자 장벽을 낮출 뿐만 아니라, 장기간의 변경 관리 프로그램 없이도 도입할 수 있을 정도로 직관적인 모바일 앱을 포함하고 있습니다. HVAC, 배관, 시설 관리 서비스 분야의 지역 계약업체들은 이러한 요금제를 채택하여 클립보드와 스프레드시트를 없애고, 파견 효율 향상이라는 즉각적인 성과를 실현하고 있습니다. 각 벤더사는 제품 라인을 ‘엔터프라이즈’ 버전과 ‘그로스’ 버전으로 구분하는 경향이 강해지고 있으며, 전자에게는 AI 분석 및 샌드박스 환경을, 후자에게는 템플릿화된 워크플로우와 셀프 서비스 기반 설정을 제공합니다. MSP나 회계 소프트웨어 유통업체 등의 채널 파트너는 중소기업으로의 확장에 있어 매우 중요한 역할을 수행하고 있으며, 필드 서비스 기능을 보다 광범위한 디지털 전환 패키지에 통합하고 있습니다.
혁신의 관점에서 볼 때, 중소기업 부문은 관료주의보다 민첩성이 중시되기 때문에 로우코드 워크플로우 빌더나 음성 입력을 통한 작업 지시서 작성의 시험장으로 기능하는 경우가 많습니다. 이러한 민첩한 도입을 통해 벤더가 인근 지역 시장 진출에 활용할 수 있는 성공 사례가 창출되며, 성장이 가속화됩니다. 중소기업에서의 활용이 확대됨에 따라 데이터량이 증가하고 AI 모델이 학습되며, 그 인사이트력이 공유됨으로써 전체 고객 기반이 혜택을 받게 됩니다. 그 결과, 중소기업 부문의 성장세는 필드 서비스 관리 시장 전체에 구조적인 호재로 작용하고 있습니다.
지역별 분석
북미는 2025년 전 세계 매출의 37.89%를 차지했습니다. 이는 첨단 통신 인프라, 광범위한 스마트 그리드 도입, 현장 모듈을 통합한 성숙한 ERP 도입 기반이 교차하는 위치에 있기 때문입니다. 투자자 소유의 유틸리티 회사는 2025년에 송전 및 배전 설비 업그레이드에 284억 달러를 투자하여 정전 관리 디스패치 도구에 대한 꾸준한 수요를 창출했습니다(eia.gov). 항공우주 및 제조 산업에서는 증강현실(AR)을 활용한 원격 지원 도입이 가속화되어, 전문가가 현장에 직접 방문하지 않고도 현장 기술자에게 지도를 제공할 수 있게 되었습니다. 캐나다의 유틸리티자들은 충전기의 가동률 향상을 도모하기 위해 전기차 충전 네트워크와의 FSM(필드 서비스 관리) 통합을 검토 및 도입하고 있는 반면, 멕시코에서는 서비스가 미치지 않는 지역의 광섬유망 확장에 오프라인에서 작동 가능한 모바일 앱이 활용되고 있습니다.
아시아태평양은 중국의 스마트 제조에 대한 의지, 인도의 ‘디지털 인디아’ 구상, 일본의 ‘사회 5.0’ 구상에 힘입어 2031년까지 연평균 성장률(CAGR) 9.93%를 나타낼 것으로 예측됩니다. 중국에서의 스마트 계량기 대규모 도입은 설치 및 유지보수 수요를 창출하고 있으며, 이는 FSM 플랫폼으로 직접 연결되고 있습니다. 인도 정부의 클라우드 소프트웨어 도입에 대한 보조금은 소규모 기업의 진입 장벽을 낮추고, HVAC(냉난방 공조) 및 전기 공사 도급업체 간의 풀뿌리 수준의 디지털화를 촉진하고 있습니다. 일본은 AI를 활용한 스케줄링과 로봇 통합을 통해 인력 부족 문제를 해결하고 있으며, 전체 인프라 자산에 걸쳐 인간과 드론에 의한 점검을 연계하고 있습니다. 호주 및 뉴질랜드는 저지구 궤도 위성 통신을 활용하여 외딴 지역의 광산 및 유틸리티 네트워크의 유지 관리를 수행하고 있습니다.
필드 서비스 관리 시장의 나머지 점유율은 유럽, 남미, 중동 및 아프리카가 차지하고 있습니다. 유럽에서는 ‘청정 에너지 패키지’에 따른 엄격한 신뢰성 기준으로 인해 유틸리티자들이 예측형 배차 및 엣지 분석 도입을 서두르고 있습니다. 독일의 기존 플랜트에서는 진동 이상을 감지하여 현장 티켓을 발행하는 엣지 게이트웨이를 설비에 사후 장착하여 가동 중단 시간을 줄이고 있습니다. 남미의 통신 사업자들은 브라질과 아르헨티나에서 진행 중인 대규모 광섬유 설치 작업을 조정하기 위해 FSM을 도입하고 있는 반면, 중동의 석유 생산 기업들은 위성 지원 플랫폼을 활용하여 해상 시추 장비의 유지보수를 수행하고 있습니다. 남아프리카의 광산에서는 자율 주행형 운반 트럭의 예측 유지보수가 시험적으로 도입되고 있어, 이 지역에서 기술의 고도화가 진행되고 있음을 엿볼 수 있습니다.
기타 혜택
- 엑셀 형식 시장 예측(ME) 시트
- 3개월간의 애널리스트 지원
자주 묻는 질문
목차
제1장 서론
제2장 조사 방법
제3장 주요 요약
제4장 시장 구도
제5장 시장 규모 및 성장 예측
제6장 경쟁 구도
제7장 시장 기회 및 향후 전망
KTH 26.09.08According to Mordor Intelligence, the field service management market size is expected to grow from USD 5.66 billion in 2025 to USD 6.26 billion in 2026 and is forecast to reach USD 9.87 billion by 2031 at 9.54% CAGR over 2026-2031.
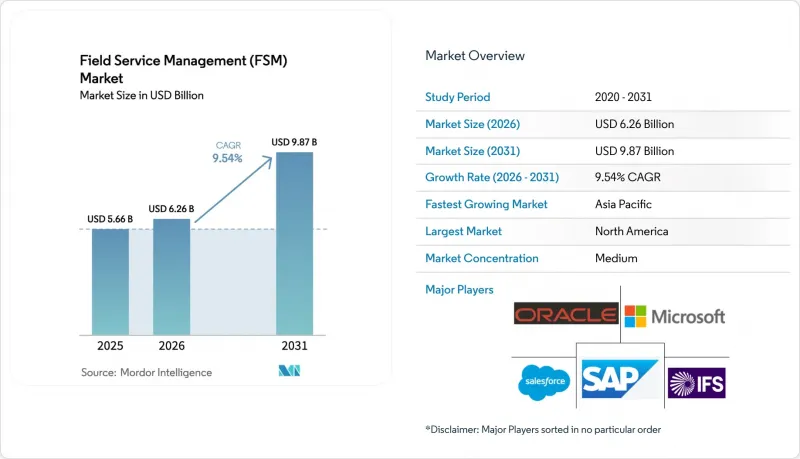
This report is Segmented by Deployment Type (On-Premise, and Cloud), Organization Size (Large Enterprises, and Small and Medium Enterprises), FSM Solution and Service Type (Scheduling, Dispatch and Route Optimization, Service Contract Management, Work-Order Management, and More), End-User Vertical (IT and Telecom, and More), Geography. The Market Forecasts are Provided in Terms of Value (USD).
Global Field Service Management (FSM) Market Trends and Insights
Real-time Technician Visibility Needs across Utilities And Telecom
Utilities and telecom carriers are embedding GPS sensors, mobile apps, and geofencing into daily workflows to track location, arrival times, and job status in real time, enabling faster restoration and higher SLA compliance. Smart-grid investments translate anomaly alerts directly into work orders, shortening outage duration and trimming penalty costs. Integration between IoT devices on transformers or cell sites and field service platforms auto-generates tickets, eliminating phone dispatch delays. Cloud dashboards now merge asset-health data with workforce availability so supervisors can reroute crews mid-shift when storm damage escalates. European regulators that levy fines for prolonged outages further motivate the adoption of predictive dispatch tools. As a result, utilities are replacing paper boards with unified cloud platforms that synchronize asset telemetry, workforce calendars, and customer messaging.
Large-scale 5G Roll-outs Raising Field Complexity
Global 5G expansion is multiplying small-cell sites and edge nodes, each requiring precision alignment and frequent maintenance. Unlike macro towers, these assets are dispersed on poles and rooftops, stressing legacy dispatch models. Field service routing algorithms now cluster proximate sites so a single technician can complete multiple jobs per trip, cutting truck rolls up to 20%. Private 5G networks in factories add round-the-clock uptime guarantees, making predictive scheduling indispensable for maintaining sub-hour MTTR benchmarks. Edge data centers co-located with 5G equipment raise the stakes further, as cooling or power failures jeopardize multiple tenants simultaneously. Consequently, operators adopt AI-driven scheduling and AR-assisted repair guides to meet tighter service windows and control maintenance costs.
Cyber-security and Data-sovereignty Barriers in the Public Sector
Government buyers impose strict data-residency rules and zero-trust mandates that lengthen procurement cycles. Vendors must demonstrate encryption, identity management, and incident-response playbooks compliant with frameworks such as NIST CSF, extending sales cycles up to nine months. In the European Union, the Data Act obliges cloud providers to localize operational data, inflating infrastructure costs and limiting multi-country rollouts. Smaller vendors lacking certified sovereign-cloud regions face exclusion from tenders, concentrating share among a few hyperscale players. These barriers particularly slow adoption in utilities and transit agencies that handle critical infrastructure data.
Other drivers and restraints analyzed in the detailed report include:
- OEM Servitization Models Creating Recurring Revenue Streams
- Ageing Workforce Accelerating AI-assisted Scheduling
- Legacy ERP and OT Integration Complexity in Brownfield Plants
For complete list of drivers and restraints, kindly check the Table Of Contents.
Segment Analysis
Cloud solutions generated 64.29% of 2025 revenue and are projected to grow at a 10.58% CAGR, outpacing on-premise alternatives. This dominance positions cloud at the heart of the field service management market size forecast. Utilities benefit from elastic licensing during storm-response surges, avoiding server procurement delays. Quarterly feature releases deliver AI route optimization, walk-through video guides, and mobile UI upgrades faster than traditional upgrade cycles. Integration APIs streamline linking with CRM and ERP suites, unifying customer, financial, and asset data in a single workflow. On-premise deployments persist in defense and highly regulated public-sector contexts where sovereign networks are mandatory. Hybrid models are emerging as a compromise, hosting sensitive logic behind the firewall while leveraging cloud analytics for pattern recognition. Vendors that offer granular deployment options enhance win rates, particularly in multi-national groups needing flexibility across jurisdictions. As data-sovereignty laws tighten, region-specific cloud nodes are becoming table stakes rather than a differentiation.
Cloud expansion reinforces vendor opportunities to upsell value-added modules such as predictive-maintenance analytics and augmented-reality guidance. Marketplace ecosystems around leading platforms now list hundreds of certified connectors, ranging from spare-parts catalogs to weather-alert feeds. This openness lowers custom-integration costs for mid-market adopters, accelerating time to value. Additionally, subscription pricing aligns cash outflows with value realized, appealing to CFOs focused on capex optimization. In aggregate, these factors sustain the cloud segment's lead in both field service management market share and growth velocity through the forecast horizon.
Large enterprises accounted for 57.55% of 2025 revenue on the strength of complex, multi-site deployments deeply integrated with ERP and supply-chain systems. Their scale amplifies the field service management market size at the top end, with projects spanning thousands of technicians in multiple languages. Conversely, small and medium enterprises are expanding at a 10.12% CAGR, narrowing the penetration gap. Entry-level plans priced near USD 50 per technician per month remove capital hurdles and include mobile apps intuitive enough to deploy without lengthy change-management programs. Regional contractors in HVAC, plumbing, and facilities services adopt these tiers to eliminate clipboards and spreadsheets, realizing immediate wins in dispatch efficiency. Vendors increasingly segment product lines into "enterprise" and "growth" editions, bundling AI analytics and sandbox environments for the former, while offering templatized workflows and self-service setup for the latter. Channel partners such as MSPs and accounting-software resellers play a pivotal role in SME outreach, embedding field service features into broader digital-transformation bundles.
From an innovation standpoint, the SME cohort often serves as a proving ground for low-code workflow builders and voice-to-text work-order entry, as agility trumps bureaucracy. These agile deployments create reference logos that vendors use to penetrate adjacent regional markets, compounding growth. As SME usage scales, data volumes train AI models, benefiting the entire customer base via pooled learning. Consequently, SME momentum constitutes a structural tailwind for the overall field service management market.
Complete Report Scope:
- By Deployment Type
- On-premise
- Cloud
- By Organization Size
- Large Enterprises
- Small and Medium Enterprises
- By FSM Solution and Service Type
- Solutions
- Scheduling, Dispatch and Route Optimization
- Service Contract Management
- Work-order Management
- Customer Management
- Inventory Management
- Other Software (Billing, Invoicing, Warranty)
- Services (Integration, Implementation, Support)
- Solutions
- By End-User Vertical
- Facilities Management (Hard-FM and Soft-FM)
- IT and Telecom
- Healthcare and Life Sciences
- Energy and Utilities
- Oil and Gas
- Manufacturing
- Transportation and Logistics
- Real Estate and Others
- By Geography
- North America
- United States
- Canada
- Mexico
- South America
- Brazil
- Argentina
- Chile
- Peru
- Rest of South America
- Europe
- Germany
- United Kingdom
- France
- Italy
- Spain
- Rest of Europe
- Asia-Pacific
- China
- Japan
- South Korea
- India
- Australia
- New Zealand
- Rest of Asia-Pacific
- Middle East and Africa
- United Arab Emirates
- Saudi Arabia
- Turkey
- South Africa
- Rest of Middle East and Africa
- North America
Geography Analysis
North America generated 37.89% of global revenue in 2025, positioned at the intersection of advanced telecom infrastructure, widespread smart-grid roll-outs, and a mature ERP installed base that bundles field modules. Investor-owned utilities invested USD 28.4 billion in transmission and distribution upgrades during 2025, feeding steady demand for outage-management dispatch tools (eia.gov). Augmented-reality remote-assistance adoption is accelerating in aerospace and manufacturing, allowing experts to guide on-site technicians without travel. Canada's utilities pilot FSM integrations with electric-vehicle charging networks to boost charger uptime, while Mexico's fiber expansion in underserved regions relies on mobile apps capable of offline operation.
Asia-Pacific is projected to grow at a 9.93% CAGR through 2031, buoyed by China's smart-manufacturing ambitions, India's Digital India initiative, and Japan's Society 5.0 framework. Massive smart-meter roll-outs in China generate installation and maintenance volumes that feed directly into FSM platforms. India's government grants for cloud software adoption lower barriers for micro-enterprises, fostering grassroots digitization among HVAC and electrical contractors. Japan combats labor shortages with AI scheduling and robotics integration, coordinating human and drone inspections across infrastructure assets. Australia and New Zealand leverage low-Earth-orbit satellite connectivity to manage maintenance in remote mining and utility networks.
Europe, South America, and the Middle East and Africa account for the remaining share of the field service management market. Europe's stringent reliability standards under the Clean Energy Package prompt utilities to adopt predictive dispatch and edge analytics. Germany's brownfield plants retrofit equipment with edge gateways that trigger field tickets on vibration anomalies, cutting downtime. South American telecom operators deploy FSM to coordinate large-scale fiber builds in Brazil and Argentina, while Middle Eastern oil producers use satellite-enabled platforms to service offshore rigs. South Africa's mines experiment with predictive maintenance for autonomous haul trucks, indicating rising regional sophistication.
- Oracle Corp. (Oracle Field Service)
- Salesforce Inc. (Field Service)
- Microsoft Corp. (Dynamics 365 Field Service)
- SAP SE (Coresystems)
- IFS AB
- ServiceMax Inc. (PTC)
- ServicePower PLC
- Trimble Inc.
- FieldAware US Inc.
- Accruent LLC (Fortive)
- Zinier Inc.
- simPRO Group Pty Ltd.
- OverIT S.p.A.
- Praxedo SA
- KloudGin Inc.
- Jobber
- FieldEZ Technologies
- ProntoForms Corp.
- Zuper Inc.
- KloudGin Inc.
Additional Benefits:
- The market estimate (ME) sheet in Excel format
- 3 months of analyst support
TABLE OF CONTENTS
1 INTRODUCTION
- 1.1 Study Assumptions and Market Definition
- 1.2 Scope of the Study
2 RESEARCH METHODOLOGY
3 EXECUTIVE SUMMARY
4 MARKET LANDSCAPE
- 4.1 Market Overview
- 4.2 Market Drivers
- 4.2.1 Real-time Technician Visibility Needs across Utilities and Telecom
- 4.2.2 Large-scale 5G Roll-outs Raising Field Complexity
- 4.2.3 Decarbonization Push Driving Smart-Meter and EV-Charger Installs
- 4.2.4 Ageing Workforce Accelerating AI-assisted Scheduling
- 4.2.5 OEM Servitization Models Creating Recurring Revenue Streams
- 4.2.6 Remote-work Safety Rules Fueling AR-based Remote Assistance
- 4.3 Market Restraints
- 4.3.1 Cyber-security and Data-sovereignty Barriers in Public Sector
- 4.3.2 Legacy ERP/OT Integration Complexity in Brownfield Plants
- 4.3.3 Up-front Subscription and Change-management Costs for SMEs
- 4.3.4 Cross-border Regulatory Fragmentation Hindering AI Dispatch
- 4.4 Regulatory Outlook
- 4.5 Porter's Five Forces Analysis
- 4.5.1 Bargaining Power of Suppliers
- 4.5.2 Bargaining Power of Buyers
- 4.5.3 Threat of New Entrants
- 4.5.4 Threat of Substitutes
- 4.5.5 Intensity of Competitive Rivalry
- 4.6 Impact of Macroeconomic Shocks (incl. COVID-19 and Supply Chain)
- 4.7 Field Use-Case Evolution (AR/VR, Predictive Maintenance, Automation)
- 4.8 Buyer Imperatives Analysis
5 MARKET SIZE AND GROWTH FORECASTS (VALUE)
- 5.1 By Deployment Type
- 5.1.1 On-premise
- 5.1.2 Cloud
- 5.2 By Organization Size
- 5.2.1 Large Enterprises
- 5.2.2 Small and Medium Enterprises
- 5.3 By FSM Solution and Service Type
- 5.3.1 Solutions
- 5.3.1.1 Scheduling, Dispatch and Route Optimization
- 5.3.1.2 Service Contract Management
- 5.3.1.3 Work-order Management
- 5.3.1.4 Customer Management
- 5.3.1.5 Inventory Management
- 5.3.1.6 Other Software (Billing, Invoicing, Warranty)
- 5.3.2 Services (Integration, Implementation, Support)
- 5.3.1 Solutions
- 5.4 By End-User Vertical
- 5.4.1 Facilities Management (Hard-FM and Soft-FM)
- 5.4.2 IT and Telecom
- 5.4.3 Healthcare and Life Sciences
- 5.4.4 Energy and Utilities
- 5.4.5 Oil and Gas
- 5.4.6 Manufacturing
- 5.4.7 Transportation and Logistics
- 5.4.8 Real Estate and Others
- 5.5 By Geography
- 5.5.1 North America
- 5.5.1.1 United States
- 5.5.1.2 Canada
- 5.5.1.3 Mexico
- 5.5.2 South America
- 5.5.2.1 Brazil
- 5.5.2.2 Argentina
- 5.5.2.3 Chile
- 5.5.2.4 Peru
- 5.5.2.5 Rest of South America
- 5.5.3 Europe
- 5.5.3.1 Germany
- 5.5.3.2 United Kingdom
- 5.5.3.3 France
- 5.5.3.4 Italy
- 5.5.3.5 Spain
- 5.5.3.6 Rest of Europe
- 5.5.4 Asia-Pacific
- 5.5.4.1 China
- 5.5.4.2 Japan
- 5.5.4.3 South Korea
- 5.5.4.4 India
- 5.5.4.5 Australia
- 5.5.4.6 New Zealand
- 5.5.4.7 Rest of Asia-Pacific
- 5.5.5 Middle East and Africa
- 5.5.5.1 United Arab Emirates
- 5.5.5.2 Saudi Arabia
- 5.5.5.3 Turkey
- 5.5.5.4 South Africa
- 5.5.5.5 Rest of Middle East and Africa
- 5.5.1 North America
6 COMPETITIVE LANDSCAPE
- 6.1 Strategic Developments
- 6.2 Vendor Positioning Analysis
- 6.3 Company Profiles (includes Global level Overview, Market level overview, Core Segments, Financials as available, Strategic Information, Products and Services, and Recent Developments)
- 6.3.1 Oracle Corp. (Oracle Field Service)
- 6.3.2 Salesforce Inc. (Field Service)
- 6.3.3 Microsoft Corp. (Dynamics 365 Field Service)
- 6.3.4 SAP SE (Coresystems)
- 6.3.5 IFS AB
- 6.3.6 ServiceMax Inc. (PTC)
- 6.3.7 ServicePower PLC
- 6.3.8 Trimble Inc.
- 6.3.9 FieldAware US Inc.
- 6.3.10 Accruent LLC (Fortive)
- 6.3.11 Zinier Inc.
- 6.3.12 simPRO Group Pty Ltd.
- 6.3.13 OverIT S.p.A.
- 6.3.14 Praxedo SA
- 6.3.15 KloudGin Inc.
- 6.3.16 Jobber
- 6.3.17 FieldEZ Technologies
- 6.3.18 ProntoForms Corp.
- 6.3.19 Zuper Inc.
- 6.3.20 KloudGin Inc.
7 MARKET OPPORTUNITIES AND FUTURE OUTLOOK
- 7.1 White-space and Unmet-need Assessment