

|
시장보고서
상품코드
2122706
임상 진단 : 시장 점유율 분석, 업계 동향 및 통계, 성장 예측(2026-2031년)Clinical Diagnostics - Market Share Analysis, Industry Trends & Statistics, Growth Forecasts (2026 - 2031) |
||||||
 Mordor Intelligence
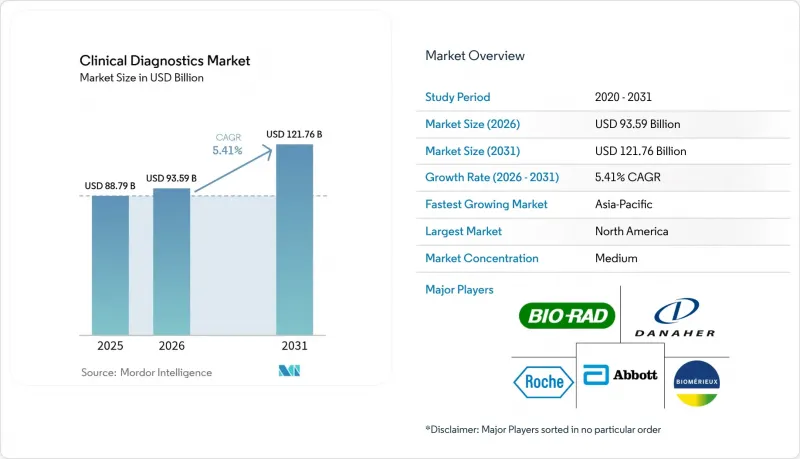
Mordor Intelligence에 의하면, 임상 진단 시장 규모는 2025년 887억 9,000만 달러로 평가되었습니다. 2026년에는 935억 9,000만 달러로 확대되어 2026-2031년에 걸쳐 CAGR 5.41%로 성장을 지속하여, 2031년에는 1,217억 6,000만 달러에 이를 것으로 예측됩니다.

본 보고서는 검사 유형별(지질 패널, 기타), 제품별(기기·분석 장비, 시약 및 키트, 기타), 기술별(임상화학, 기타), 검체 유형별(소변, 기타),실시 환경별(집중형 임상검사실, 기타), 최종 사용자별(병원 검사실, 현장 진단(POC) 환경, 기타), 지역별(북미, 유럽, 기타)로 분류되어 있습니다. 시장 예측은 금액(달러) 기준으로 제시되어 있습니다.
세계의 임상 진단 시장 동향 및 인사이트
AI를 활용한 임상 의사결정 지원의 통합
현재, 인공지능(AI) 모듈은 수백만 건에 달하는 익명화된 검사 기록을 면밀히 분석하여, 사람의 눈으로 확인할 때는 간과되기 쉬운 미묘한 진단 패턴을 추출하고 있습니다. 퀘스트 다이아그노스틱스(Quest Diagnostics)와 구글 클라우드(Google Cloud)의 제휴를 통해 복잡한 증례에서 오진률이 30% 가까이 감소하는 동시에, 중요 결과 보고까지 소요되는 시간도 단축되어, 의료 기관들은 AI 기능을 단순한 추가 기능이 아닌 표준 인프라로 인식하고 있습니다. 의사들이 더욱 신속하고 확실한 결과를 제공하는 채널을 요구함에 따라, 조기에 도입한 기관들은 발표 환자 점유율을 더욱 확대되고 있습니다.
멀티오믹스와 정밀 진단을 통한 검사 메뉴 확충
가던트 헬스(Gardant Health)의 종양 프로파일링 검사는 유전체학, 단백질체학, 대사체학의 다층적 데이터가 치료법 선택을 정교화하고, 반복적인 생검을 줄이는 방법을 보여주고 있습니다. 검사 기관은 검체 채취 일정의 통합 및 환자의 순응도 향상을 통해 높은 초기 비용을 정당화하고 있으며, 진단의 정확도가 후속 치료 비용을 명백히 절감함으로써 가치 기반 보상 제도로의 전환을 뒷받침하고 있습니다.
코로나19 사태 이후 재고 과잉으로 인한 장비 교체 둔화
병원들은 팬데믹으로 인한 환자 급증에 대응하기 위해 과도한 분자진단 장비를 구매했습니다. 현재 그 중 상당수의 가동률은 40-60%에 그치고 있어, 새로운 설비 투자가 미뤄지고 있습니다. 애보트 래버러토리스는 고객들이 플랫폼 업그레이드를 하지 않고 기존 재고를 소진하고 있기 때문에 2025년 진단 부문 매출이 감소할 것이라고 밝혔습니다. 가격 경쟁이 격화되어 이익률이 압박받는 한편, 대규모 의료 기관에서는 장비 교체 주기가 18-24개월 연장되고 있습니다.
부문별 분석
종양학 및 종양 마커 검사는 동반 진단의 의무화에 따른 제약 산업과의 협력을 반영하여 연평균 성장률(CAGR) 10.39%를 나타낼 것으로 예측됩니다. CBC는 2025년 임상 진단 시장에서 24.24%의 점유율을 유지하며, 급성기 및 만성기 치료 부문에서 기초 검사량의 안정성을 유지하고 있습니다.
확대되는 다항목 암 패널은 바이오마커를 통합함으로써 워크플로우의 경제성을 향상시키고 있지만, 지질 프로파일 검사의 경우 1차 진료의 소요 시간 기준을 충족하는 휴대용 기기에 의해 대체될 위험에 직면해 있습니다. 감염병 검사 메뉴는 팬데믹 당시의 정점으로부터 정상화되고 있지만, 항생제 내성 모니터링 프로그램에서는 여전히 중요한 역할을 하고 있습니다.
2025년 매출 중 시약 및 키트가 64.98%를 차지했으나, 검사실이 품질 관리 및 규제상 감사 추적을 디지털화함에 따라 데이터 관리 소프트웨어는 연평균 성장률(CAGR) 10.62%의 성장 궤도에 올라섰습니다. 현재 장비에는 오픈 API가 탑재되어 있어, 미들웨어가 검체의 라우팅, 시약 할당, 결과 공개를 실시간으로 조정할 수 있게 되었으며, 설비 투자에 대한 신중한 태도가 지속되는 가운데 자산의 수명을 연장하고 있습니다. 경쟁 입찰로 인해 시약의 이익률이 압박받고 있는 상황에서 각 벤더사는 물리적 소모품이 아닌 워크플로우 효율화를 통해 고객 충성도를 확보하고, 인포매틱스 서비스 구독을 번들로 제공하는 움직임을 보이고 있습니다.
지역별 분석
북미는 1인당 지출액이 높기 때문에 2025년 시장 점유율을 37.98%로 유지했으나, 아시아태평양의 연평균 성장률(CAGR) 10.14%는 의료 접근성 확대와 만성 질환 발생률 상승을 여실히 보여주고 있습니다. 아시아태평양은 공립 병원 확충, 국민건강보험 제도 도입, 1인당 검사 비용을 절감하는 현지 생산에 대한 우대 조치에 힘입어 2026년부터 2031년 사이에 156억 2,000만 달러 이상의 매출 증가가 예상됩니다. 정부의 보조금을 통해 지방의 전문의 부족을 완화하는 분산형 플랫폼이 촉진됨에 따라, 임상 진단 시장은 처음으로 검사를 받는 사용자를 유치하여 두 자릿수 성장을 이끌 수 있게 될 것입니다. 다국적 기업들은 수입 관세를 회피하고 리드타임을 단축하기 위해 지방 자치단체와 제휴하여 시약 충전 시설을 설립하고 있습니다.
북미 시장은 성숙기에 접어들었으나 여전히 기술 선도자로서의 위상을 유지하고 있습니다. AI를 활용한 분자 패널 검사 및 자가 채취 검체의 물류는 시범 프로그램 단계에서 통합 의료 제공 네트워크 내 전체 시스템 프로토콜로 전환되었습니다. 그러나 보험 급여 제한과 사전 승인 의무화가 검사 건수 증가를 억제하고 있습니다. 이에 대응하여 검사 기관들은 정밀 종양학 검사와 성과 기반 계약 하에서 가치를 입증하는 실제 세계 데이터(REW) 자료를 결합하여 대처하고 있습니다. 지역 의료 시스템이 일상 업무를 규모의 경제를 최적화하고 차세대 정보 기술에 투자하는 대형 참조 검사 기관에 외주화하는 움직임이 이어지는 가운데, 산업 재편은 여전히 진행 중입니다.
유럽에서는 이러한 동향에 차이가 나타나고 있습니다. 북유럽 국가들은 예방 의료 예산을 심혈관 질환 및 대사성 질환의 선별 검사에 할당하고 있는 반면, 남유럽 국가들은 재정 긴축 정책으로 어려움을 겪고 있어 고가의 분자 검사의 도입이 제한되고 있습니다. 유럽연합(EU)의 체외진단용 의료기기 규정(IVDR)에 따라 규정 준수 요건이 더욱 강화되면서, 소규모 제조업체들은 수익성이 없는 제품 라인에서 철수할 수밖에 없는 상황에 처해 있습니다. 그럼에도 고령화가 진행되는 인구 동향으로 인해 안정적인 기초 검사량은 확보되고 있으며, 희귀질환 진단에 관한 국경을 초월한 협력이 전문적인 검사 수요를 뒷받침하고 있습니다.
기타 혜택
- 엑셀 형식 시장 예측(ME) 시트
- 3개월간의 애널리스트 지원
자주 묻는 질문
목차
제1장 서론
제2장 조사 방법
제3장 주요 요약
제4장 시장 구도
제5장 시장 규모 및 성장 예측
제6장 경쟁 구도
제7장 시장 기회 및 향후 전망
KTH 26.09.08According to Mordor Intelligence, the clinical diagnostics market size is expected to grow from USD 88.79 billion in 2025 to USD 93.59 billion in 2026 and is forecast to reach USD 121.76 billion by 2031 at 5.41% CAGR over 2026-2031.
This report is Segmented by Test (Lipid Panel, and More), Product (Instruments, Reagents, and More), Technology (Clinical Chemistry, and More), Sample Type (Urine, and More), Setting (Centralized Clinical Laboratories, and More), End User (Hospital Laboratories, Point-Of-Care Settings, and More), and Geography (North America, Europe, and More). The Market Forecasts are Provided in Terms of Value (USD).
Global Clinical Diagnostics Market Trends and Insights
AI-Driven Clinical Decision Support Integration
Artificial-intelligence modules now sift millions of anonymized laboratory records to surface subtle diagnostic patterns that human review often misses. Quest Diagnostics' alliance with Google Cloud cut complex-case error rates by nearly 30% while trimming turnaround times for critical values, prompting providers to view AI capacity as standard infrastructure rather than an add-on. Early adopters further gain referral share as physicians gravitate to faster and more confident result-delivery pathways.
Multi-Omics & Precision Diagnostics Expand Test Menus
Guardant Health's tumor-profiling assay illustrates how layered genomic, proteomic, and metabolomic data sharpen therapy selection and reduce repeated biopsies. Laboratories justify higher up-front costs through consolidated sampling schedules and improved adherence, supporting the shift toward value-based reimbursement where diagnostic precision demonstrably lowers downstream treatment expense.
Post-COVID Inventory Glut Slows Instrument Replacement
Hospitals bought redundant molecular analyzers to cope with pandemic surges; many now run at 40-60% capacity, delaying new capital allocation. Abbott Laboratories disclosed lower 2025 diagnostics revenue as customers exhaust existing stocks instead of upgrading platforms. Price competition grows, compressing margins and elongating replacement cycles by 18-24 months at larger systems.
Other drivers and restraints analyzed in the detailed report include:
- Hospital-At-Home Models Fuel Rapid Specimen-to-Answer Demand
- Expansion of Decentralized Point-of-Care Testing in Emerging Markets
- Constrained Reimbursement & Cost-Containment Policies
For complete list of drivers and restraints, kindly check the Table Of Contents.
Segment Analysis
Oncology & tumor marker assays are forecast to post a 10.39% CAGR, reflecting pharmaceutical alignment with companion-diagnostic mandates. CBC maintained a 24.24% 2025 clinical diagnostics market share, sustaining base-volume stability in acute and chronic-care pathways.
Expanding multi-parameter oncology panels improve workflow economics by consolidating biomarkers, while lipid profiles face substitution risk from handheld devices that satisfy primary-care turnaround criteria. Infectious-disease menus normalize after pandemic highs yet remain critical in antimicrobial-resistance surveillance programs.
Reagents & kits delivered 64.98% of 2025 revenue, yet data-management software is on track for a 10.62% CAGR as laboratories digitize quality control and regulatory audit trails. Instruments now ship with open APIs that allow middleware to orchestrate sample routing, reagent allocation, and result release in real time, extending asset life amid capital-spending caution. Competitive bidding squeezes reagent margins, prompting vendors to bundle informatics subscriptions that lock in customer loyalty through workflow efficiencies rather than physical consumables.
Complete Report Scope:
- By Test
- Lipid Panel
- Liver Panel
- Renal Panel
- Complete Blood Count (CBC)
- Electrolyte Testing
- Infectious Disease Testing
- Oncology & Tumor Marker Testing
- Companion Diagnostics
- Other Tests
- By Product
- Instruments/Analyzers
- Reagents & Kits
- Data-Management Software & Services
- By Technology
- Clinical Chemistry
- Immunoassay & Immunochemistry
- Molecular Diagnostics
- Hematology
- Coagulation & Hemostasis
- Microbiology
- Urinalysis
- Others (Mass-Spec, Flow Cytometry)
- By Sample Type
- Blood/Plasma/Serum
- Urine
- Saliva
- Tissue/Biopsy
- Other Specimens
- By Setting
- Centralized Clinical Laboratories
- Point-of-Care Testing Sites
- Home-based Testing
- By End User
- Hospital Laboratories
- Independent Diagnostic Laboratories
- Point-of-Care Settings
- Physician Office Laboratories
- Other End Users
- Geography
- North America
- United States
- Canada
- Mexico
- Europe
- Germany
- United Kingdom
- France
- Italy
- Spain
- Rest of Europe
- Asia-Pacific
- China
- Japan
- India
- South Korea
- Australia
- Rest of Asia-Pacific
- Middle East and Africa
- GCC
- South Africa
- Rest of Middle East and Africa
- South America
- Brazil
- Argentina
- Rest of South America
- North America
Geography Analysis
North America retained 37.98% 2025 share on high per-capita spending, but Asia-Pacific's 10.14% CAGR underscores widening access and rising chronic-disease incidence. Asia-Pacific is projected to add more than USD 15.62 billion in incremental revenue between 2026 and 2031, buoyed by public-hospital expansion, universal-health-coverage rollouts, and local manufacturing incentives that reduce test cost per capita. Government subsidies encourage decentralized platforms that mitigate specialist shortages in rural districts, allowing the clinical diagnostics market to tap first-time users and drive double-digit unit growth. Multinationals partner with provincial authorities to establish reagent-filling facilities aimed at circumventing import tariffs and shortening lead times.
North America, while mature, remains a technology bellwether. AI-enabled molecular panels and home-specimen logistics have moved from pilot programs to system-wide protocols at integrated-delivery networks. Yet reimbursement constraints and prior-authorization mandates temper volume growth. Laboratories respond by pairing precision oncology tests with real-world-evidence dossiers that justify value under outcome-based contracts. Consolidation persists as regional health systems outsource routine work to large reference labs that optimize scale and invest in next-generation informatics.
Europe faces divergent trajectories: northern countries channel preventive-care budgets into cardiovascular and metabolic-disease screening, whereas southern nations grapple with fiscal austerity that limits adoption of high-priced molecular assays. The European Union's In Vitro Diagnostic Regulation (IVDR) further elevates compliance requirements, prompting smaller manufacturers to exit sub-scale product lines. Still, aging demographics assure steady baseline volume, and cross-border collaborations on rare-disease diagnostics sustain specialized test demand.
- Abbott Laboratories
- Roche
- Siemens Healthineers
- Danaher Corporation (Beckman Coulter, Cepheid)
- Thermo Fisher Scientific
- Beckton Dickinson
- bioMerieux
- Bio-Rad Laboratories
- Hologic
- QIAGEN
- Quest Diagnostics
- Sysmex
- Sonic Healthcare
- Illumina
- PerkinElmer (Revvity) Inc.
- DiaSorin
- Ortho Clinical Diagnostics (QuidelOrtho)
- LabCorp
- GenMark Diagnostics
- Randox Laboratories
Additional Benefits:
- The market estimate (ME) sheet in Excel format
- 3 months of analyst support
TABLE OF CONTENTS
1 Introduction
- 1.1 Study Assumptions & Market Definition
- 1.2 Scope of the Study
2 Research Methodology
3 Executive Summary
4 Market Landscape
- 4.1 Market Overview
- 4.2 Market Drivers
- 4.2.1 Rising Prevalence Of Chronic & Infectious Diseases
- 4.2.2 Adoption Of High-Throughput Automated Analyzers
- 4.2.3 Expansion Of Decentralized Poc Testing In Emerging Markets
- 4.2.4 AI-Driven Clinical Decision Support Integration
- 4.2.5 Multi-Omics & Precision Diagnostics Expand Test Menus
- 4.2.6 Hospital-At-Home Models Fuel Rapid Specimen-To-Answer Demand
- 4.3 Market Restraints
- 4.3.1 High Capital Cost Of Advanced Analyzers
- 4.3.2 Constrained Reimbursement & Cost-Containment Policies
- 4.3.3 Post-COVID Inventory Glut Slows Instrument Replacement
- 4.3.4 Supply-Chain Bottlenecks For Specialty Reagents
- 4.4 Technological Outlook
- 4.5 Porter's Five Forces Analysis
- 4.5.1 Threat of New Entrants
- 4.5.2 Bargaining Power of Buyers/Consumers
- 4.5.3 Bargaining Power of Suppliers
- 4.5.4 Threat of Substitute Products
- 4.5.5 Intensity of Competitive Rivalry
5 Market Size & Growth Forecasts (Value, USD)
- 5.1 By Test
- 5.1.1 Lipid Panel
- 5.1.2 Liver Panel
- 5.1.3 Renal Panel
- 5.1.4 Complete Blood Count (CBC)
- 5.1.5 Electrolyte Testing
- 5.1.6 Infectious Disease Testing
- 5.1.7 Oncology & Tumor Marker Testing
- 5.1.8 Companion Diagnostics
- 5.1.9 Other Tests
- 5.2 By Product
- 5.2.1 Instruments/Analyzers
- 5.2.2 Reagents & Kits
- 5.2.3 Data-Management Software & Services
- 5.3 By Technology
- 5.3.1 Clinical Chemistry
- 5.3.2 Immunoassay & Immunochemistry
- 5.3.3 Molecular Diagnostics
- 5.3.4 Hematology
- 5.3.5 Coagulation & Hemostasis
- 5.3.6 Microbiology
- 5.3.7 Urinalysis
- 5.3.8 Others (Mass-Spec, Flow Cytometry)
- 5.4 By Sample Type
- 5.4.1 Blood/Plasma/Serum
- 5.4.2 Urine
- 5.4.3 Saliva
- 5.4.4 Tissue/Biopsy
- 5.4.5 Other Specimens
- 5.5 By Setting
- 5.5.1 Centralized Clinical Laboratories
- 5.5.2 Point-of-Care Testing Sites
- 5.5.3 Home-based Testing
- 5.6 By End User
- 5.6.1 Hospital Laboratories
- 5.6.2 Independent Diagnostic Laboratories
- 5.6.3 Point-of-Care Settings
- 5.6.4 Physician Office Laboratories
- 5.6.5 Other End Users
- 5.7 Geography
- 5.7.1 North America
- 5.7.1.1 United States
- 5.7.1.2 Canada
- 5.7.1.3 Mexico
- 5.7.2 Europe
- 5.7.2.1 Germany
- 5.7.2.2 United Kingdom
- 5.7.2.3 France
- 5.7.2.4 Italy
- 5.7.2.5 Spain
- 5.7.2.6 Rest of Europe
- 5.7.3 Asia-Pacific
- 5.7.3.1 China
- 5.7.3.2 Japan
- 5.7.3.3 India
- 5.7.3.4 South Korea
- 5.7.3.5 Australia
- 5.7.3.6 Rest of Asia-Pacific
- 5.7.4 Middle East and Africa
- 5.7.4.1 GCC
- 5.7.4.2 South Africa
- 5.7.4.3 Rest of Middle East and Africa
- 5.7.5 South America
- 5.7.5.1 Brazil
- 5.7.5.2 Argentina
- 5.7.5.3 Rest of South America
- 5.7.1 North America
6 Competitive Landscape
- 6.1 Market Concentration
- 6.2 Market Share Analysis
- 6.3 Company Profiles (includes Global level Overview, Market level overview, Core Segments, Financials as available, Strategic Information, Market Rank/Share for key companies, Products & Services, and Recent Developments)
- 6.3.1 Abbott Laboratories
- 6.3.2 F. Hoffmann-La Roche AG
- 6.3.3 Siemens Healthineers AG
- 6.3.4 Danaher Corporation (Beckman Coulter, Cepheid)
- 6.3.5 Thermo Fisher Scientific Inc.
- 6.3.6 Becton, Dickinson and Company
- 6.3.7 bioMerieux SA
- 6.3.8 Bio-Rad Laboratories Inc.
- 6.3.9 Hologic Inc.
- 6.3.10 Qiagen N.V.
- 6.3.11 Quest Diagnostics Inc.
- 6.3.12 Sysmex Corporation
- 6.3.13 Sonic Healthcare Ltd
- 6.3.14 Illumina Inc.
- 6.3.15 PerkinElmer (Revvity) Inc.
- 6.3.16 DiaSorin SpA
- 6.3.17 Ortho Clinical Diagnostics (QuidelOrtho)
- 6.3.18 Laboratory Corporation of America Holdings (LabCorp)
- 6.3.19 GenMark Diagnostics
- 6.3.20 Randox Laboratories
7 Market Opportunities & Future Outlook
- 7.1 White-space & Unmet-Need Assessment


